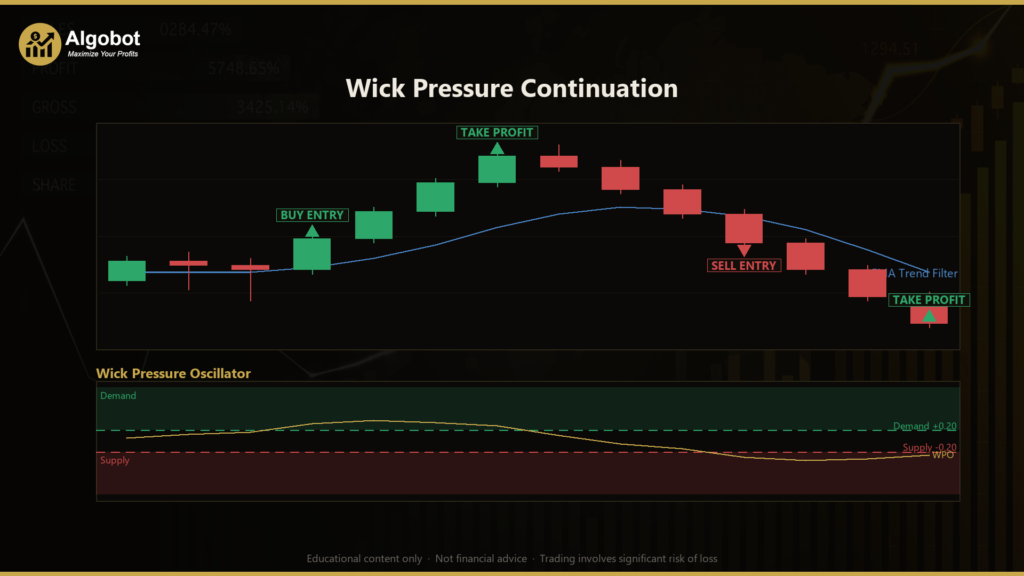
Disclaimer: This article is for educational and informational purposes only. It does not constitute financial or investment advice. Trading forex and CFDs carries significant risk of loss. Past performance of any strategy — including backtests — does not guarantee future results. Never trade with money you cannot afford to lose.
What Is This Strategy?
Wick Pressure Continuation is a trend-continuation expert advisor built around a Wick-Pressure Oscillator (WPO) — a custom momentum gauge that reads the shadows of each candlestick rather than its closing price. In candlestick terminology, a "wick" (or shadow) is the thin line above or below the candle body that marks how far price traveled before being rejected. Most oscillators are calculated from closes or bodies; this one is calculated entirely from those rejection tails, which makes it a fundamentally different lens on the same price data.
The core idea is that wicks record failed pushes. A long lower wick means sellers drove price down during the bar but buyers reclaimed the level before the close — a footprint of demand. A long upper wick means the opposite: buyers tried to lift price but sellers capped it — a footprint of supply. By aggregating that rejection signal bar after bar with a smoothing average, the strategy forms a directional "who is defending this move?" reading that a close-only indicator never captures.
This is a trend-following, dip-buying (and rally-selling) continuation approach, not a reversal system. It is designed for trending conditions on liquid instruments — the author suggests a major FX pair such as EUR/USD on the M15 to H1 timeframes, though the code locks to no specific timeframe and trades whatever chart it is attached to. As a learning tool, it is well suited to traders who want to study candlestick anatomy, oscillator construction, and how a trend filter can keep a momentum signal from firing against the prevailing drift.
How It Works
The strategy evaluates its logic once per completed bar. On each new bar it rebuilds a short history of candles, computes the wick-pressure reading, and checks whether a fresh, trend-aligned signal has appeared.
Building the Wick-Pressure Oscillator (WPO):
- For each completed candle it measures the total
range(High − Low), theupperWick(the distance from the top of the body to the High), and thelowerWick(the distance from the bottom of the body to the Low). - It computes a raw pressure value as
(lowerWick − upperWick) / range, which always falls between −1 and +1. Positive means lower-wick/demand dominance; negative means upper-wick/supply dominance. - It then smooths this raw series with an exponential moving average (EMA) of length
WickPeriodto produce the WPO. A positive WPO signals persistent buyers-defend-dips pressure; a negative WPO signals persistent sellers-defend-rallies pressure.
Entry conditions (the strategy signals a trade when both align):
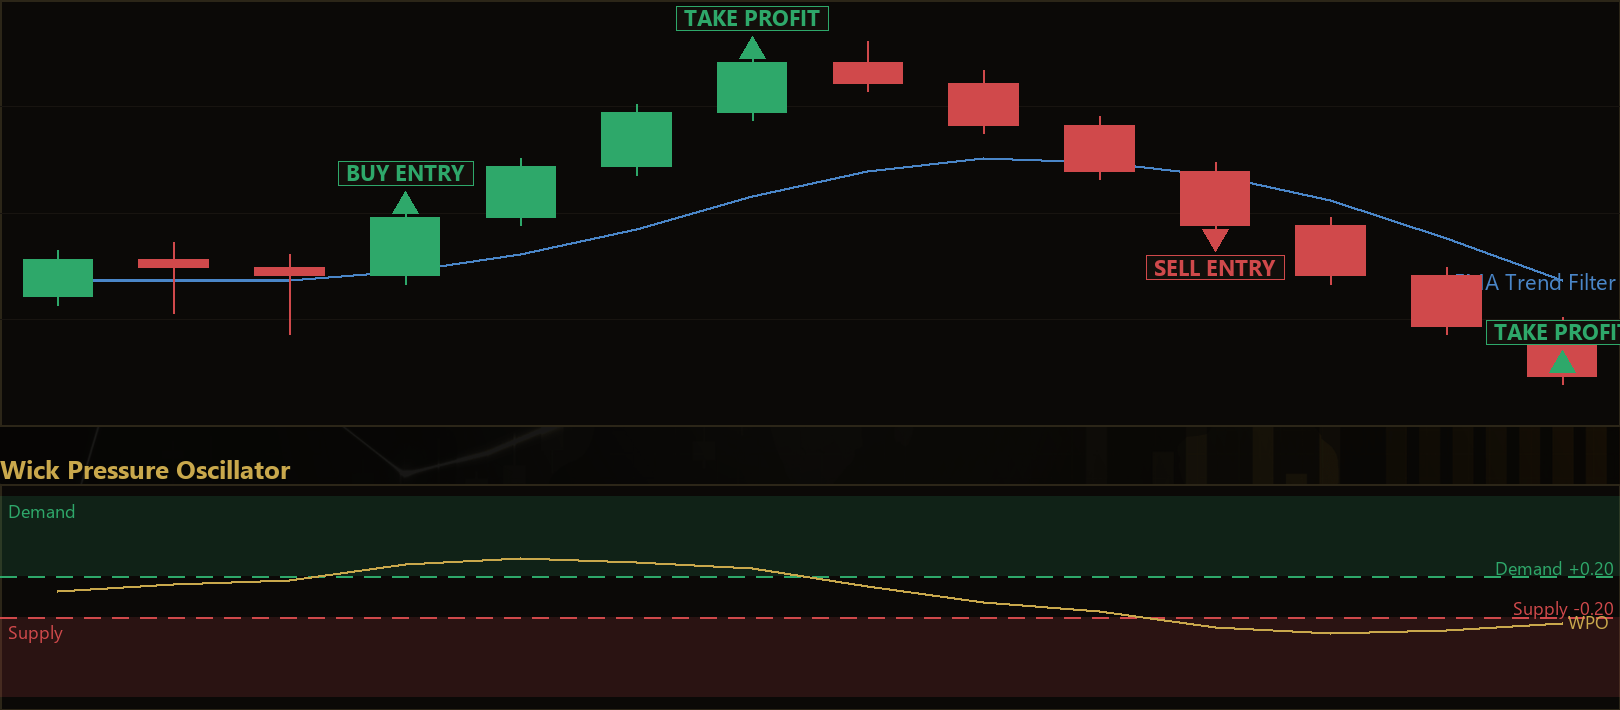
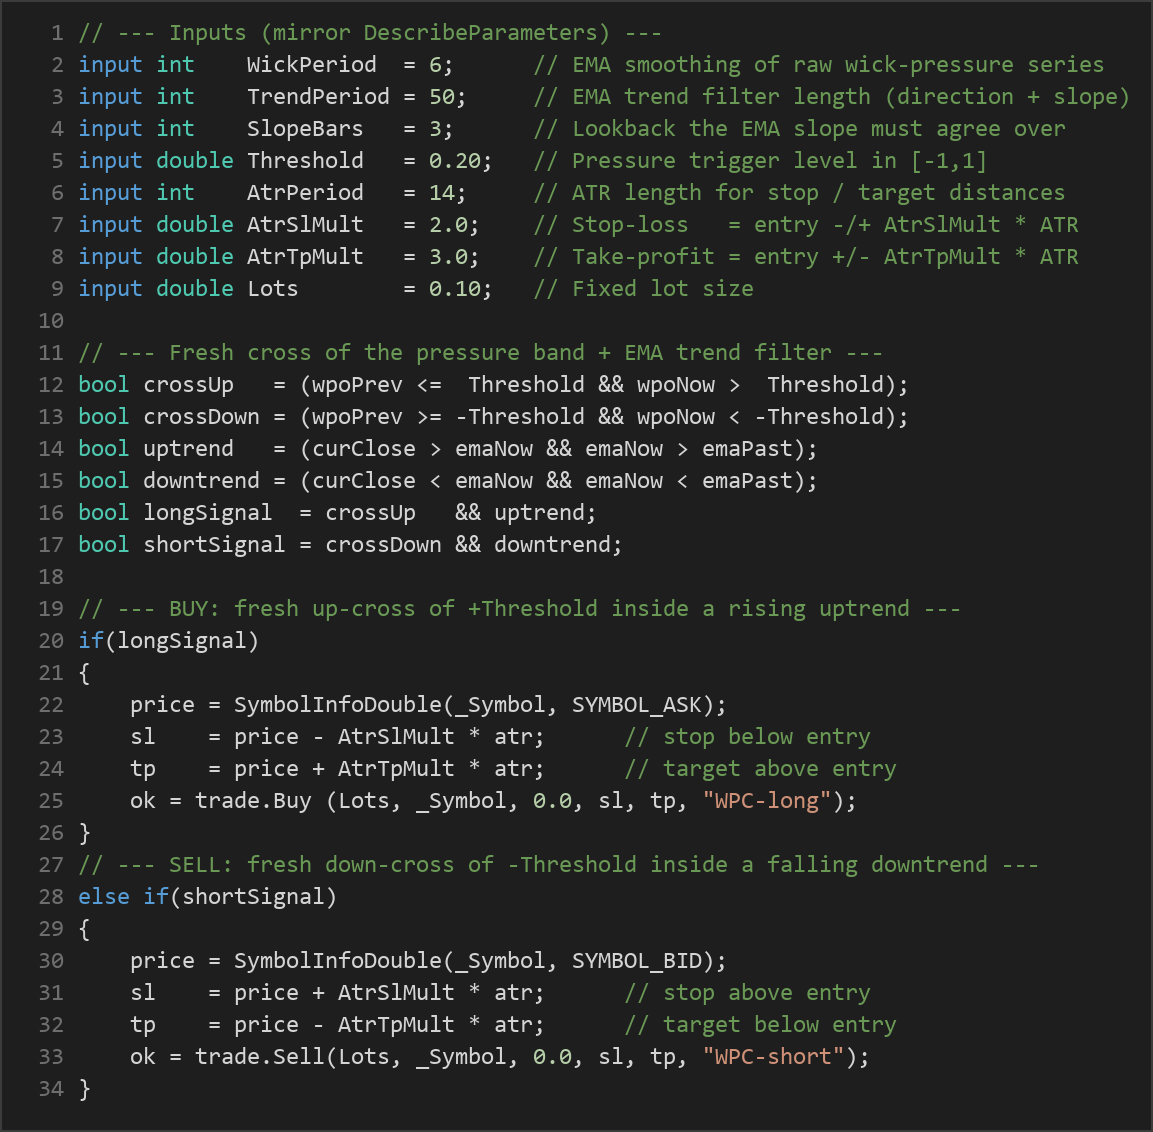
- Fresh cross only. The WPO must cross out through the trigger band this bar — inside
±Thresholdon the prior bar and beyond it now. This captures a genuine shift in pressure rather than a value that has already been parked outside the band for a while. - Trend agreement. An EMA of closing price (length
TrendPeriod) must confirm direction: for a long, price must be above the EMA and the EMA must be rising over the lastSlopeBarsbars. For a short, price must be below the EMA and the EMA must be falling. This filter keeps the strategy trading with the prevailing drift and skips counter-trend pokes. - Long signal: WPO crosses up through +Threshold, close above a rising EMA.
- Short signal: WPO crosses down through −Threshold, close below a falling EMA.
Exit conditions:
- Reversal exit. If an opposing fresh cross appears while a position is open — a downward cross against a long, or an upward cross against a short — the strategy closes the trade early because pressure has flipped.
- Stop-loss and take-profit. Otherwise the position is managed by volatility-based levels derived from the Average True Range (ATR), an indicator that measures the average size of recent bars. The stop-loss is placed
AtrSlMult × ATRaway from entry, and the take-profitAtrTpMult × ATRaway.
Only one position per magic number is held at a time, and sizing is a fixed lot. Because the parameter set is small and broadly ranged, the design deliberately resists over-fitting to a single historical window.
Strategy Parameters
| Parameter | Default | Min | Max | Description |
|---|---|---|---|---|
| WickPeriod | 6 | 3 | 20 | EMA smoothing length applied to the raw wick-pressure series; shorter values react faster, longer values are steadier. |
| TrendPeriod | 50 | 20 | 200 | Length of the closing-price EMA used as the trend direction and slope filter. |
| SlopeBars | 3 | 1 | 10 | Lookback over which the EMA slope must agree with the intended trade direction. |
| Threshold | 0.20 | 0.0 | 0.6 | Pressure trigger level within [−1, 1]; larger values demand fewer, stronger pressure shifts. |
| AtrPeriod | 14 | 7 | 30 | Number of bars used to calculate ATR for the stop and target distances. |
| AtrSlMult | 2.0 | 1.0 | 4.0 | Stop-loss distance as a multiple of ATR. |
| AtrTpMult | 3.0 | 1.0 | 6.0 | Take-profit distance as a multiple of ATR. |
| Lots | 0.10 | 0.01 | 1.0 | Fixed trade volume in lots. |
Recommended Chart Settings
The strategy was designed with a liquid FX major such as EUR/USD in mind, on the M15 to H1 timeframes. These conditions tend to offer clean candlestick structure and enough intraday trend for wick-pressure shifts to be meaningful. That said, the code is timeframe-agnostic and will run on whatever chart it is attached to. Because wick anatomy and volatility differ across instruments and sessions, results will vary considerably across different symbols, timeframes, and market conditions. Treat any new symbol or timeframe as a fresh test rather than an assumption.
How to Install on MetaTrader 5
- Download the .ex5 file from the link below.
- Copy it to your MT5
MQL5\Expertsfolder. - Restart MetaTrader 5 or refresh the Navigator panel.
- Drag the EA onto a chart matching the recommended symbol and timeframe.
- Configure the input parameters and enable Algo Trading.
What to Consider Before Using This EA
Strengths. The wick-pressure approach reads information that close-based oscillators discard, so it can register a shift in intraday control before a close-only signal would. The dual-gate design — requiring both a fresh pressure cross and trend agreement — is more disciplined than a bare oscillator cross, and the small, broadly-ranged parameter set reduces the temptation to curve-fit. The reversal-exit rule also gives the position an active way out when pressure flips, rather than waiting passively for the stop.
Limitations. Like all trend-continuation systems, Wick Pressure Continuation depends on trends actually continuing. In ranging or choppy markets, wicks form in both directions and the oscillator can produce fresh crosses that lead nowhere, resulting in whipsaw losses. The EMA trend filter helps, but a moving-average filter lags by nature and can keep the strategy aligned to a trend that is already exhausting. Wick readings can also be distorted by low-liquidity periods, news spikes, and wide spreads, where a single erratic candle skews the pressure calculation. Fixed-lot sizing does not adapt to account growth or drawdown, and a single ATR-based stop may be too tight or too loose depending on the volatility regime.
Where it may underperform. Expect the weakest behavior in tight consolidations, during major scheduled news, on illiquid pairs, and in the transition zone where a trend rolls over into a range. No indicator, including this one, can reliably distinguish a genuine continuation from a false start every time.
Risk Management Tips
- Size positions conservatively. A common educational guideline is to risk no more than 1–2% of account equity per trade. Adjust the
Lotsvalue so the ATR-based stop distance keeps any single loss within that band. - Test on a demo account first. Run the EA on a demo or a small account across varied market conditions before considering any live use, so you can observe how it behaves through both trending and ranging phases.
- Understand drawdown. Even a well-designed strategy endures losing streaks. Study the depth and duration of drawdown you can tolerate emotionally and financially before committing capital.
- Respect correlation and exposure. Avoid stacking multiple correlated positions that effectively multiply your risk on a single market theme.
- Review parameters, don't over-optimize. Small, robust parameter changes are healthier than fitting the settings tightly to one historical period.
- Keep records. Journaling trades and reviewing the EA's logs helps you understand why signals fired and whether the behavior matches your expectations.
Risk Warning
Trading foreign exchange, CFDs, and other leveraged financial instruments involves substantial risk of loss and is not suitable for all investors. The strategies and tools discussed on this page are provided for educational purposes only and do not constitute financial advice, investment recommendations, or solicitation to trade. Always consult a qualified financial adviser before making trading decisions. Past backtest performance is not indicative of future results.
Downloads
- Expert Advisor: WickPressureContinuation.ex5 (37 downloads)
- Source Code: WickPressureContinuation.mq5 (37 downloads)
- Documentation: WickPressureContinuation.pdf (37 downloads)