Disclaimer: This article is for educational and informational purposes only. It does not constitute financial or investment advice. Trading forex and CFDs carries significant risk of loss. Past performance of any strategy — including backtests — does not guarantee future results. Never trade with money you cannot afford to lose.
What Is This Strategy?
The Walsh Baseline Trend Reclaim strategy is a with-trend pullback system built around a statistically robust baseline known as the Hodges-Lehmann location estimator. Where most trend-following expert advisors draw their reference line from a simple or exponential moving average, this strategy replaces that line with the median of the Walsh averages — the same location estimate that sits behind the classic Wilcoxon signed-rank test. In plain terms, it computes every pairwise average of the last N closing prices and takes the median of those values. That single design choice is what makes the strategy distinctive.
Why bother? A conventional moving average is easily dragged around by a single news spike or an outlier wick — precisely the kind of noise that produces false pullback signals. The Hodges-Lehmann estimator is roughly 95% as efficient as the arithmetic mean on clean data, yet it has a breakdown point of about 29%, meaning nearly a third of the sample would have to be corrupted before the estimate is meaningfully distorted. The practical effect is a baseline that barely flinches when a spike bar prints, so pullback entries stay clean and the whipsaw trades that drain most pullback systems are heavily suppressed.
This is a strategy analysis intended as a learning tool for traders who want to understand robust statistics applied to price. It suits students of trend-following and mean-reversion mechanics, developers studying how to build spike-immune baselines, and anyone curious about why the choice of a central-value estimator matters. It is designed for liquid FX majors and metals on the M15 to H1 timeframes, and it trades fully symmetrically on both the long and short side.
How It Works
The strategy evaluates signals once per newly closed bar and manages any open position on every tick. It only ever holds one position at a time per magic number.
Building the robust baseline
- For each signal check, it takes the last
WindowLenclosing prices and forms every Walsh average — the average of each pair of closes(close_i + close_j) / 2for alli ≤ j. - It sorts those averages and takes their median. That median is the fair value baseline — a spike-immune central price.
Trend filter (the gate)
- It compares the baseline now to the baseline
SlopeLenbars ago. Because both endpoints are robust, the slope between them is a very stable read on direction. - The slope must clear
SlopeMinAtr × ATRto count as a genuine trend. ATR (Average True Range) is a standard volatility measure, so the threshold scales with how much the market is currently moving. - An up-slope means only long setups are considered; a down-slope means only short setups. If the slope is too flat, the strategy stands aside — this filter alone screens out choppy, directionless conditions.
Pullback and reclaim entry (do not chase)
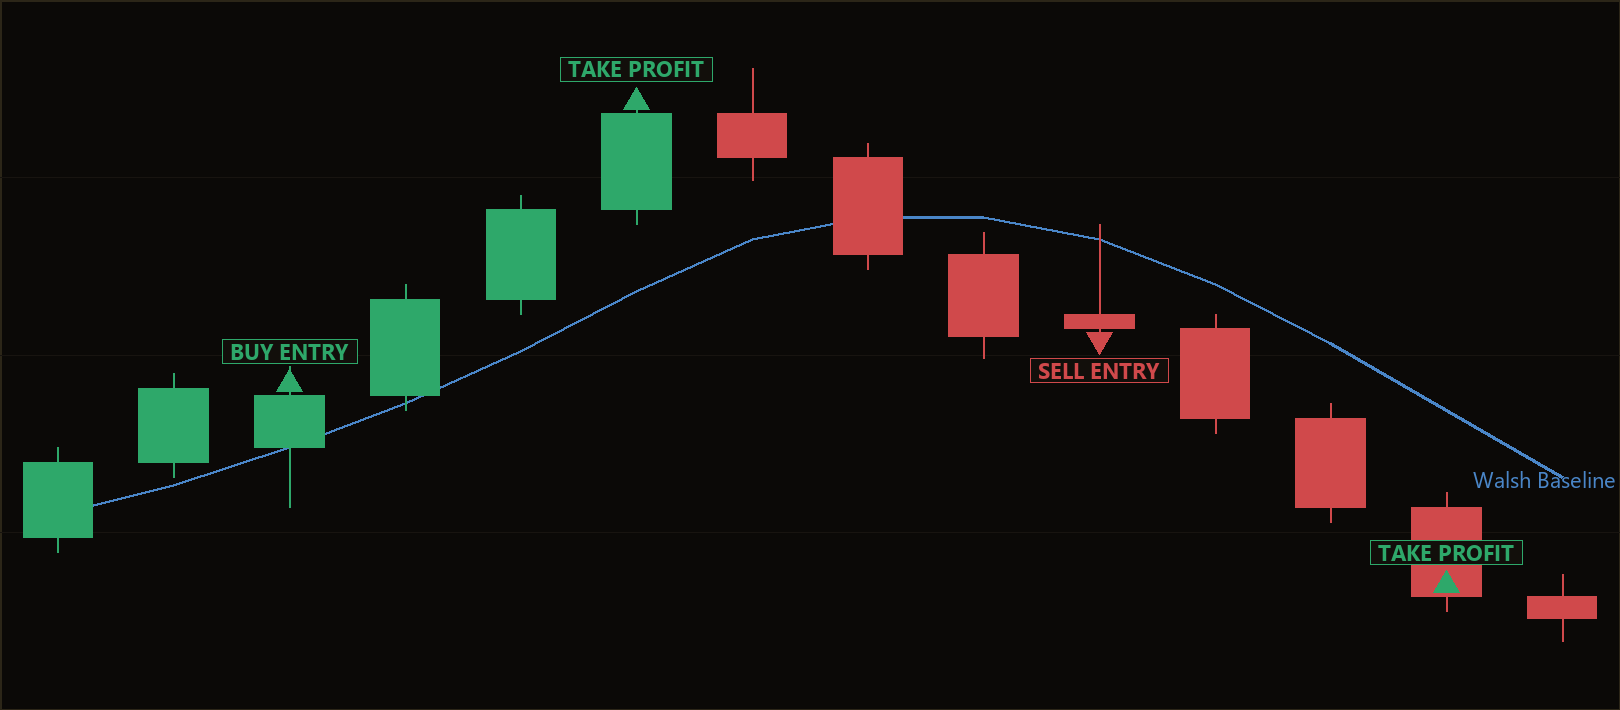
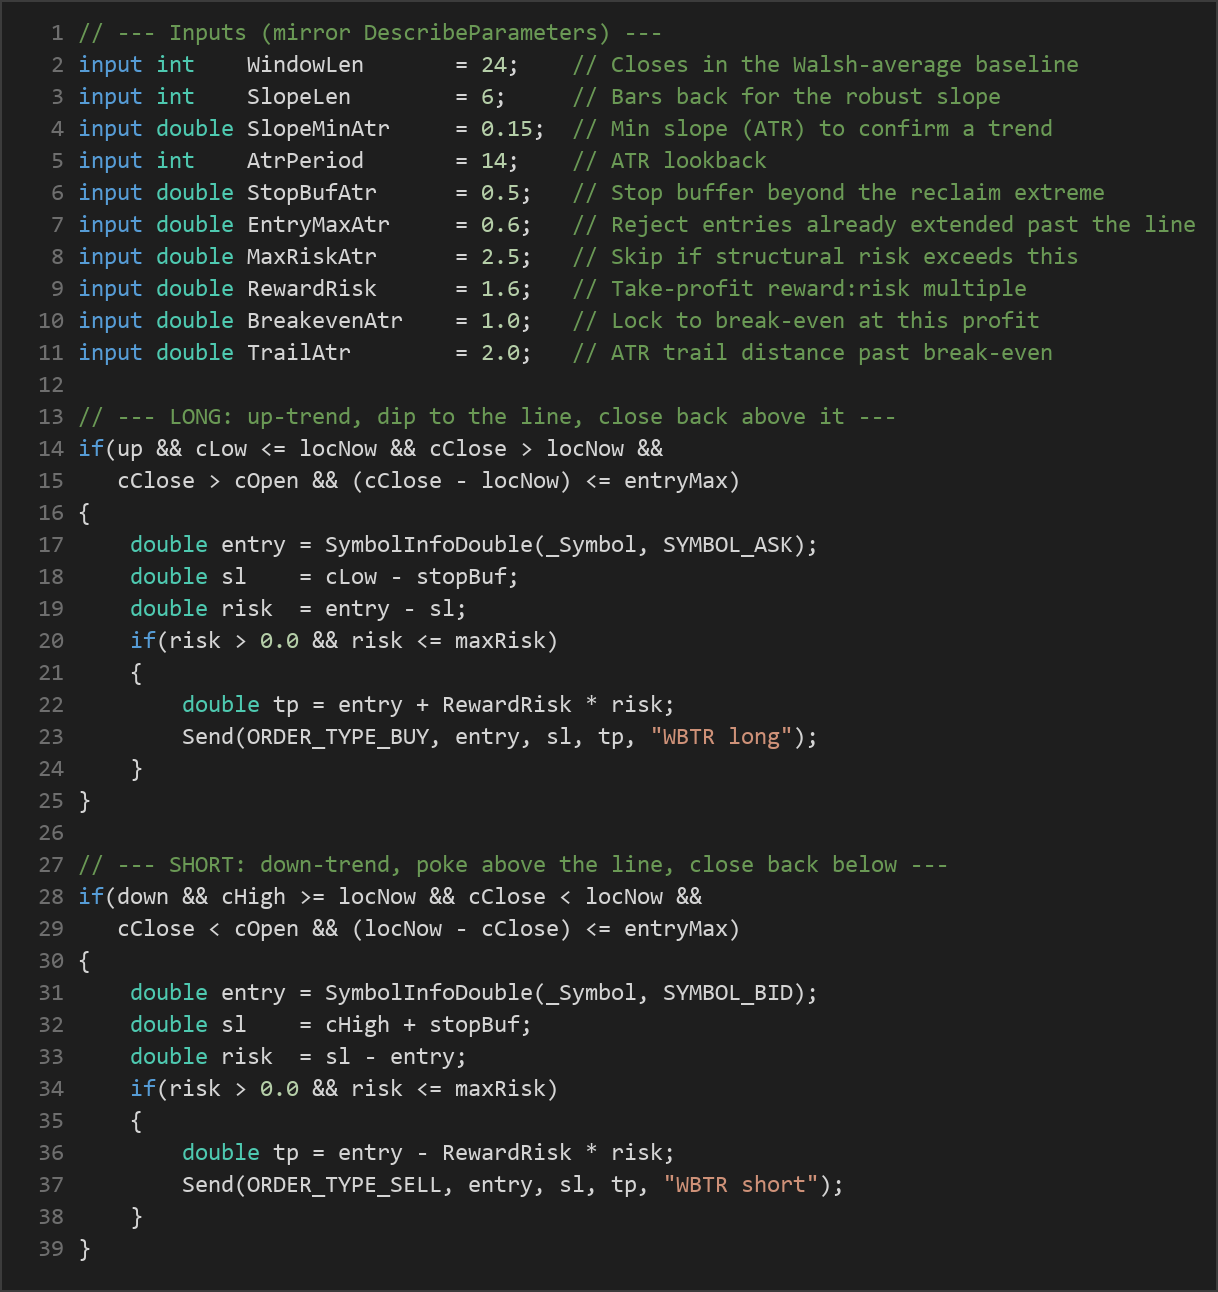
- Long: in an up-trend, the just-closed bar must dip its low to or below the baseline (a pullback into value), yet close back above the baseline with a bullish body (close above open). The close must also be within
EntryMaxAtr × ATRof the line, so the strategy never chases an already-extended bar. - Short: the mirror image — in a down-trend, the bar's high pokes above the baseline, but it closes back below it with a bearish body, and is not over-extended.
Stop-loss logic
- The stop hides just beyond the reclaim bar's extreme (its low for longs, high for shorts) plus a small
StopBufAtr × ATRbuffer. This is a tight, structure-based stop. - If that structural risk would exceed
MaxRiskAtr × ATR, the setup is skipped entirely — no oversized stops are ever taken.
Take-profit and trade management
- The take-profit is set at a fixed reward-to-risk multiple (
RewardRisk) of the structural stop distance. - Once price moves
BreakevenAtr × ATRin profit, the stop jumps to the entry price, so the trade can no longer turn into a loss. - After that, a one-directional ATR trailing stop (
TrailAtr × ATR) follows price, only ever tightening, to lock in gains as the move extends. - New entries are also skipped when the current spread is wider than
MaxSpreadPoints, avoiding costly fills during thin conditions.
Strategy Parameters
| Parameter | Default | Min | Max | Description |
|---|---|---|---|---|
| WindowLen | 24 | 8 | 60 | Number of closing prices used to build the robust Hodges-Lehmann (Walsh-average) baseline. |
| SlopeLen | 6 | 2 | 20 | How many bars back the second baseline is measured to compute the robust slope. |
| SlopeMinAtr | 0.15 | 0.02 | 0.80 | Minimum baseline slope (in ATR units over SlopeLen) required to confirm a trend. |
| AtrPeriod | 14 | 5 | 30 | ATR lookback used for volatility-scaled thresholds, stops and the trail. |
| StopBufAtr | 0.5 | 0.0 | 2.0 | Stop buffer placed beyond the reclaim bar's extreme, in ATR units. |
| EntryMaxAtr | 0.6 | 0.1 | 2.0 | Rejects entries whose close is already more than this (ATR) past the baseline. |
| MaxRiskAtr | 2.5 | 0.5 | 6.0 | Skips the setup if the structural risk exceeds this multiple of ATR. |
| RewardRisk | 1.6 | 0.8 | 4.0 | Take-profit as a reward-to-risk multiple of the structural stop distance. |
| BreakevenAtr | 1.0 | 0.2 | 3.0 | Moves the stop to break-even once this much ATR of profit is reached. |
| TrailAtr | 2.0 | 0.5 | 5.0 | ATR distance the trailing stop rides behind price once past break-even. |
| MaxSpreadPoints | 80 | 5 | 300 | Skips new entries when the current spread (in points) is wider than this. |
| Lots | 0.10 | 0.01 | 1.0 | Order volume in lots. |
| Magic | 5150 | 0 | 9,999,999 | Magic number used to identify and manage this EA's positions. |
Recommended Chart Settings
The Walsh Baseline Trend Reclaim strategy was designed with liquid FX majors and metals in mind — pairs such as EUR/USD, GBP/USD, USD/JPY, and instruments like XAU/USD — traded on the M15 to H1 timeframes. Nothing in the code is hardcoded to a particular timeframe; every price and indicator call uses the chart's own period, so the EA runs on whatever timeframe you attach it to.
Because the baseline, thresholds, stops, and trailing distance are all scaled by ATR, the strategy adapts to the local volatility of each symbol. Even so, results will vary considerably across different instruments, spreads, and market conditions. Always test on the specific symbol and timeframe you intend to run before drawing any conclusions.
How to Install on MetaTrader 5
- Download the .ex5 file from the link below.
- Copy it to your MT5
MQL5\Expertsfolder. - Restart MetaTrader 5 or refresh the Navigator panel.
- Drag the EA onto a chart matching the recommended symbol and timeframe.
- Configure the input parameters and enable Algo Trading.
What to Consider Before Using This EA
Strengths of the approach. The defining advantage here is the robust baseline. By using the Hodges-Lehmann location estimator instead of a moving average, the reference line resists distortion from spikes and news wicks — the very events that trigger false signals in conventional pullback systems. The trend gate, the "don't chase" extension filter, the capped structural risk, and the break-even-plus-trail management all reinforce a design philosophy centred on suppressing whipsaw and keeping risk tightly controlled. Trading symmetrically on both sides also means it can engage trends in either direction.
Known limitations. No baseline, however robust, changes the fundamental nature of trend-following: it needs trends to exist. In extended range-bound or violently choppy markets, the slope filter will keep the strategy sidelined much of the time, and the entries it does take may still be stopped out when a false breakout fails. The Walsh-average calculation is also more computationally involved than a moving average — it forms W × (W + 1) / 2 pairwise averages each check — though at the default window this remains lightweight.
Where it may underperform. Sharp regime shifts, low-liquidity sessions, and periods of erratic gapping can all reduce the reliability of the reclaim signal. A fixed reward-to-risk take-profit may leave gains on the table during strong runs, while the ATR trail is more forgiving there. As with any single strategy, expect stretches of drawdown and flat performance; the robust baseline reduces certain kinds of noise, but it does not eliminate losing trades.
Risk Management Tips
Risk management is what separates durable trading from luck. Consider these general principles as you study any expert advisor:
- Position sizing: Size trades so that a single loss is a small fraction of your account. A widely taught guideline is to risk no more than 1–2% of your capital per trade. The default
Lotsvalue is a starting point, not a recommendation — align it with your own account size and the strategy's ATR-based stop distances. - Test on a demo account first: Run the EA on a demo or simulated account long enough to observe how it behaves across different market conditions before considering any live capital.
- Understand drawdown: Every strategy experiences losing streaks. Know the maximum drawdown you are willing to tolerate and how it would feel to sit through it, then choose settings and sizing accordingly.
- Respect the spread and session: The
MaxSpreadPointsfilter exists for a reason. Wide spreads and thin liquidity erode edge quickly, so favour active, liquid sessions. - Never over-leverage: Leverage magnifies both directions. Keep it conservative, and never trade with money you cannot afford to lose.
Used thoughtfully, the Walsh Baseline Trend Reclaim strategy is a useful case study in how a robust statistical estimator can be applied to a familiar pullback framework — a way to learn, not a shortcut around the hard realities of risk.
Risk Warning
Trading foreign exchange, CFDs, and other leveraged financial instruments involves substantial risk of loss and is not suitable for all investors. The strategies and tools discussed on this page are provided for educational purposes only and do not constitute financial advice, investment recommendations, or solicitation to trade. Always consult a qualified financial adviser before making trading decisions. Past backtest performance is not indicative of future results.
Downloads
- Expert Advisor: WalshBaselineTrendReclaim.ex5 (17 downloads)
- Source Code: WalshBaselineTrendReclaim.mq5 (20 downloads)
- Documentation: WalshBaselineTrendReclaim.pdf (29 downloads)