Disclaimer: This article is for educational and informational purposes only. It does not constitute financial or investment advice. Trading forex and CFDs carries significant risk of loss. Past performance of any strategy — including backtests — does not guarantee future results. Never trade with money you cannot afford to lose.
What Is This Strategy?
The Vwap Slope Rsi Continuation strategy is a trend-following pullback system that combines two of the most widely watched institutional tools — the Volume-Weighted Average Price (VWAP) and the Relative Strength Index (RSI) — into a single rules-based MetaTrader 5 Expert Advisor (EA). VWAP is an average price that weights each bar by its trading volume, giving you a sense of where the "fair value" of an instrument has been over a recent window. RSI is a momentum oscillator that moves between 0 and 100 and helps gauge whether a market is temporarily overbought or oversold.
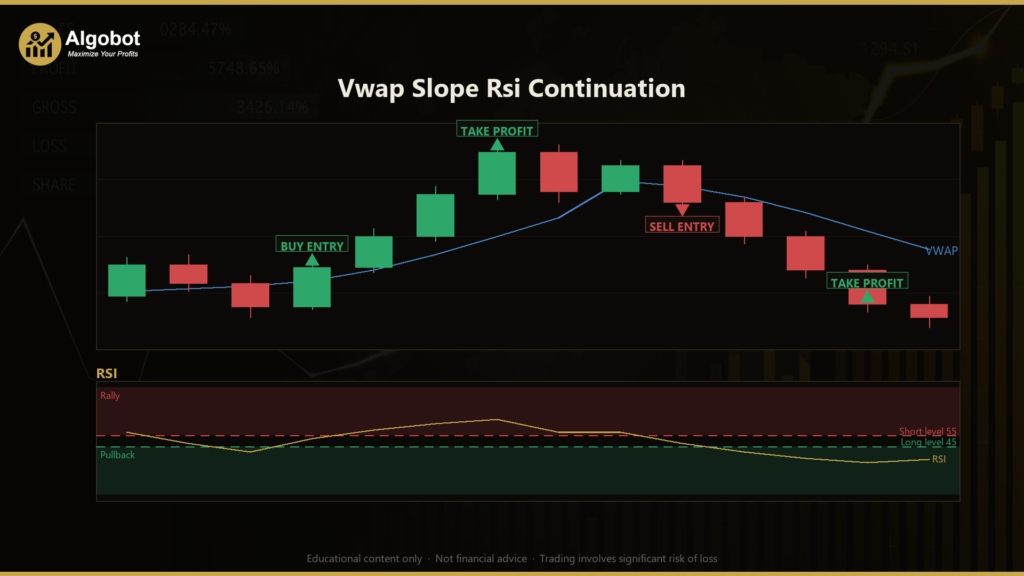
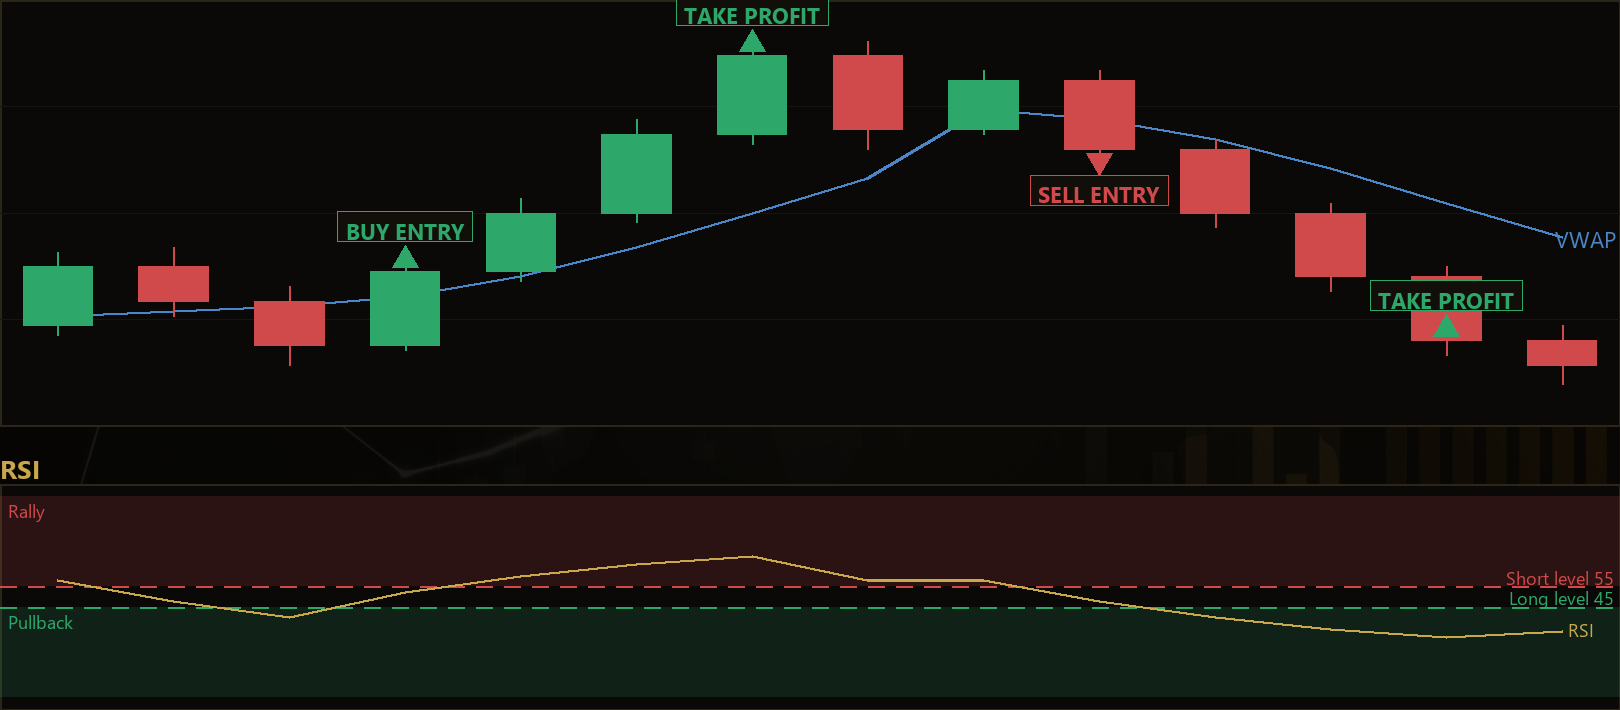
Rather than fading stretches away from VWAP (a mean-reversion approach), this strategy does the opposite. It uses the slope of VWAP to define the prevailing trend, then waits for shallow pullbacks against that trend to exhaust themselves before joining the move. In plain terms, it tries to buy shallow dips in an uptrend and sell shallow rallies in a downtrend, aiming to ride continuation moves in the direction the order flow is already leaning.
As a learning tool, this EA is well suited to traders who want to study how trend filters and momentum timing can be layered together. It is designed for trending conditions on intraday charts and is a useful case study in volatility-scaled risk, since both the stop-loss and take-profit are sized from the Average True Range (ATR). It is best treated as an educational framework for understanding pullback continuation logic — not as a shortcut to results.
How It Works
The strategy evaluates its rules once per newly closed bar on the chart's primary timeframe, using only completed bars so signals do not repaint. It maintains a rolling history of recent bars and recomputes its indicators each time a bar closes.
Trend bias (the VWAP slope):
- The strategy builds a rolling, volume-weighted VWAP using typical price
(High + Low + Close) / 3weighted by each bar's tick volume, over the most recentVwapPeriodbars. - It then computes a second VWAP over a window ending
SlopeLookbackbars earlier and compares the two. A rising VWAP signals an uptrend; a falling VWAP signals a downtrend. - Trading only in the direction of the VWAP slope keeps positions aligned with the broader value line rather than fighting it.
Pullback timing (the RSI cross):
- Inside a trend, momentum naturally ebbs and flows. The strategy does not buy strength — it waits for the moment a dip ends.
- For a long, RSI must have been at or below the
RsiPullbackLevelon the prior closed bar and must cross back up through it on the signal bar (the dip is exhausted, buyers returning). - For a short, the mirror applies using the symmetric level
100 − RsiPullbackLevel(RSI crosses back down through it as a rally fades).
Entry conditions in summary:
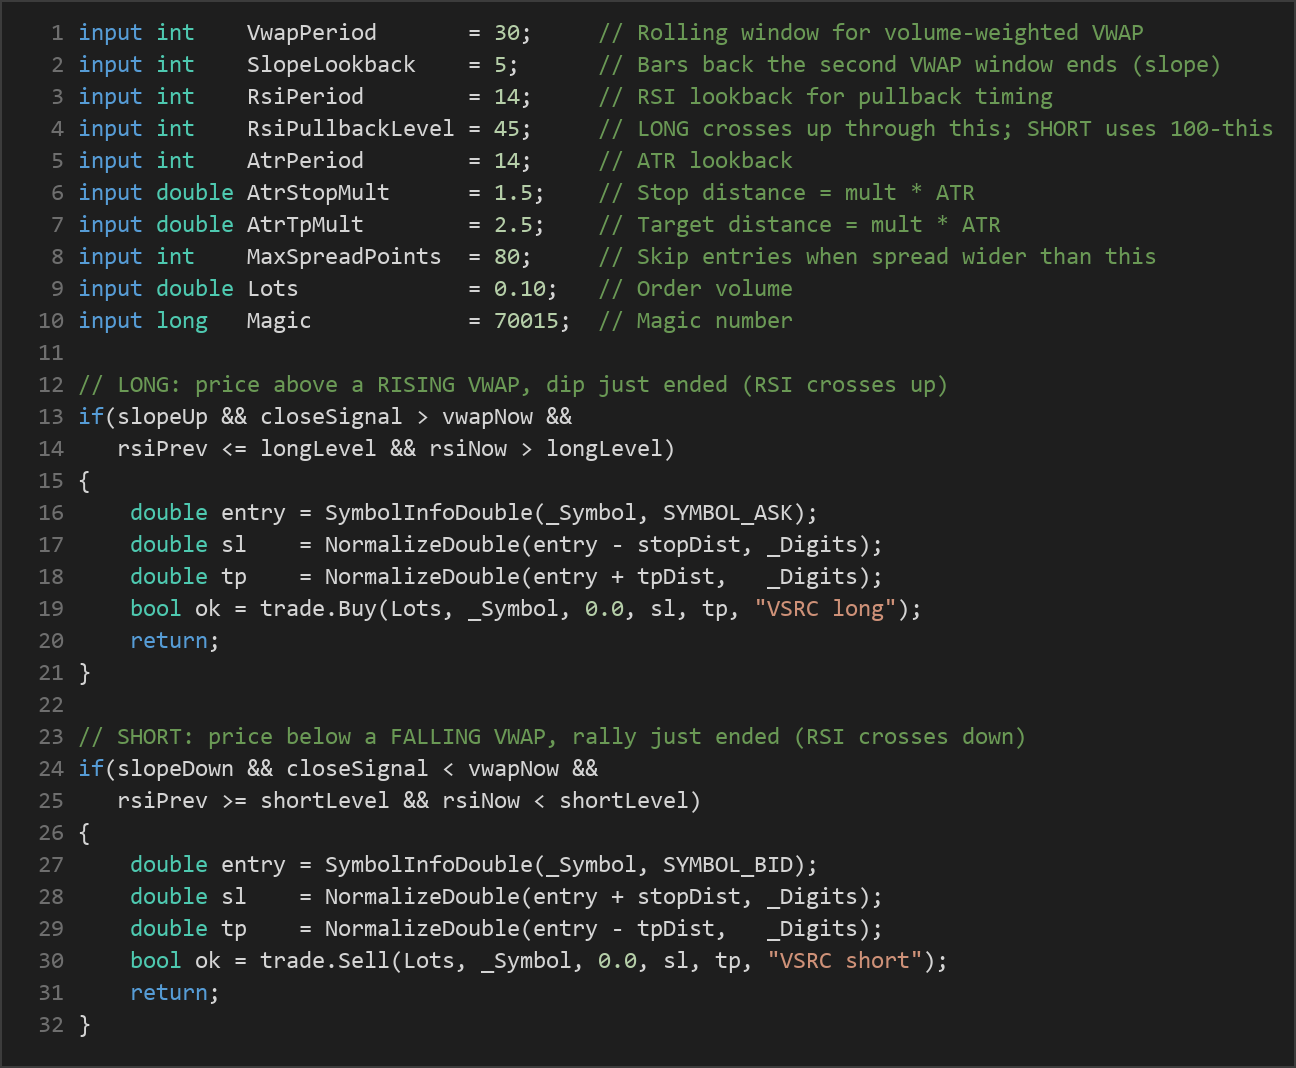
- Long — price closes above a rising VWAP and RSI crosses up through the long level.
- Short — price closes below a falling VWAP and RSI crosses down through the short level.
Exit, stop-loss, and take-profit logic:
- Risk is fully volatility-scaled. When a trade is opened, the stop-loss is placed
AtrStopMult × ATRaway from entry, and the take-profit is placedAtrTpMult × ATRaway. - Because a continuation move is expected to travel, the default target is a larger multiple of ATR than the stop, so the take-profit reflects a reward-to-risk ratio rather than VWAP itself.
- The position is then managed entirely by those bracket levels — there is no separate trailing exit.
Trade filters:
- Only one position per magic number is held at a time, so the EA will not stack entries.
- A spread filter blocks new entries when the current spread (in points) is wider than
MaxSpreadPoints, helping avoid trades when execution costs are unusually high.
Strategy Parameters
| Parameter | Default | Min | Max | Description |
|---|---|---|---|---|
| VwapPeriod | 30 | 10 | 120 | Number of closed bars in the rolling volume-weighted VWAP value line. |
| SlopeLookback | 5 | 1 | 30 | How many bars back the second VWAP window ends, used to measure VWAP slope. |
| RsiPeriod | 14 | 5 | 30 | RSI lookback period used to time the pullback. |
| RsiPullbackLevel | 45 | 30 | 50 | Long fires when RSI crosses up through this level; short uses 100 − this. Lower values demand deeper pullbacks before re-entry. |
| AtrPeriod | 14 | 5 | 30 | ATR lookback period used to measure volatility. |
| AtrStopMult | 1.5 | 0.5 | 4.0 | Stop-loss distance as a multiple of ATR. |
| AtrTpMult | 2.5 | 0.5 | 6.0 | Take-profit distance as a multiple of ATR. |
| MaxSpreadPoints | 80 | 5 | 300 | Skip new entries when the current spread (points) is wider than this. |
| Lots | 0.10 | 0.01 | 1.0 | Order volume (lot size) per trade. |
| Magic | 70015 | 0 | 9,999,999 | Magic number used to identify and manage this EA's positions. |
Recommended Chart Settings
The Vwap Slope Rsi Continuation EA was designed with trending FX majors and indices in mind — instruments such as EURUSD, US500, or XAUUSD — on intraday timeframes from M5 to M30, where VWAP trend-days and recurring intraday pullbacks are common. The EA reads whatever timeframe the chart is set to at runtime, so attach it to a chart already configured for the timeframe you want to study.
Keep in mind that behavior will vary considerably across symbols, timeframes, brokers, and market regimes. A setting that looks suitable on one instrument during a trending phase may behave very differently during ranging or low-volatility conditions. Always study the EA on historical data and a demo account before drawing any conclusions.
How to Install on MetaTrader 5
- Download the
.ex5file from the link below - Copy it to your MT5
MQL5\Expertsfolder - Restart MetaTrader 5 or refresh the Navigator panel
- Drag the EA onto a chart matching the recommended symbol and timeframe
- Configure the input parameters and enable Algo Trading
What to Consider Before Using This EA
Strengths of this approach. Pairing a trend filter with a momentum timing trigger is a well-established idea. The VWAP slope keeps entries aligned with the prevailing direction, while the RSI cross helps avoid chasing extended moves by waiting for a pullback to exhaust. Volatility-scaled stops and targets mean the risk distance adapts automatically as market conditions expand or contract, and the spread filter adds a basic guard against costly fills.
Known limitations. Trend-following pullback systems historically struggle in choppy, range-bound markets, where a rising or falling VWAP can repeatedly flip and RSI crosses produce signals that fail to follow through. Because the strategy uses a rolling VWAP rather than a true session-anchored VWAP, the value line is an approximation and may differ from the session VWAP that many institutional desks watch. The fixed ATR target also means winners are capped at a multiple of risk, so unusually strong continuation moves may not be fully captured.
Where it may underperform. Expect more whipsaws during low-volatility consolidations, around major news releases when spreads widen, and on instruments that lack reliable volume data. The single-position rule means the EA sits out additional setups while a trade is open, which may indicate missed opportunities during fast trends — a deliberate trade-off in favor of simplicity and risk control.
Risk Management Tips
Sound risk management matters more than any single parameter. Consider these general principles as you study this EA:
- Risk a small, fixed fraction per trade. Many educational sources suggest risking no more than 1–2% of account equity on any single position. Use the ATR-based stop distance and your lot size together to estimate that risk before trading.
- Size positions deliberately. The default
Lotsvalue is a starting point, not a recommendation. Position size should reflect your account size, the stop distance, and your personal risk tolerance. - Start on a demo account. Test the EA in MT5's Strategy Tester and on a demo account across different market conditions before considering any live use.
- Understand drawdown. Even a well-built trend system experiences losing streaks. Knowing the depth and duration of historical drawdowns helps you set realistic expectations and avoid abandoning a plan at the worst moment.
- Account for costs. Spreads, commissions, and slippage all affect outcomes. The spread filter helps, but real-world execution can still differ from a backtest.
Risk Warning
Trading foreign exchange, CFDs, and other leveraged financial instruments involves substantial risk of loss and is not suitable for all investors. The strategies and tools discussed on this page are provided for educational purposes only and do not constitute financial advice, investment recommendations, or solicitation to trade. Always consult a qualified financial adviser before making trading decisions. Past backtest performance is not indicative of future results.
Downloads
- Expert Advisor: VwapSlopeRsiContinuation.ex5 (58 downloads)
- Source Code: VwapSlopeRsiContinuation.mq5 (58 downloads)
- Documentation: VwapSlopeRsiContinuation.pdf (64 downloads)