
Disclaimer: This article is for educational and informational purposes only. It does not constitute financial or investment advice. Trading forex and CFDs carries significant risk of loss. Past performance of any strategy — including backtests — does not guarantee future results. Never trade with money you cannot afford to lose.
What Is This Strategy?
The Von Neumann Ratio Trend strategy is a trend-continuation approach for MetaTrader 5 that uses the von Neumann ratio — a successive-difference statistic closely related to the Durbin-Watson test used in statistics — as its core regime filter, combined with a channel breakout entry trigger. In plain terms, the strategy tries to measure how smooth a price path is before it commits to riding a move. Smoothness, in this context, is treated as evidence that a trend is orderly and persistent rather than choppy and prone to whipsaw.
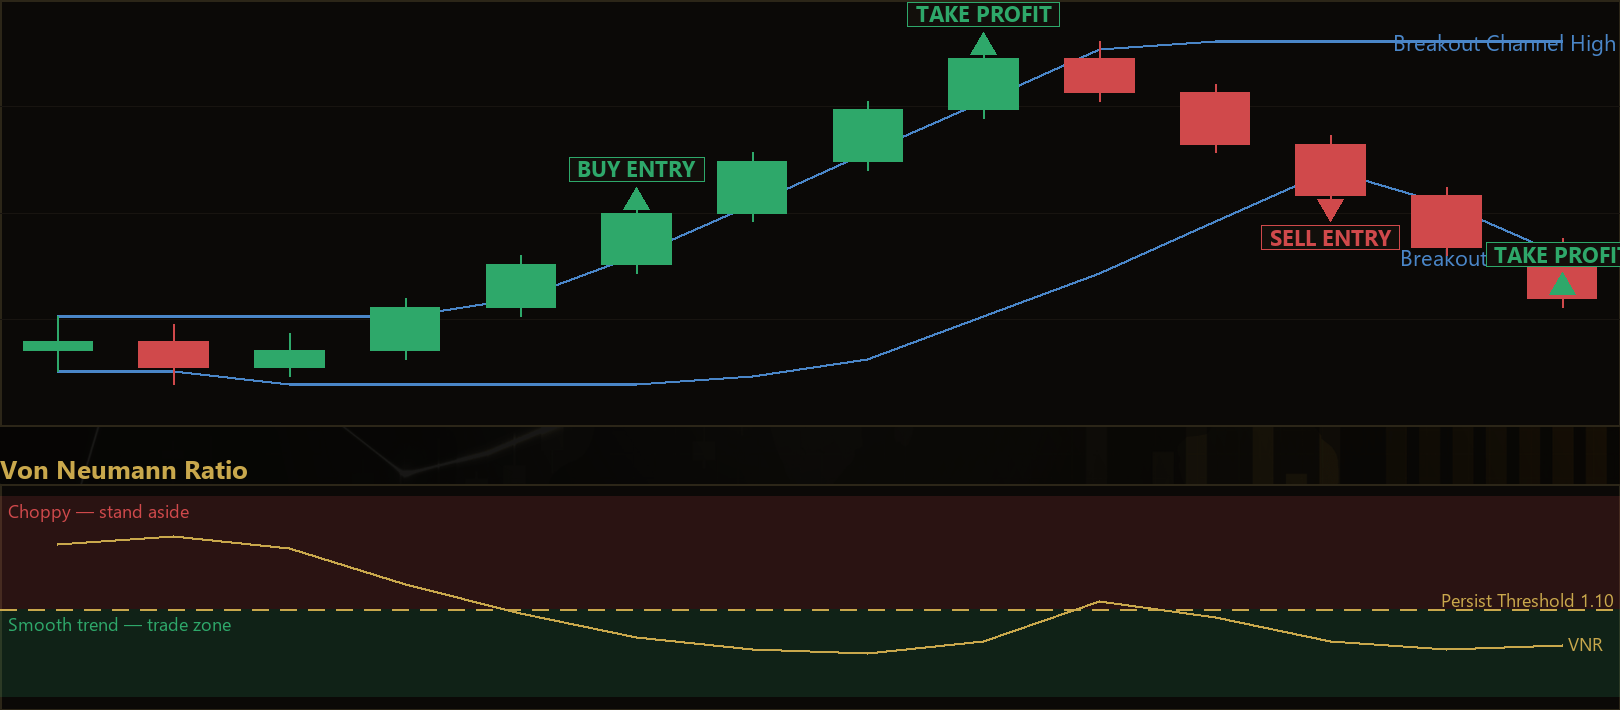
The von Neumann ratio (VNR) compares the average size of each bar-to-bar change against the overall spread of prices around their mean over a lookback window. When a market drifts steadily in one direction, each individual step is small relative to how far price has travelled from the window's average, so the ratio falls well below 1. When a market chops sideways, each step is large relative to a modest spread, and the ratio climbs toward or beyond 2 — the value you would expect from independent, random-walk-like noise. This strategy only looks for entries when the ratio is low, meaning the path is "certifiably smooth."
As a learning tool, the Von Neumann Ratio Trend is well suited to traders who want to study regime filtering — the idea that a breakout signal is only worth taking under the right market conditions. It is a good example of how a statistical measure of price behaviour can be layered on top of a simple directional trigger. It is not a beginner "set and forget" system; it rewards study of how the smoothness gate interacts with the breakout logic.
How It Works
The strategy evaluates its logic once per completed bar, using the most recently closed candle as the trigger bar. It combines a regime filter, a directional bias, and a breakout confirmation before any order is placed.
- Regime filter (the smoothness gate): The strategy computes the von Neumann ratio over the last
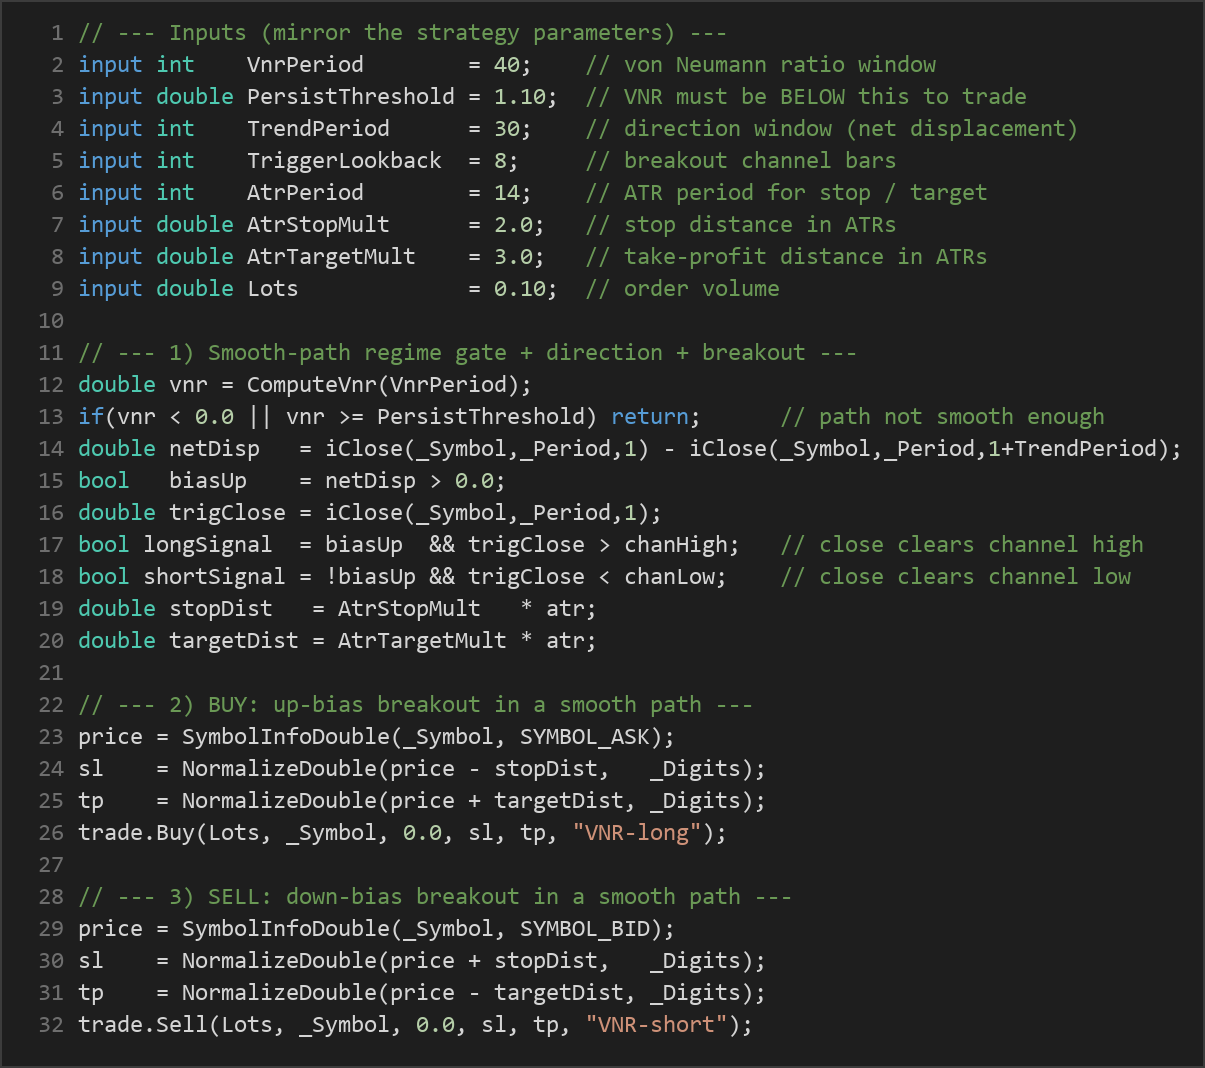
VnrPeriodclosing prices. If the VNR is at or abovePersistThreshold, the path is considered too jagged and no trade is taken. Only when the VNR falls below the threshold does the strategy consider the trend smooth enough to continue. - Directional bias: The strategy measures net displacement over
TrendPeriodbars — the current close minus the close that many bars ago. A positive value signals an up bias (long candidates only); a negative value signals a down bias (short candidates only). If displacement is exactly zero, no trade is taken. - Breakout trigger: The strategy builds a price channel from the highs and lows of the bars immediately preceding the trigger bar (a window of
TriggerLookbackbars). A long signal occurs when the trigger bar closes above that channel's high and the bias is up. A short signal occurs when it closes below the channel's low and the bias is down. This ensures entries are fresh pushes in the established direction of a smooth trend. - Stop-and-reverse logic: The strategy holds a single position per magic number. If a long signal appears while a short is open, the short is closed and a long is opened (and vice versa). This means opposing signals flip the position rather than simply stacking new trades.
- Stop-loss logic: On entry, the strategy places a protective stop at a distance of
AtrStopMultmultiplied by the current ATR (Average True Range, a volatility measure). Wider volatility produces a wider stop, so risk distance adapts to current market conditions. - Take-profit logic: A take-profit target is set at
AtrTargetMulttimes the current ATR from the entry price. With the default settings, the target is placed farther away than the stop, giving the position a reward-to-risk structure greater than 1:1.
Because every calculation uses the platform's primary symbol and timeframe, the strategy operates on a single chart and a single timeframe at a time.
Strategy Parameters
| Parameter | Default | Min | Max | Description |
|---|---|---|---|---|
| VnrPeriod | 40 | 20 | 120 | Number of closing prices used to measure the von Neumann ratio (the smoothness window). |
| PersistThreshold | 1.10 | 0.60 | 1.80 | The VNR must be below this value to trade. Lower settings act as a stricter "smooth trend only" gate. |
| TrendPeriod | 30 | 10 | 100 | Net-displacement window that sets trade direction (up bias vs. down bias). |
| TriggerLookback | 8 | 3 | 30 | Number of bars before the trigger bar whose high/low the breakout must clear. |
| AtrPeriod | 14 | 5 | 50 | ATR period used to size the stop and target. |
| AtrStopMult | 2.0 | 0.5 | 6.0 | Stop-loss distance expressed as a multiple of ATR. |
| AtrTargetMult | 3.0 | 0.5 | 10.0 | Take-profit distance expressed as a multiple of ATR. |
| Lots | 0.10 | 0.01 | 1.0 | Order volume (position size) in lots. |
Recommended Chart Settings
The Von Neumann Ratio Trend was designed as a single-symbol, single-timeframe expert advisor. A common starting point for studying this type of trend-continuation logic is a major forex pair such as EUR/USD on an H1 (1-hour) or H4 (4-hour) timeframe, where trends tend to develop with enough persistence for a smoothness filter to be meaningful. Lower timeframes tend to be noisier, which can keep the VNR elevated and reduce the number of qualifying signals.
Keep in mind that the default parameters are a neutral baseline, not an optimized configuration. Results will vary considerably across different symbols, timeframes, broker spreads, and market conditions. Any timeframe or instrument you choose should be studied on its own before drawing conclusions.
How to Install on MetaTrader 5
- Download the .ex5 file from the link below
- Copy it to your MT5
MQL5\Expertsfolder - Restart MetaTrader 5 or refresh the Navigator panel
- Drag the EA onto a chart matching the recommended symbol and timeframe
- Configure the input parameters and enable Algo Trading
What to Consider Before Using This EA
Strengths of the approach. The most distinctive feature of this strategy is its regime filter. Rather than taking every breakout, it uses the von Neumann ratio to demand statistical evidence that the path is smooth before committing. This is a rigorous, well-grounded idea: successive-difference variance is a classic tool for detecting whether a series is trending or behaving like noise. Layering a directional bias and a channel breakout on top of that filter gives the entries structure, and the ATR-based stops adapt risk to volatility rather than using fixed distances.
Known limitations. The strategy is, by design, selective — the smoothness gate can filter out many bars, so signals may be infrequent. In markets that are genuinely range-bound or erratic, the VNR may rarely drop below the threshold, and the EA can sit idle for long stretches. Conversely, no filter is perfect: a smooth path can still reverse sharply after entry, and the breakout trigger can fire near the exhaustion of a move, leading to entries just before a pullback. The stop-and-reverse behaviour means that in a whipsawing environment where signals alternate, the strategy can flip sides repeatedly and accumulate losses from spread and adverse moves.
Where it may underperform. Choppy, low-volatility ranges and news-driven spikes are the natural enemies of a smoothness-based trend follower. Because entries depend on both a low VNR and a channel breakout in the biased direction, sudden regime changes can leave the strategy on the wrong side of a reversal. Treat this EA as a framework for studying how regime filtering behaves, not as a finished, market-ready system.
Risk Management Tips
Sound risk management matters far more than any single entry rule. Consider these general principles as part of your education:
- Position sizing: Size each trade so that a full stop-loss would cost only a small, predefined fraction of your account.
- The 1–2% rule: Many educational sources suggest risking no more than 1–2% of your account balance on any single trade, so that a string of losses does not threaten your capital.
- Use a demo account first: Test any configuration on a demo or simulated account until you fully understand its behaviour across different market conditions.
- Understand drawdown: Every strategy experiences losing streaks. Study the maximum drawdown you could tolerate emotionally and financially before risking real capital.
- Account for costs: Spreads, commissions, and slippage all erode results, especially for a strategy that may stop-and-reverse frequently.
- Never over-leverage: Leverage amplifies losses as much as gains. Keep it modest while you are still learning how a strategy behaves.
Risk Warning
Trading foreign exchange, CFDs, and other leveraged financial instruments involves substantial risk of loss and is not suitable for all investors. The strategies and tools discussed on this page are provided for educational purposes only and do not constitute financial advice, investment recommendations, or solicitation to trade. Always consult a qualified financial adviser before making trading decisions. Past backtest performance is not indicative of future results.
Downloads
- Expert Advisor: VonNeumannRatioTrend.ex5 (44 downloads)
- Source Code: VonNeumannRatioTrend.mq5 (48 downloads)
- Documentation: VonNeumannRatioTrend.pdf (46 downloads)