Disclaimer: This article is for educational and informational purposes only. It does not constitute financial or investment advice. Trading forex and CFDs carries significant risk of loss. Past performance of any strategy — including backtests — does not guarantee future results. Never trade with money you cannot afford to lose.
What Is This Strategy?
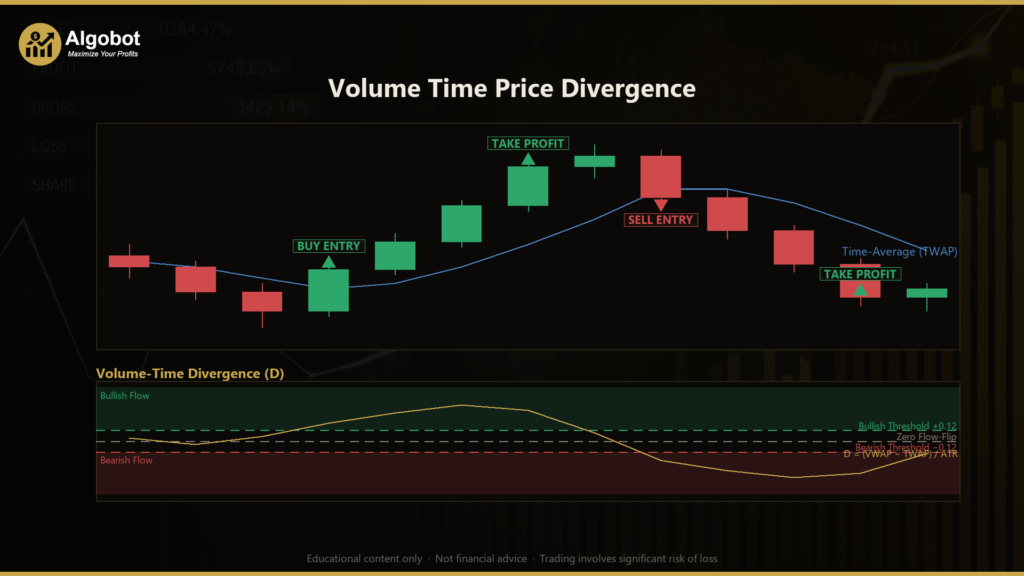
Volume Time Price Divergence is an order-flow momentum strategy that compares two different ways of averaging the same price to infer where trading conviction is building. Its core indicator is a custom divergence oscillator built from the gap between a TWAP (Time-Weighted Average Price — every bar counted equally) and a VWAP (Volume-Weighted Average Price — each bar weighted by its tick volume), normalized by the ATR (Average True Range, a standard measure of volatility). Because both averages are computed from the same typical price, they can only diverge based on where the volume actually traded — which is exactly the footprint this strategy tries to read.
The strategy is designed for liquid instruments that carry meaningful tick volume, such as EUR/USD, gold (XAU/USD), or a major index CFD. It works on whatever single timeframe you attach it to, and it belongs to the trend-following / order-flow momentum family. Rather than tracking price against a single VWAP line, it measures the difference between two averaging schemes, which lets it detect accumulation or distribution pressure even while price is largely sitting still.
As a learning tool, Volume Time Price Divergence is well-suited to traders who want to understand how volume and time can be blended to build a lightweight order-flow proxy without needing a full order book or Level II data. It is best treated as a study in market-microstructure concepts — how one-sided participation can precede directional continuation — rather than as a turnkey system. Newer traders can use it to see how normalization by volatility keeps a signal scale-free across different instruments.
How It Works
The strategy acts once per completed bar. On each new bar it rebuilds its averages over a rolling window and recomputes the divergence oscillator, then checks for entry or exit conditions.
- Building the oscillator: Over the
Lookbackwindow, the strategy computes the typical price of each bar as(High + Low + Close) / 3. It then calculates the TWAP (a plain average of those typical prices) and the VWAP (the same typical prices weighted by tick volume). The divergence value isD = (VWAP − TWAP) / ATR. - Reading the divergence: When
Dis positive, the heaviest volume printed above the time-average price — a sign that size was trading up into strength (accumulation, or bullish pressure). WhenDis negative, the heaviest volume printed below the time-average — a sign of distribution, or bearish pressure. Dividing by ATR keeps the reading scale-free so it behaves consistently across instruments. - Long entry signal: The strategy signals a long when
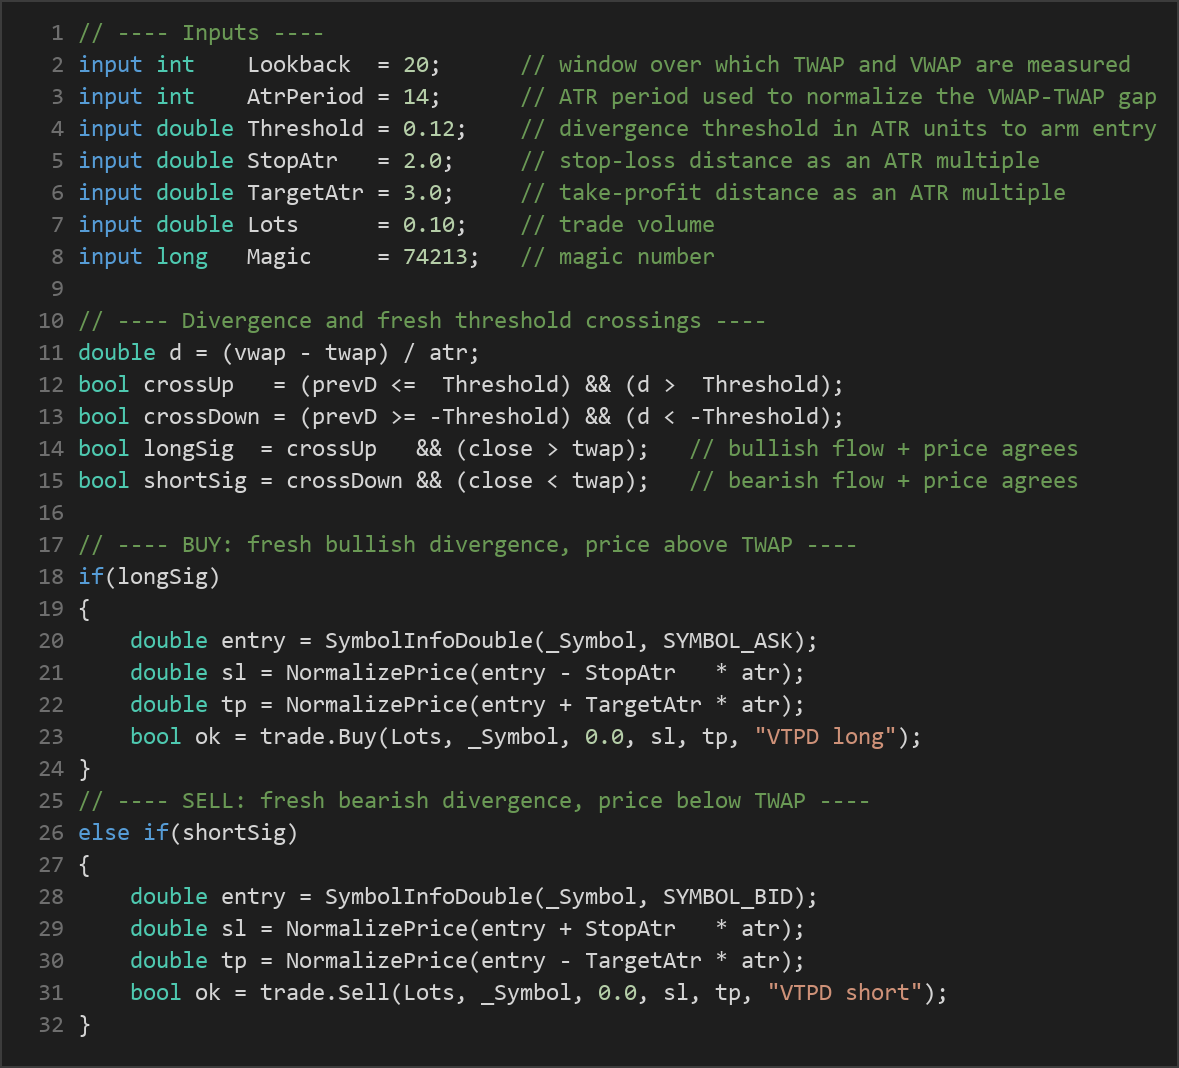
Dcrosses up through the positiveThreshold(a fresh shift, not a level that was already exceeded) and the latest close is above the TWAP, so price agrees with the bullish flow. - Short entry signal: The strategy signals a short when
Dcrosses down through the negativeThresholdand the latest close is below the TWAP, so price confirms the bearish flow. - Early exit on flow flip: While a position is open, if
Dcrosses back through zero against the trade — a positive-to-negative flip for a long, or negative-to-positive for a short — the strategy reads this as order flow reversing and closes the position early. - Stop-loss logic: Each trade places a protective stop at
StopAtr × ATRaway from entry (below entry for longs, above for shorts). Sizing the stop in ATR units means the risk distance automatically adapts to current volatility. - Take-profit logic: A target is placed at
TargetAtr × ATRfrom entry in the direction of the trade. With the default settings this gives a target roughly 1.5× the stop distance. - One position at a time: The strategy holds a single open position per symbol and magic number; the ATR stop, the ATR target, or the flow-flip exit is what closes it before a new signal can be taken.

Strategy Parameters
| Parameter | Default | Min | Max | Description |
|---|---|---|---|---|
| Lookback | 20 | 5 | 100 | Number of bars in the rolling window over which TWAP and VWAP are measured. |
| AtrPeriod | 14 | 5 | 50 | ATR period used to normalize the VWAP−TWAP gap into a scale-free divergence. |
| Threshold | 0.12 | 0.02 | 1.00 | Divergence level, in ATR units, that D must freshly cross to arm an entry. |
| StopAtr | 2.0 | 0.5 | 6.0 | Stop-loss distance expressed as a multiple of ATR. |
| TargetAtr | 3.0 | 0.5 | 10.0 | Take-profit distance expressed as a multiple of ATR. |
| Lots | 0.10 | 0.01 | 1.00 | Trade volume in lots. |
| Magic | 74213 | 0 | 9,999,999 | Magic number used to identify and manage this EA's positions. |
Recommended Chart Settings
Volume Time Price Divergence was designed for liquid instruments with meaningful tick volume — for example EUR/USD, XAU/USD (gold), or a major index CFD. It runs on whatever single timeframe you attach it to, so intraday charts such as M15, M30, or H1 are natural starting points for study because they produce enough completed bars to fill the lookback window while still reacting to fresh shifts in participation.
Because the oscillator relies on tick volume, the quality of your broker's volume feed matters. Keep in mind that results will vary considerably across different symbols, timeframes, brokers, and market conditions. Always study the behavior on a demo account first and observe how the divergence reacts to your specific instrument before drawing any conclusions.
How to Install on MetaTrader 5
- Download the .ex5 file from the link below
- Copy it to your MT5
MQL5\Expertsfolder - Restart MetaTrader 5 or refresh the Navigator panel
- Drag the EA onto a chart matching the recommended symbol and timeframe
- Configure the input parameters and enable Algo Trading
What to Consider Before Using This EA
The main strength of this approach is conceptual clarity. By comparing a time-weighted average against a volume-weighted average of the same price, Volume Time Price Divergence isolates the volume footprint from raw price action — a genuinely different mechanism from watching price cross a single VWAP line. The ATR normalization makes the signal scale-free, the fresh-crossing requirement avoids chasing stale moves, and the price-agreement filter (close relative to TWAP) reduces entries that fight the immediate trend. The flow-flip exit adds a responsive way to leave a trade when the underlying pressure reverses.
There are also real limitations to understand. Tick volume is a proxy for true traded volume; in forex there is no centralized volume feed, so readings depend on your broker and can differ between platforms. In quiet, choppy, or range-bound conditions the TWAP and VWAP can hug each other closely, producing small, noisy divergence values that whipsaw around the threshold and generate low-quality signals. Like most momentum and trend-following logic, this strategy historically tends to struggle when a market lacks sustained one-sided participation, and the flow-flip exit — while protective — can occasionally close a trade just before it would have resumed. News-driven volatility spikes can also distort both the volume weighting and the ATR normalization.
Treat this EA as an educational study rather than a finished system. Its behavior is sensitive to the Lookback and Threshold settings, and there is no single configuration that suits every instrument or regime. Forward-testing on a demo account and reviewing the trade log are the most reliable ways to learn how it responds to your chosen market.
Risk Management Tips
Sound risk management matters more than any single signal. Consider these general principles as you study the strategy:
- Risk a small, fixed fraction per trade. Many educational sources suggest risking no more than 1–2% of account equity on any one position. Because this EA sizes its stop in ATR units, you can work backward from that stop distance to choose a lot size consistent with your risk limit rather than leaving
Lotsat a default. - Understand drawdown. Every strategy experiences losing streaks. Know in advance how much peak-to-trough decline you are prepared to tolerate, and how it would feel in real terms.
- Start on a demo account. Run the EA in simulation until you understand its signal frequency, typical trade duration, and how it behaves in trending versus ranging conditions.
- Avoid over-leverage. Leverage magnifies both gains and losses; a position size that looks small can carry outsized risk on a volatile instrument like gold.
- Review, don't set-and-forget. Periodically check the logs and open positions, and be aware of scheduled high-impact news that can disrupt volume-based signals.
These points are educational guidelines, not guarantees. No amount of risk management removes the possibility of loss, and you should size and monitor positions in line with your own circumstances and a qualified adviser's guidance.
Risk Warning
Trading foreign exchange, CFDs, and other leveraged financial instruments involves substantial risk of loss and is not suitable for all investors. The strategies and tools discussed on this page are provided for educational purposes only and do not constitute financial advice, investment recommendations, or solicitation to trade. Always consult a qualified financial adviser before making trading decisions. Past backtest performance is not indicative of future results.
Downloads
- Expert Advisor: VolumeTimePriceDivergence.ex5 (51 downloads)
- Source Code: VolumeTimePriceDivergence.mq5 (52 downloads)
- Documentation: VolumeTimePriceDivergence.pdf (55 downloads)