Disclaimer: This article is for educational and informational purposes only. It does not constitute financial or investment advice. Trading forex and CFDs carries significant risk of loss. Past performance of any strategy — including backtests — does not guarantee future results. Never trade with money you cannot afford to lose.
What Is This Strategy?
The Volume Imbalance Persistence Trend strategy is a trend-following MetaTrader 5 expert advisor built around an original Directional Volume Imbalance (DVI) oscillator — a volume-based indicator that measures whether recent trading activity has been landing mostly on up-bars or on down-bars. In plain terms, DVI asks a single question about the last N candles: was the traded volume mostly backing green (bullish) bars or red (bearish) bars? The answer, expressed as a number between −1 and +1, becomes the participation signal at the heart of this system.
Unlike many volume tools, DVI is deliberately simple in what it cares about. It is not Chaikin Money Flow (which weighs where price closed inside each bar's range), it is not the Money Flow Index (an RSI built on typical-price money flows), and it is not Balance of Power (which ignores volume altogether). Instead, DVI looks only at the direction of each bar's body and how much volume backed that direction. A reading near +1 means almost every unit of volume printed on rising candles — a sign buyers were in control. A reading near −1 means volume clustered on falling candles. A reading near 0 means participation was split, with no clear edge either way.
This strategy is designed as a learning tool for traders who want to study how volume-based participation signals can be combined with classic trend and volatility filters. It is best suited to liquid instruments such as major forex pairs, metals, or index CFDs (for example EURUSD, XAUUSD, or US500) on intraday timeframes like M15 to H1, where tick volume is a reasonable proxy for market participation and trends tend to persist. It is offered here to help you understand the mechanics of signal confirmation — not as a shortcut to trading success.
How It Works
The strategy evaluates its logic only once per newly closed bar, so it never reacts to the noise of a candle that is still forming. On each closed bar it computes three independent readings and requires all of them to agree before it acts.
Here is what the strategy signals and how each piece fits together:
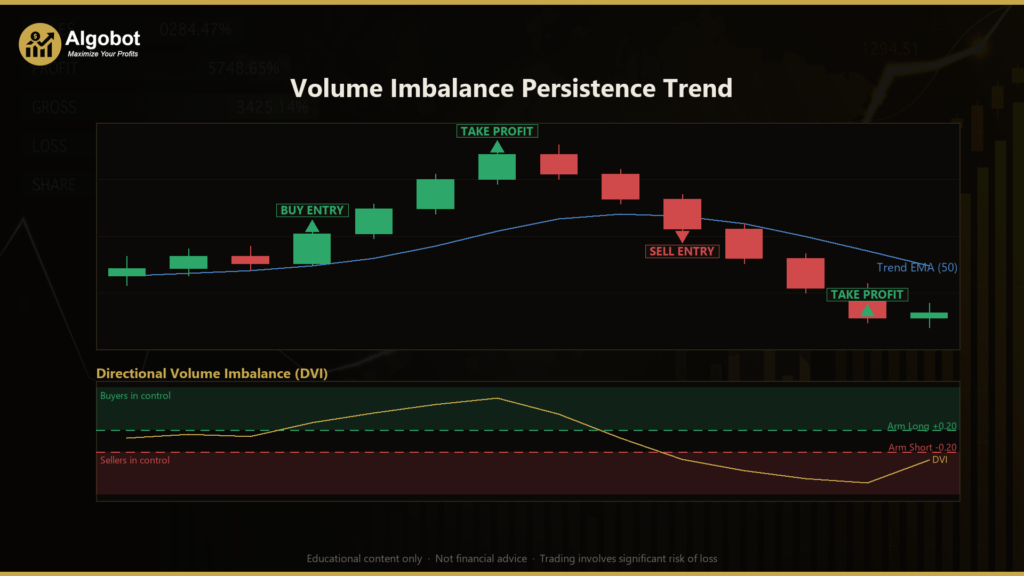
- The DVI oscillator (participation): For each of the last N closed bars, the strategy assigns a side — +1 if the bar closed above its open, −1 if it closed below, and 0 for a doji. It multiplies each side by that bar's tick volume, sums the results, and divides by total volume. This produces the DVI value between −1 and +1.
- Entry condition 1 — Trend: The slope of a price Exponential Moving Average (EMA) — a moving average that gives more weight to recent prices — must point in the trade's direction. Longs require the EMA to be rising; shorts require it to be falling. The strategy only trades participation bursts that align with the prevailing drift, never against it.
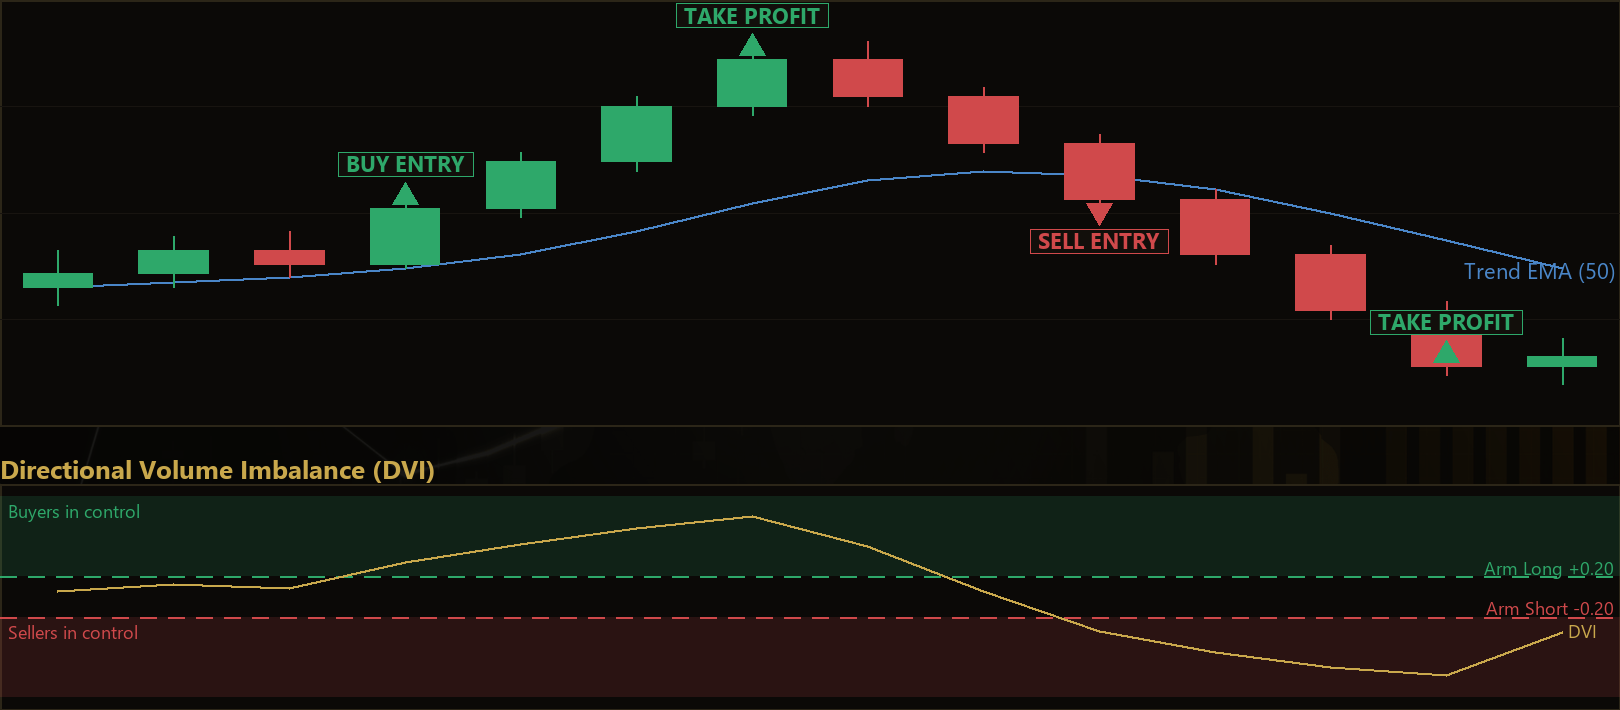
- Entry condition 2 — Event (the crossing): DVI must cross its threshold on this bar, not merely sit beyond it. For a long, DVI must rise up through +Threshold having been at or below it last bar. For a short, DVI must fall down through −Threshold. Requiring a fresh crossing turns a persistent state into a discrete ignition signal and stops the strategy from re-firing every bar while the regime holds.
- Entry condition 3 — Candle confirmation: The trigger bar itself must close in the trade direction — a green body for longs, a red body for shorts — as a final confirmation that price action agrees with the volume read.
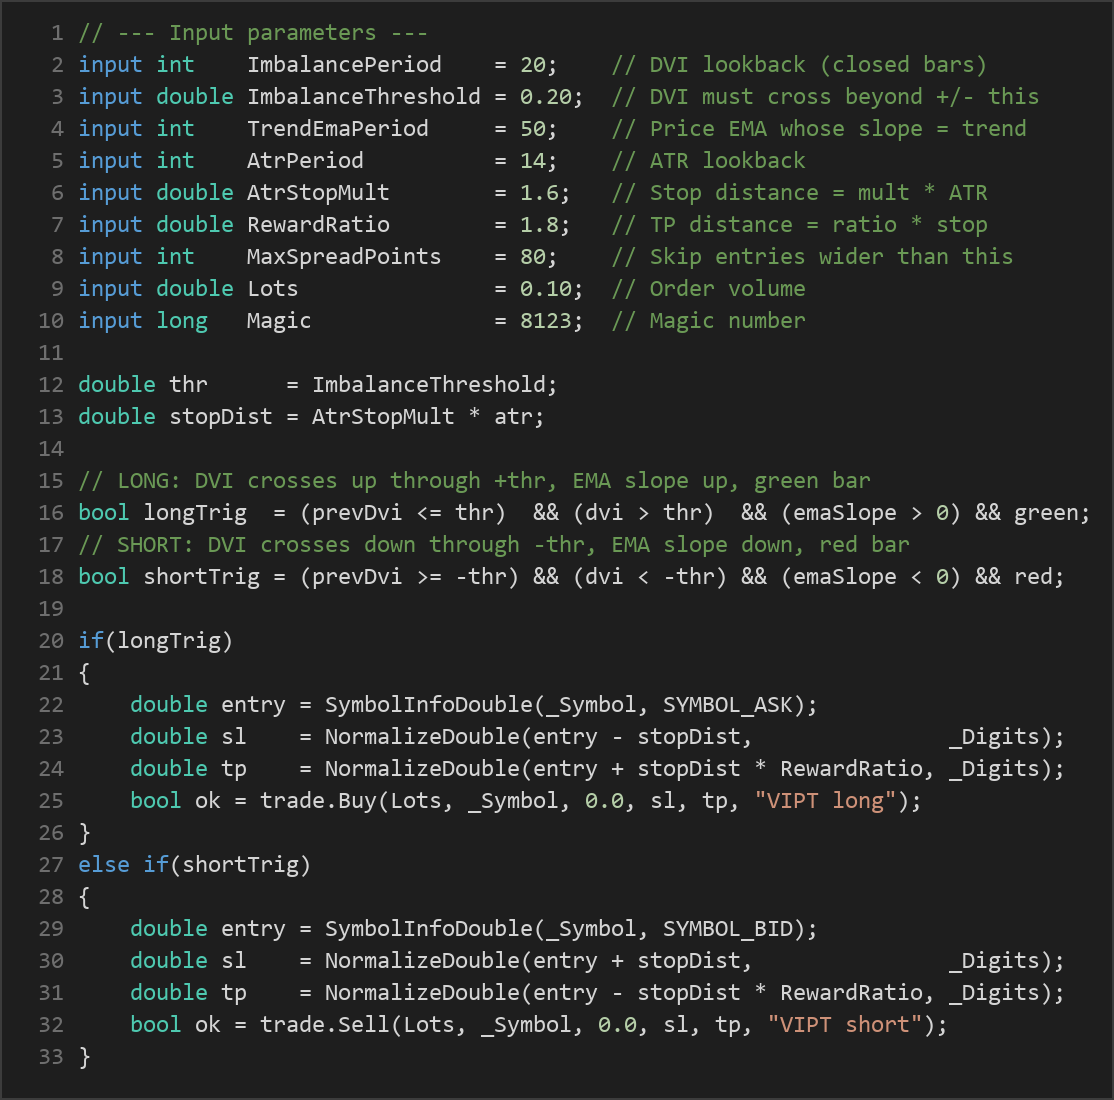
- Long entry: When DVI crosses up through +Threshold, the EMA slope is positive, and the trigger bar is green, the strategy signals a buy at the Ask price.
- Short entry: When DVI crosses down through −Threshold, the EMA slope is negative, and the trigger bar is red, the strategy signals a sell at the Bid price.
Exits are handled entirely by a protective stop-loss and a take-profit target set at entry:
- Stop-loss logic: The stop is placed one ATR-multiple away from entry. ATR (Average True Range) is a volatility measure, so the stop automatically breathes wider in volatile conditions and tighter in calm ones. For a long, the stop sits below entry; for a short, above it.
- Take-profit logic: The target is placed at the stop distance multiplied by the RewardRatio. With the default 1.8 ratio, the target sits 1.8 times farther from entry than the stop.
- Position management: Only one position per magic number is held at a time. A max-spread filter blocks new entries when the spread is wider than the configured limit, helping avoid entries in thin or illiquid conditions. Once open, the ATR stop and reward target manage the exit — there is no re-entry while a position is live.
Because DVI is volume-normalised, the ATR stop scales with volatility, and the spread filter guards liquidity, the system is designed to be comparable across different symbols and sessions.
Strategy Parameters
| Parameter | Default | Min | Max | Description |
|---|---|---|---|---|
| ImbalancePeriod | 20 | 5 | 60 | Number of closed bars used to compute the Directional Volume Imbalance oscillator. |
| ImbalanceThreshold | 0.20 | 0.05 | 0.60 | DVI must cross beyond ±this value to arm a trade. A value of 0.20 corresponds to roughly a 60/40 volume tilt. |
| TrendEmaPeriod | 50 | 20 | 200 | Lookback period for the price EMA whose slope defines the tradable trend direction. |
| AtrPeriod | 14 | 5 | 30 | Lookback period for the ATR used to size the protective stop. |
| AtrStopMult | 1.6 | 0.5 | 4.0 | Stop distance expressed as a multiple of ATR. |
| RewardRatio | 1.8 | 0.5 | 5.0 | Take-profit distance as a multiple of the stop distance. |
| MaxSpreadPoints | 80 | 5 | 300 | Skip new entries when the current spread (in points) is wider than this. |
| Lots | 0.10 | 0.01 | 1.0 | Order volume in lots. |
| Magic | 8123 | 0 | 9,999,999 | Magic number used to identify and manage this strategy's positions. |
Recommended Chart Settings
The Volume Imbalance Persistence Trend strategy was designed for liquid instruments where tick volume is a meaningful proxy for participation — major forex pairs such as EURUSD, metals such as XAUUSD, or index CFDs such as US500. Its natural home is the M15 to H1 timeframe range, where intraday trends tend to persist long enough for the ATR-based target to be reached.
The strategy reads only the primary timeframe selected on the chart at run time — it does not consult a second timeframe. This means the same code behaves differently depending on the chart you attach it to, so it is worth studying its behaviour on the specific symbol and timeframe you intend to test. Keep in mind that results will vary considerably across different market conditions; a setting that behaves one way in a trending market may behave very differently in a choppy, range-bound one.
How to Install on MetaTrader 5
- Download the .ex5 file from the link below
- Copy it to your MT5
MQL5\Expertsfolder - Restart MetaTrader 5 or refresh the Navigator panel
- Drag the EA onto a chart matching the recommended symbol and timeframe
- Configure the input parameters and enable Algo Trading
What to Consider Before Using This EA
Every strategy has trade-offs, and understanding them is more valuable than any single setting. Here is a balanced view of the Volume Imbalance Persistence Trend approach.
Strengths. The triple-confirmation design — trend, crossing event, and candle direction — is intentionally conservative. By requiring a fresh DVI crossing rather than a static high reading, the strategy avoids re-firing repeatedly while a regime persists, which can reduce over-trading. The DVI oscillator is volume-normalised, so its readings are broadly comparable across symbols and sessions, and the ATR-based stop adapts to changing volatility rather than using a fixed distance. The max-spread filter adds a further layer of caution by skipping entries when trading conditions are thin.
Known limitations. Tick volume in forex is not true exchange volume — it counts price changes, not contracts traded — so DVI is only ever an approximation of real participation. The strategy is fundamentally trend-following, which means it may historically underperform in sideways, choppy markets where EMA slopes flip frequently and false crossings appear. Because it takes only one position at a time and waits for a discrete ignition signal, it can miss extended moves that never produce a clean threshold crossing. The fixed RewardRatio target may also cap gains during strong trends while the ATR stop is tested during volatile pullbacks.
Where it may struggle. Range-bound conditions, low-liquidity sessions, and news-driven volatility spikes can all produce misleading signals. No indicator combination removes the risk of losing trades, and this one is no exception. Treat it as a framework for studying how volume, trend, and volatility filters interact — not as a finished, guaranteed system.
Risk Management Tips
Sound risk management matters far more than any entry signal. As you study this strategy, keep these general principles in mind:
- Risk a small, fixed fraction per trade. Many educational sources suggest never risking more than 1–2% of your account on a single position. Adjust the Lots parameter so the distance to your stop-loss represents only that small fraction of your capital.
- Test on a demo account first. Run the strategy in a risk-free demo environment for an extended period before considering any live capital. This lets you observe how it behaves across trending and ranging conditions.
- Understand drawdown. Every strategy experiences losing streaks. Study the maximum drawdown — the largest peak-to-trough drop — so you know what you would need to tolerate emotionally and financially.
- Size positions deliberately. Position sizing, not prediction, is what keeps an account intact through inevitable losing periods. Never increase size to "make back" a loss.
- Diversify and stay informed. Avoid concentrating all your risk in a single symbol or a single strategy, and be aware of scheduled economic news that can disrupt technical signals.
By treating this expert advisor as a study aid rather than a hands-off solution, you will learn how confirmation-based systems are constructed and where their weaknesses lie.
Risk Warning
Trading foreign exchange, CFDs, and other leveraged financial instruments involves substantial risk of loss and is not suitable for all investors. The strategies and tools discussed on this page are provided for educational purposes only and do not constitute financial advice, investment recommendations, or solicitation to trade. Always consult a qualified financial adviser before making trading decisions. Past backtest performance is not indicative of future results.
Downloads
- Expert Advisor: VolumeImbalancePersistenceTrend.ex5 (30 downloads)
- Source Code: VolumeImbalancePersistenceTrend.mq5 (33 downloads)
- Documentation: VolumeImbalancePersistenceTrend.pdf (38 downloads)