Disclaimer: This article is for educational and informational purposes only. It does not constitute financial or investment advice. Trading forex and CFDs carries significant risk of loss. Past performance of any strategy — including backtests — does not guarantee future results. Never trade with money you cannot afford to lose.
What Is This Strategy?
The Volume Contraction Pullback Trend strategy is a trend-continuation system built around Volume Spread Analysis (VSA) — the "No Supply / No Demand" test-bar concept popularised by Tom Williams and rooted in the earlier work of Richard Wyckoff. Instead of hunting for a volume surge, it does the opposite: it looks for the absence of opposing volume during a pullback, then waits for the trend to resume. It combines a sloped Exponential Moving Average (EMA) trend filter — a moving average that weights recent prices more heavily — with a narrow-spread, low-volume candle test and an Average True Range (ATR) volatility bracket for risk.
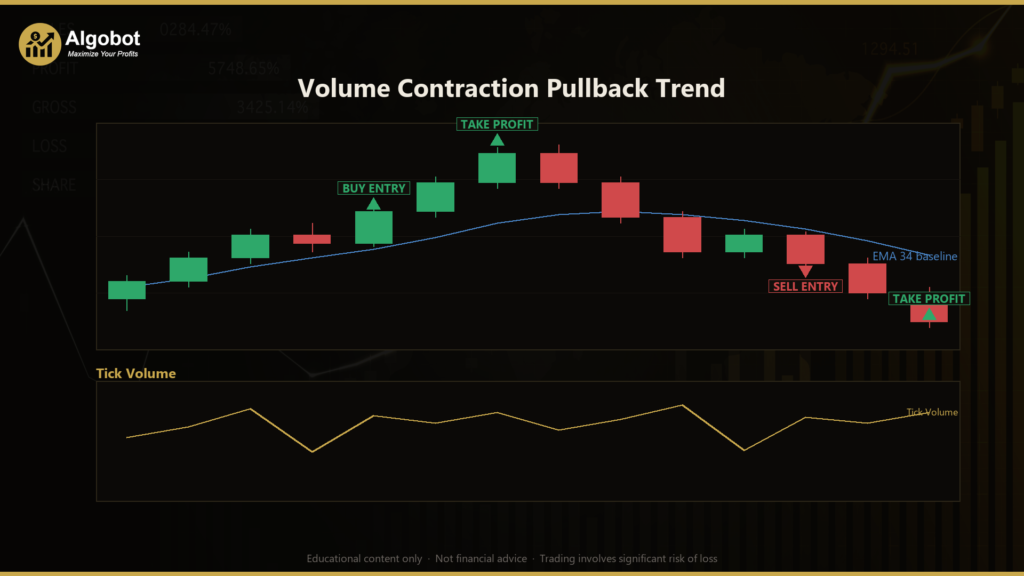
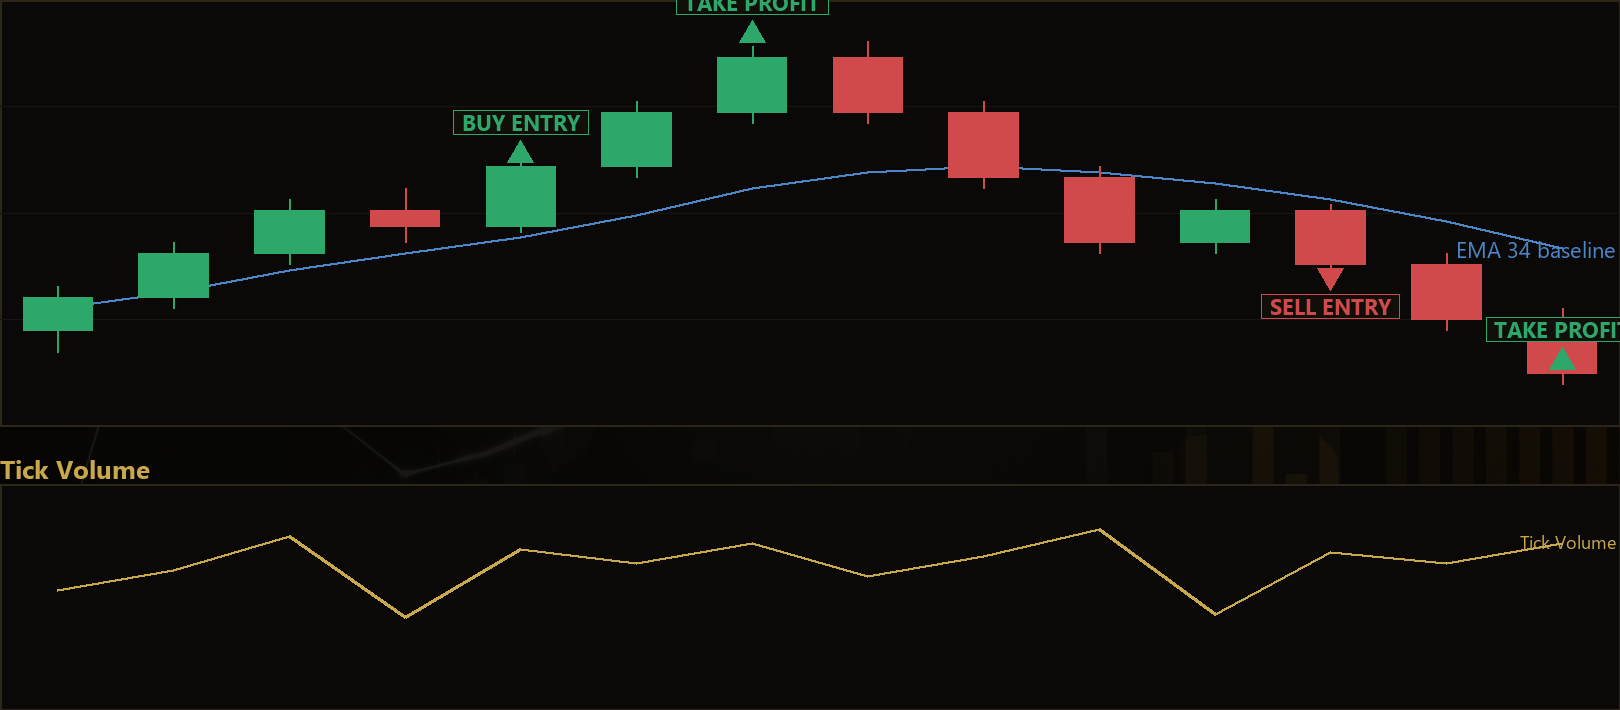
The core idea is simple to state. During a healthy trend, a genuine counter-trend pullback that the crowd is unwilling to press should arrive quietly: on a narrow spread (a small high-to-low range relative to recent volatility) and on shrinking tick volume. In an uptrend, a small down bar on falling volume suggests sellers are absent — a classic "No Supply" test. In a downtrend, a small up bar on falling volume suggests buyers are absent — a "No Demand" test. The strategy treats this quiet counter-move as a warning, not a signal, and only acts when the next bar confirms the trend by closing back through the test bar.
As a learning tool, this strategy is well suited to traders who want to study how volume and spread interact with price structure, rather than relying on price alone. It is designed for trending markets on liquid instruments and is best treated as an educational example of how VSA logic can be encoded into a rules-based Expert Advisor (EA). It is not a shortcut, and it will sit on its hands during choppy, directionless conditions — which is by design.
How It Works
The strategy evaluates one newly closed bar at a time. It labels the just-closed bar the confirm bar (c) and the bar immediately before it the test bar (p). Every condition below must line up before a trade is signalled.
Trend filter (regime):
- An EMA of closing prices is calculated over
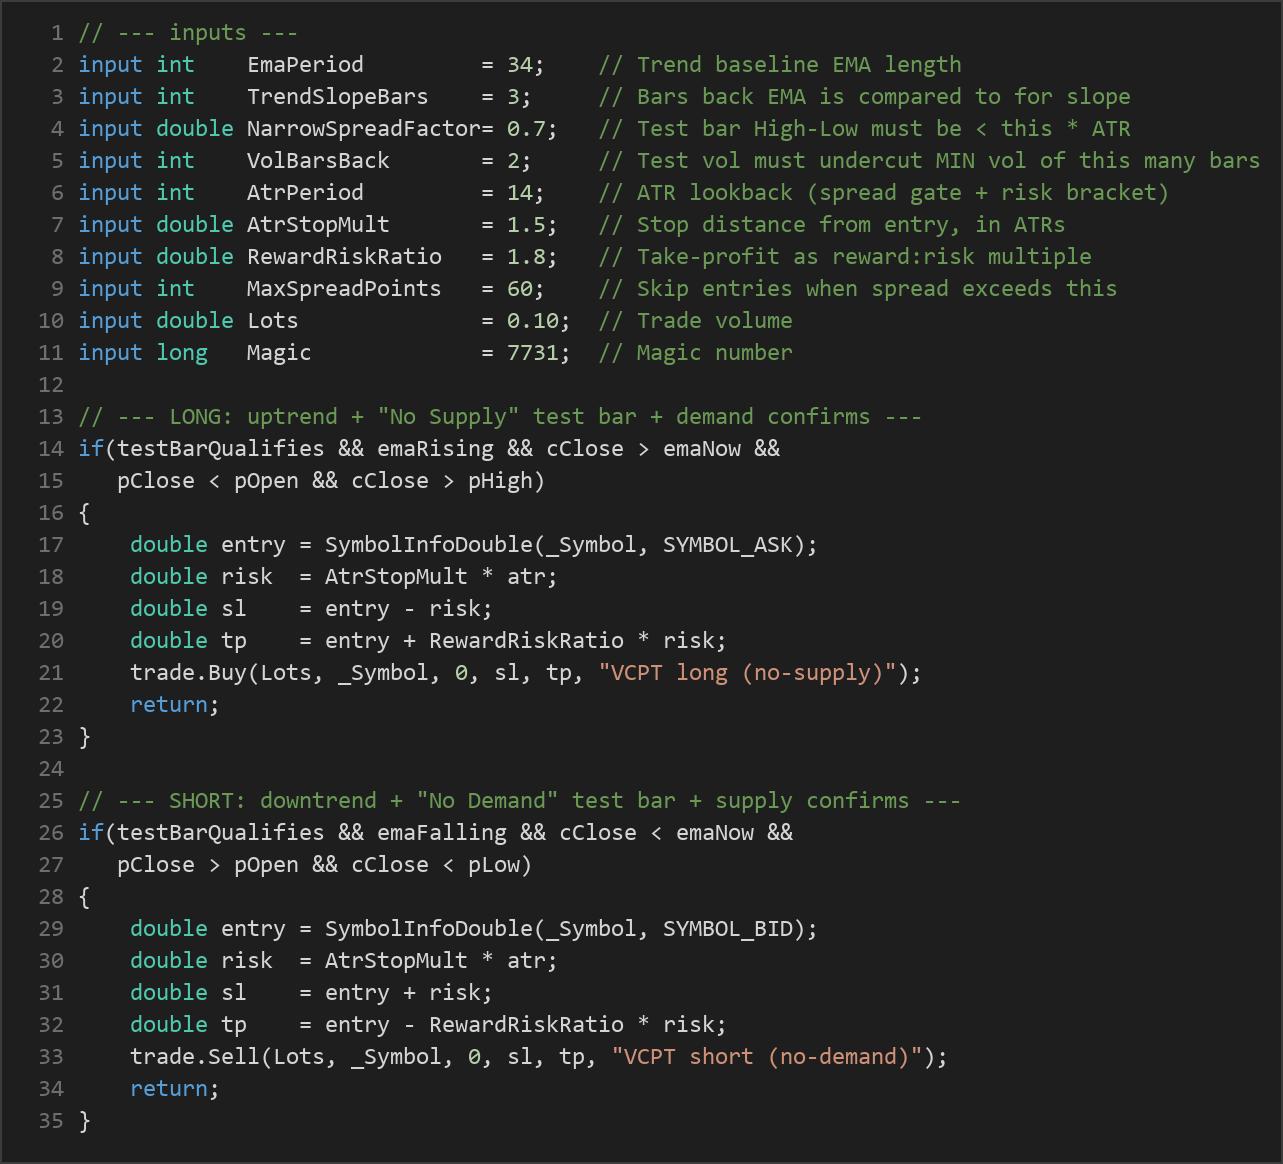
EmaPeriodbars. - Its slope is measured by comparing the EMA now against the EMA
TrendSlopeBarsbars ago. - A rising EMA defines an uptrend (long-only regime); a falling EMA defines a downtrend (short-only regime). Trades are always taken with the prevailing trend.
Test-bar qualification (the VSA footprint):
- Narrow spread gate: the test bar's high-to-low range must be smaller than
NarrowSpreadFactor × ATR, marking it as a quiet, compressed candle. - Volume contraction gate: the test bar's tick volume must undercut the minimum tick volume of the
VolBarsBackbars immediately before it — evidence that the opposing side has dried up.
Long entry — "No Supply" (the strategy signals a buy when):
- The EMA is rising and the confirm bar closes above the EMA.
- The test bar is a small down candle (close below its open) on contracted volume.
- The confirm bar closes back above the test bar's high — demand stepping back in.
Short entry — "No Demand" (the strategy signals a sell when):
- The EMA is falling and the confirm bar closes below the EMA.
- The test bar is a small up candle (close above its open) on contracted volume.
- The confirm bar closes back below the test bar's low — supply stepping back in.
Trade filters:
- Only one position per magic number is allowed at a time; the ATR bracket manages the exit.
- New entries are skipped when the current spread (in points) exceeds
MaxSpreadPoints, avoiding poor fills during illiquid conditions.
Stop-loss and take-profit logic (fully volatility-scaled):
- The stop-loss is placed
AtrStopMult × ATRaway from entry. - The take-profit is set at
RewardRiskRatiomultiples of that stop distance. - Because both are derived from ATR, the risk bracket automatically widens in volatile conditions and tightens in quiet ones. Every exit is handled by this bracket — there is no discretionary close.
Strategy Parameters
| Parameter | Default | Min | Max | Description |
|---|---|---|---|---|
| EmaPeriod | 34 | 10 | 120 | Length of the EMA trend baseline. Longer values track the broader trend; shorter values react faster. |
| TrendSlopeBars | 3 | 1 | 10 | How many bars back the EMA is compared to when confirming slope direction. |
| NarrowSpreadFactor | 0.7 | 0.2 | 1.5 | The narrow-spread gate: the test bar's high-low range must be below this multiple of ATR. |
| VolBarsBack | 2 | 1 | 6 | The test bar's tick volume must undercut the minimum volume of this many preceding bars. |
| AtrPeriod | 14 | 5 | 30 | ATR lookback used for both the spread gate and the risk bracket. |
| AtrStopMult | 1.5 | 0.5 | 4.0 | Stop-loss distance from entry, expressed in ATRs. |
| RewardRiskRatio | 1.8 | 1.0 | 5.0 | Take-profit distance as a reward-to-risk multiple of the stop. |
| MaxSpreadPoints | 60 | 5 | 300 | Skip new entries when the broker spread (in points) is wider than this. |
| Lots | 0.10 | 0.01 | 1.0 | Trade volume in lots. |
| Magic | 7731 | 0 | 9,999,999 | Unique identifier so the EA manages only its own positions. |
Recommended Chart Settings
The Volume Contraction Pullback Trend strategy was designed with liquid FX majors, metals (such as gold), and major indices in mind, on timeframes from M5 to H1. These instruments tend to produce cleaner tick-volume readings and trends of usable length, which suits the VSA logic. That said, the EA is not locked to a single timeframe — it reads bars from whatever timeframe the chart is set to, so you can test it across several.
Because tick volume is a broker-side proxy rather than true exchange volume, results can vary between brokers and across different market conditions. Treat the defaults as a reasonable starting point for study, not a fixed prescription, and re-evaluate the parameters whenever you change symbol or timeframe.
How to Install on MetaTrader 5
- Download the
.ex5file from the link below. - Copy it to your MT5
MQL5\Expertsfolder. - Restart MetaTrader 5 or refresh the Navigator panel.
- Drag the EA onto a chart matching the recommended symbol and timeframe.
- Configure the input parameters and enable Algo Trading.
What to Consider Before Using This EA
Every approach has trade-offs, and understanding them is part of learning to use any tool responsibly.
Strengths of this approach:
- The multi-condition logic (trend filter + narrow spread + volume contraction + confirmation) is selective, so it tends to avoid firing on random noise.
- Requiring the confirm bar to close back through the test bar filters out quiet bars that never resolve, reducing some false starts.
- Risk is volatility-scaled through ATR, so the stop and target adapt to changing market conditions rather than using fixed pip distances.
Known limitations:
- Tick volume is a proxy. MT5 reports the number of price changes per bar, not real traded volume. The "No Supply / No Demand" reading is therefore an approximation and may behave differently across brokers.
- Trend-following drawdowns. Like most continuation systems, it can suffer a string of losses in ranging or choppy markets where pullbacks fail and the trend does not resume.
- Whipsaws near the EMA. When price hovers around the moving average, the slope signal can flip frequently, producing marginal signals.
- Selectivity cuts both ways. Because all conditions must align, signals can be infrequent, and long quiet periods are normal.
This strategy may underperform during low-volatility consolidations, news-driven spikes, and sideways regimes. It is best understood as an educational study of VSA continuation logic — not a set-and-forget solution.
Risk Management Tips
Sound risk management matters far more than any single entry rule. Consider these general principles as you study the strategy:
- Risk a small, fixed fraction per trade. Many educational sources suggest risking no more than 1–2% of account equity on any single position. Size your
Lotsaccordingly, based on the ATR stop distance. - Test on a demo account first. Run the EA in a simulated environment across different symbols, timeframes, and market conditions before considering any live use.
- Understand drawdown. Even a well-built strategy will have losing streaks. Know the maximum loss you are prepared to tolerate and how it affects your account.
- Do not over-optimise. Tuning parameters until they fit past data perfectly ("curve-fitting") often produces results that historically looked strong but generalise poorly.
- Account for costs. Spread, commission, and slippage all affect real outcomes; the
MaxSpreadPointsfilter helps, but costs never disappear. - Keep position sizes consistent with your overall plan, and avoid increasing risk to recover losses.
Used thoughtfully, the Volume Contraction Pullback Trend EA can help you learn how volume, spread, and trend structure combine into a disciplined, rules-based framework — which is the real value of studying it.
Risk Warning
Trading foreign exchange, CFDs, and other leveraged financial instruments involves substantial risk of loss and is not suitable for all investors. The strategies and tools discussed on this page are provided for educational purposes only and do not constitute financial advice, investment recommendations, or solicitation to trade. Always consult a qualified financial adviser before making trading decisions. Past backtest performance is not indicative of future results.
Downloads
- Expert Advisor: VolumeContractionPullbackTrend.ex5 (38 downloads)
- Source Code: VolumeContractionPullbackTrend.mq5 (37 downloads)
- Documentation: VolumeContractionPullbackTrend.pdf (46 downloads)