Disclaimer: This article is for educational and informational purposes only. It does not constitute financial or investment advice. Trading forex and CFDs carries significant risk of loss. Past performance of any strategy — including backtests — does not guarantee future results. Never trade with money you cannot afford to lose.
What Is This Strategy?
Variance Asymmetry Momentum is a momentum trading strategy built around a custom-computed indicator called the Directional Variance Asymmetry index — a first-principles measure of directional "energy" rather than a repackaged version of a published indicator like RSI or MACD. Instead of counting whether there are more up bars than down bars, the strategy measures how much of the recent return energy leans to one side. Because energy scales with the square of price displacement, squaring each bar's return amplifies large with-trend impulses and mutes the small, noisy corrections that define chop. In plain terms, this indicator tries to separate a genuine directional push from random back-and-forth movement.
The strategy is designed for trending, intraday market conditions on liquid instruments. It is an automated Expert Advisor (EA) for MetaTrader 5, and it self-adapts: the raw asymmetry reading is standardised against its own recent history, so the trigger level shifts as a market's character changes rather than relying on a fixed number that only suits one symbol. This "z-score" approach (explained below) means the same logic can be applied across different symbols and timeframes without manual re-tuning.
As a learning tool, Variance Asymmetry Momentum is best suited to intermediate traders who already understand basic order execution and want to study how a statistical, self-adapting momentum filter behaves. This article is a strategy analysis — a walkthrough of the mechanics and trade-offs — not a profit opportunity. Treat it as a case study in how directional momentum can be quantified and gated with statistics.
How It Works
The strategy processes one closed bar at a time (it ignores the still-forming bar) and computes everything itself — no external indicator handles. Here is what happens on each new bar:
- Measure directional energy. Over the last
Lookbackclosed bars, the strategy takes one-step returns (the change from one close to the next) and splits their squared values by sign: upside energy (E_up) from positive returns and downside energy (E_dn) from negative returns. - Build the asymmetry index. It combines these into an index A = (E_up − E_dn) / (E_up + E_dn), bounded between −1 and +1. A reading near +1 means almost all recent return energy is upside (bullish pressure); near −1 means bearish; near 0 means balanced.
- Standardise into a z-score. A fixed threshold on A cannot fit every market, so A is converted into a z-score — how many standard deviations the current A sits from its own average over the last
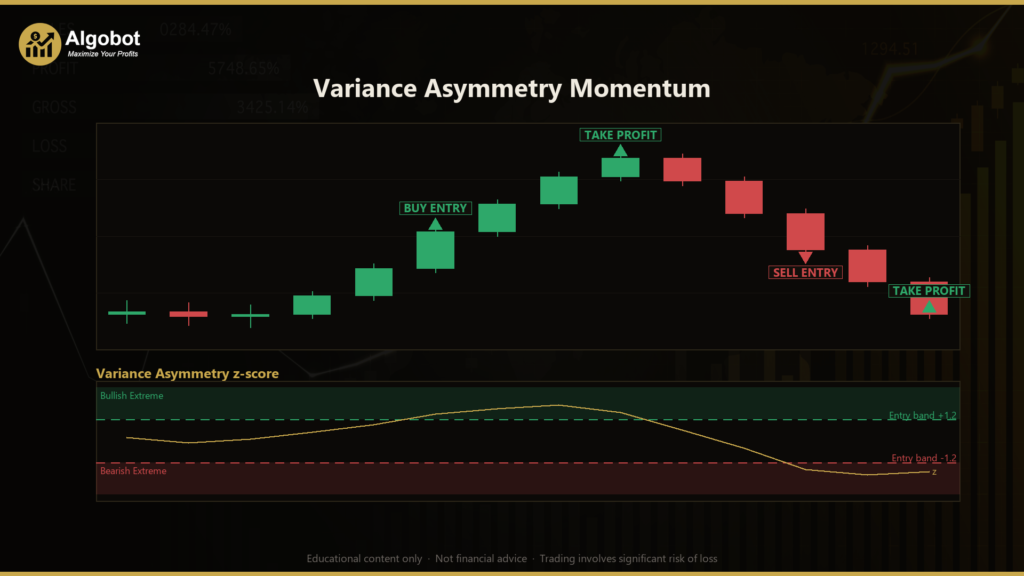
AdaptWindowreadings. This is the self-adapting core: as a symbol becomes more or less volatile in its imbalance, the effective trigger drifts with it. - Wait for a fresh crossing. The strategy signals a trade only when the z-score crosses the entry band — the previous reading was inside ±
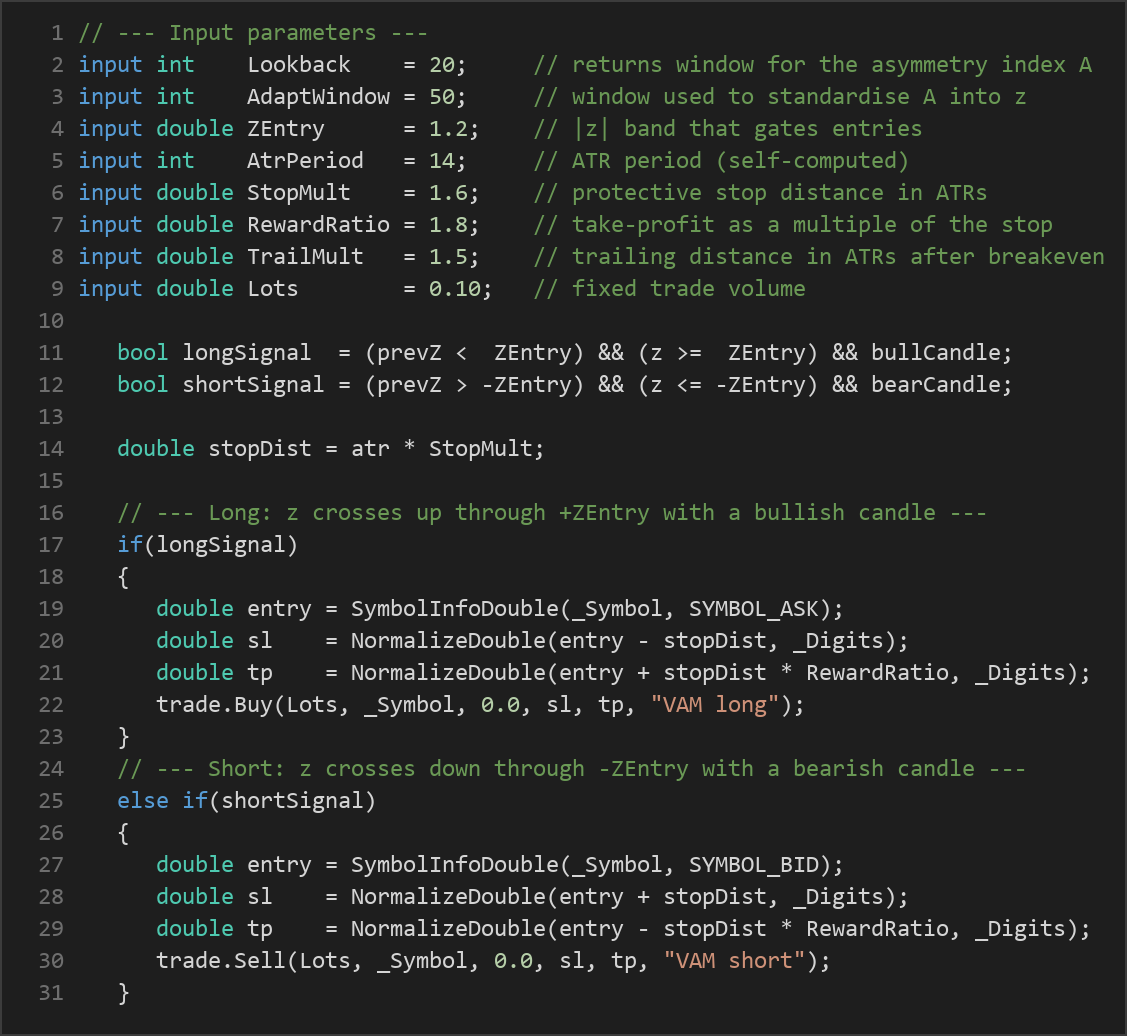
ZEntryand the new reading is outside it. This ensures each momentum impulse is taken once rather than repeatedly while the reading stays extreme. - Confirm with the candle. A long signal also requires the just-closed trigger bar to close above its open (a bullish candle); a short signal requires a bearish candle. The short side is an exact mirror of the long side.
For risk control, the strategy uses a self-computed ATR (Average True Range — a common measure of recent volatility, here a simple average of true ranges over AtrPeriod bars):
- Stop-loss: placed
StopMult× ATR away from entry. - Take-profit: set at the stop distance multiplied by
RewardRatio, giving a fixed reward-to-risk target. - Breakeven ratchet: once price moves +1 ATR in the trade's favour, the stop is moved to the entry price so the position is protected.
- Trailing stop: after breakeven, the stop trails behind price by
TrailMult× ATR, never dropping back below breakeven.
Only one position is held at a time. While a trade is open, the strategy stops looking for new entries and simply manages the existing position with the breakeven-and-trail logic above.
Strategy Parameters
| Parameter | Default | Min | Max | Description | ||
|---|---|---|---|---|---|---|
| Lookback | 20 | 5 | 60 | Number of recent closed-bar returns used to compute the directional variance asymmetry index A. | ||
| AdaptWindow | 50 | 10 | 200 | Window of past A readings used to standardise A into a z-score (the self-adapting reference distribution). | ||
| ZEntry | 1.2 | 0.3 | 3.0 | The \ | z\ | band that gates entries; a trade signals when z freshly crosses this level. Higher = more selective. |
| AtrPeriod | 14 | 5 | 50 | Number of bars used for the self-computed ATR that sizes stops and targets. | ||
| StopMult | 1.6 | 0.5 | 4.0 | Protective stop distance, expressed as a multiple of ATR. | ||
| RewardRatio | 1.8 | 0.5 | 5.0 | Take-profit distance as a multiple of the stop distance (reward-to-risk ratio). | ||
| TrailMult | 1.5 | 0.5 | 4.0 | Trailing-stop distance in ATRs, applied after the trade reaches breakeven. | ||
| Lots | 0.10 | 0.01 | 1.0 | Fixed trade volume in lots. |
Recommended Chart Settings
Variance Asymmetry Momentum was designed with a liquid FX major such as EUR/USD, or a major stock index, on an intraday timeframe in mind. Because the logic reads only the primary symbol and primary timeframe of the chart it is attached to — nothing is hardcoded — you can experiment across instruments and timeframes, and the z-score standardisation will attempt to adapt to each.
That flexibility does not mean the strategy behaves identically everywhere. Spreads, session liquidity, and volatility differ from symbol to symbol, and results will vary considerably across different market conditions. Always test any chosen symbol and timeframe combination on historical data and on a demo account before drawing conclusions.
How to Install on MetaTrader 5
- Download the .ex5 file from the link below
- Copy it to your MT5
MQL5\Expertsfolder - Restart MetaTrader 5 or refresh the Navigator panel
- Drag the EA onto a chart matching the recommended symbol and timeframe
- Configure the input parameters and enable Algo Trading
What to Consider Before Using This EA
Every strategy has strengths and weaknesses, and an honest assessment matters more than a sales pitch.
Strengths of this approach:
- Statistical adaptivity. Standardising the asymmetry index against its own recent distribution means the trigger level is not a fixed magic number; it shifts as a market's behaviour changes, which can reduce the need for constant manual re-tuning.
- Energy-based signal. Squaring returns emphasises decisive moves over jitter, which may indicate genuine directional pressure more cleanly than a simple net-drift measure.
- Defined, structured risk. Fixed ATR-based stops, a reward-ratio target, a breakeven ratchet, and a trailing stop give the strategy a clear, mechanical exit framework.
Known limitations:
- Momentum strategies struggle in ranges. Like all momentum systems, this one is built for trends. In quiet, mean-reverting, or choppy conditions, fresh-cross signals can repeatedly trigger and then reverse, producing a string of small losses.
- Whipsaws around the band. When the z-score hovers near ±
ZEntry, the fresh-cross rule may fire on marginal moves that lack follow-through, especially on noisy timeframes. - Lag from adaptation. The
AdaptWindowstandardisation needs a full history of readings before it can trade, and its reference distribution reacts to change with a delay. Sudden regime shifts may not be reflected immediately. - Fixed position size. The default uses a constant lot size rather than volatility-scaled sizing, so risk in account-currency terms varies with the ATR-based stop distance.
The strategy may underperform during low-volatility drift, major news spikes, and illiquid sessions where spreads widen. Understanding when a momentum tool is likely to struggle is as important as understanding when it may perform.
Risk Management Tips
Sound risk management is what separates disciplined study from gambling. Consider these general principles:
- Risk a small fraction per trade. A common guideline is to risk no more than 1–2% of account equity on any single position. Size your lots so that the ATR-based stop distance corresponds to that fraction, rather than accepting the default blindly.
- Test on a demo account first. Run the EA on a demo or paper account across varied market conditions before considering any live use. This lets you observe behaviour without financial exposure.
- Understand drawdown. Even a well-designed strategy will experience losing streaks. Study the maximum peak-to-trough decline in your testing so you know what a normal rough patch looks like, and confirm you could tolerate it emotionally and financially.
- Account for costs. Spreads, commissions, and slippage can meaningfully affect a frequently-trading intraday system. Include realistic costs in any evaluation.
- Never over-leverage. Leverage magnifies losses as much as gains. Keep total exposure conservative and avoid running multiple correlated instruments at full size simultaneously.
Risk management is not an afterthought — it is the core discipline that determines whether a strategy is survivable over the long run.
Risk Warning
Trading foreign exchange, CFDs, and other leveraged financial instruments involves substantial risk of loss and is not suitable for all investors. The strategies and tools discussed on this page are provided for educational purposes only and do not constitute financial advice, investment recommendations, or solicitation to trade. Always consult a qualified financial adviser before making trading decisions. Past backtest performance is not indicative of future results.
Downloads
- Expert Advisor: VarianceAsymmetryMomentum.ex5 (60 downloads)
- Source Code: VarianceAsymmetryMomentum.mq5 (71 downloads)
- Documentation: VarianceAsymmetryMomentum.pdf (61 downloads)