Disclaimer: This article is for educational and informational purposes only. It does not constitute financial or investment advice. Trading forex and CFDs carries significant risk of loss. Past performance of any strategy — including backtests — does not guarantee future results. Never trade with money you cannot afford to lose.
What Is This Strategy?
The Stochastic Rsi Trend Pullback strategy is a trend-following, pullback-entry system built around the Stochastic RSI oscillator — a momentum indicator that measures where the classic Relative Strength Index (RSI) sits within its own recent high-to-low range. In plain terms, it is a "buy the dip, sell the rally" approach that only acts in the direction of an established trend. Rather than chasing breakouts, it waits for price to pause and pull back, then times an entry when momentum turns back in the trend's favour.
The strategy combines three well-known technical tools into a single decision. An Exponential Moving Average (EMA) — a moving average that weights recent prices more heavily — defines the trend regime and decides which side of the market you are allowed to trade. The Stochastic RSI provides the entry timing by identifying when a pullback has exhausted itself. Finally, the Average True Range (ATR) — a measure of typical price movement, or volatility — sizes the stop-loss and take-profit so that the trade's risk scales with current market conditions.
This makes the Stochastic Rsi Trend Pullback a useful learning tool for traders who want to study how a trend filter and an oscillator can work together as a confluence system. It is designed for trending markets and is best understood as a framework for exploring entry timing, not as a shortcut to any particular outcome. Beginners can use it to see how each component contributes to a signal, while more experienced traders may use it as a template for parameter research and backtesting.
How It Works
The strategy evaluates its rules once per completed bar, meaning it acts only on closed candles rather than reacting to every tick. Here is how the logic flows:
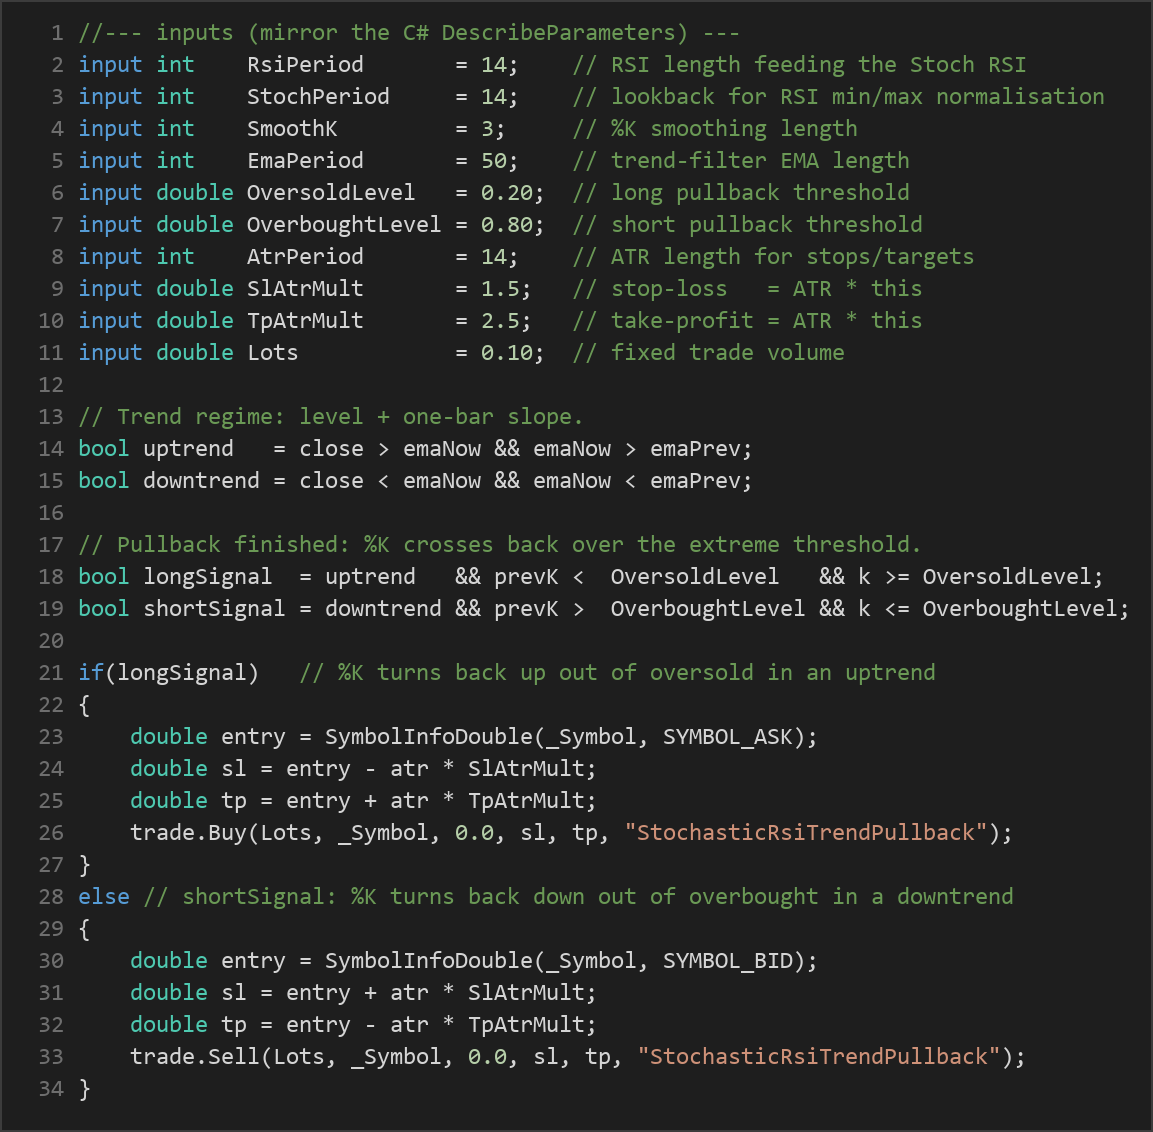
- Trend filter (the regime gate). The strategy calculates an EMA of closing prices. A long setup is only permitted when price closes above a rising EMA. A short setup is only permitted when price closes below a falling EMA. This one-bar slope check keeps the system aligned with momentum and blocks counter-trend trades.
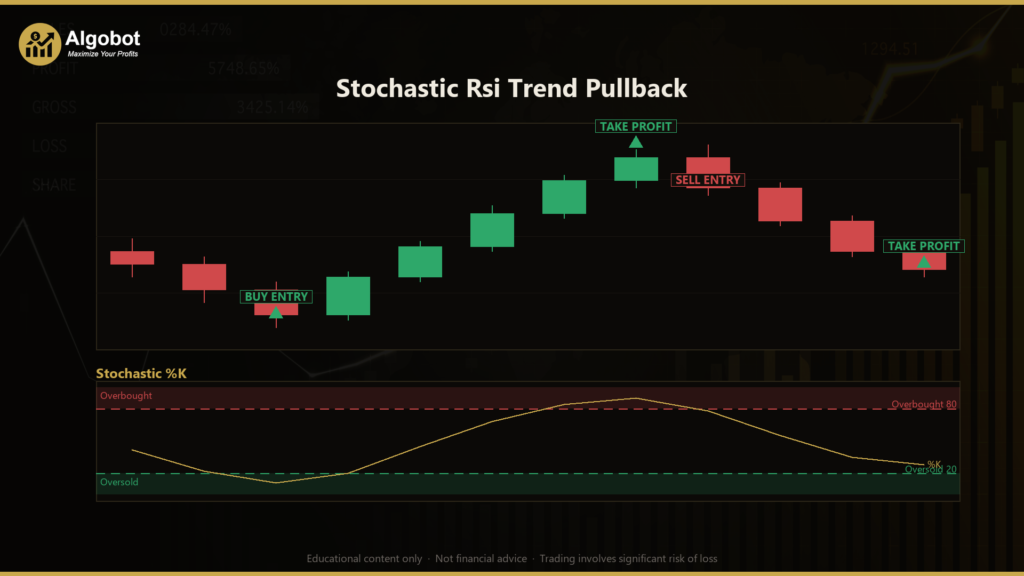
- Pullback detection (the oscillator). The Stochastic RSI %K line is calculated by taking the RSI, normalising it to its recent minimum/maximum range to get a 0–1 value, and then smoothing that value into a %K line. When %K falls into the oversold zone during an uptrend, the strategy waits — it does not enter yet.
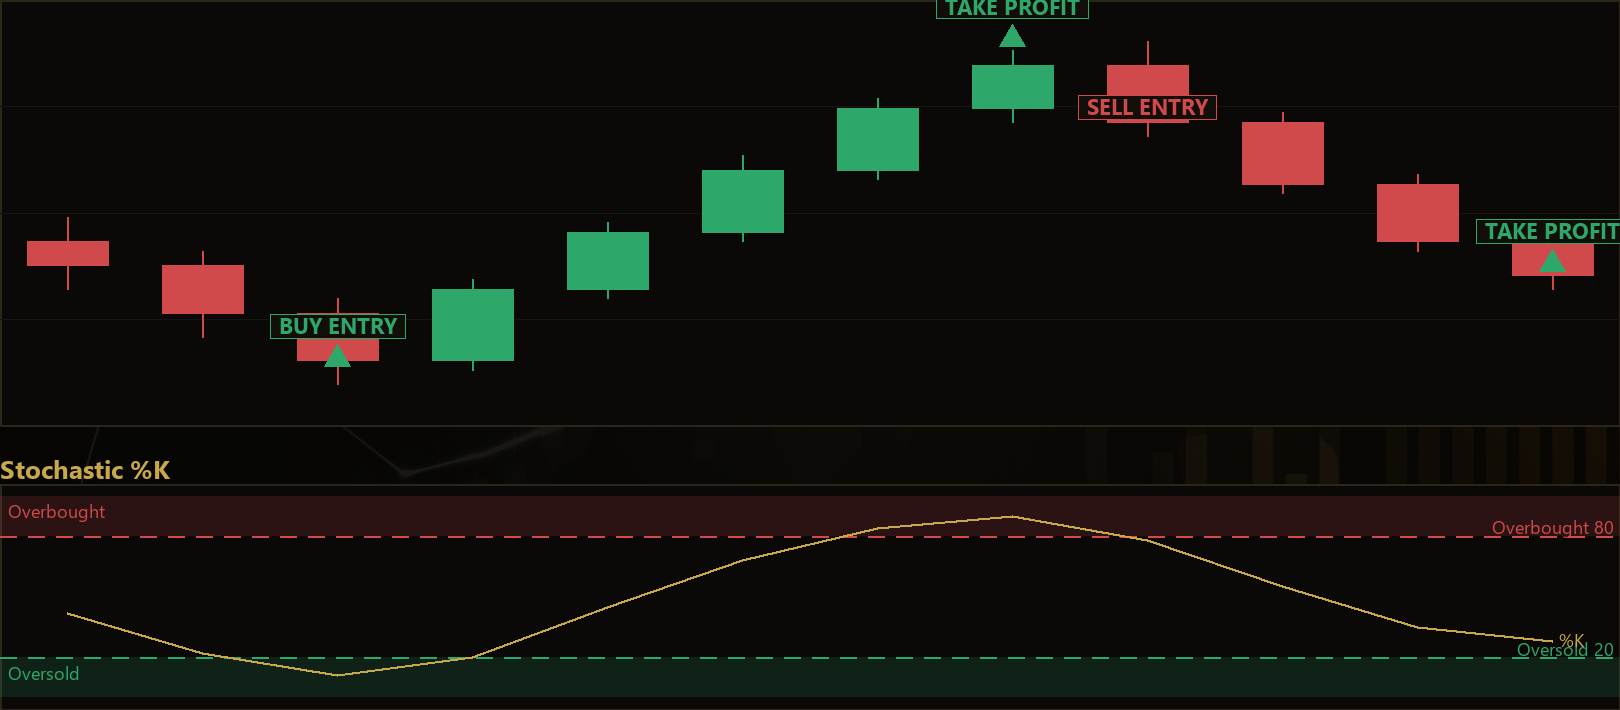
- Entry trigger (the reversal). A long signal fires only when %K was previously below the oversold level and then crosses back up through it — signalling the dip is finishing. A short signal fires only when %K was previously above the overbought level and then crosses back down through it. Requiring the oscillator to first reach an extreme and then reverse filters out shallow, low-conviction noise.
- One trade at a time. The strategy allows only a single open position per magic number. If a trade is already open, no new entry is taken until it closes.
- Stop-loss logic. When a trade opens, the stop-loss is placed at a distance of ATR × the stop multiplier away from entry. Because ATR expands in volatile markets and contracts in calm ones, the stop automatically widens or tightens with conditions.
- Take-profit logic. The take-profit is placed at a distance of ATR × the target multiplier. With the default settings, the target is set wider than the stop, giving the system a reward-to-risk ratio greater than 1:1 on each trade.
Because entries require both the trend and the oscillator to agree, the strategy signals far less frequently than a simple oscillator system — the trade-off is fewer but potentially higher-conviction setups.
Strategy Parameters
| Parameter | Default | Min | Max | Description |
|---|---|---|---|---|
| RsiPeriod | 14 | 5 | 30 | Number of bars used to calculate the underlying RSI that feeds the Stochastic RSI. |
| StochPeriod | 14 | 5 | 40 | Lookback window for normalising the RSI to its recent min/max range. |
| SmoothK | 3 | 1 | 8 | Smoothing length applied to the raw Stochastic RSI to produce the %K line. |
| EmaPeriod | 50 | 20 | 200 | Length of the trend-filter EMA that defines the market regime. |
| OversoldLevel | 0.20 | 0.05 | 0.40 | Threshold %K must cross back above to trigger a long pullback entry. |
| OverboughtLevel | 0.80 | 0.60 | 0.95 | Threshold %K must cross back below to trigger a short pullback entry. |
| AtrPeriod | 14 | 5 | 30 | Number of bars used to calculate ATR for stop and target sizing. |
| SlAtrMult | 1.5 | 0.5 | 4.0 | Stop-loss distance as a multiple of ATR. |
| TpAtrMult | 2.5 | 0.5 | 6.0 | Take-profit distance as a multiple of ATR. |
| Lots | 0.10 | 0.01 | 1.0 | Fixed trade volume in lots for each position. |
Recommended Chart Settings
This strategy operates on a single timeframe — every calculation uses the chart's primary timeframe, so the EA should be attached to one chart and left to run on that timeframe. Trend-and-pullback systems like this one are generally studied on the higher intraday timeframes, such as the 1-hour (H1) or 4-hour (H4) charts, where the EMA trend filter is less prone to whipsaw than on very short timeframes.
The logic is symbol-agnostic and can be applied to major forex pairs, indices, or other instruments that tend to produce sustained trends. As a starting point for study, a liquid major pair such as EUR/USD on H1 is a reasonable environment. Keep in mind that behaviour will vary considerably across different symbols, sessions, and market conditions — a setting that suits one instrument may perform very differently on another. Always test on your chosen symbol and timeframe before drawing conclusions.
How to Install on MetaTrader 5
- Download the .ex5 file from the link below
- Copy it to your MT5
MQL5\Expertsfolder - Restart MetaTrader 5 or refresh the Navigator panel
- Drag the EA onto a chart matching the recommended symbol and timeframe
- Configure the input parameters and enable Algo Trading
What to Consider Before Using This EA
Every strategy has strengths and weaknesses, and understanding both is part of trading education.
Strengths of this approach:
- Confluence logic. By requiring a trend agreement and an oscillator reversal, the strategy avoids many of the false signals that plague single-indicator systems.
- Volatility-aware risk. ATR-based stops and targets mean the trade math adapts to the market rather than using fixed pip distances that ignore volatility.
- Discretion-free rules. Every condition is mechanical and objective, which makes the system easy to backtest and study.
Known limitations:
- Range-bound markets. The EMA trend filter needs a genuine trend to function. In sideways, choppy conditions the slope flips frequently, which can produce a run of losing trades as pullbacks fail to develop into continuations.
- Lagging entries. Waiting for the oscillator to reverse back across a threshold means the entry is confirmed but later — some of the initial move may already be gone.
- Single position, fixed lots. The default configuration trades one position at a time with a fixed lot size and does not scale to account equity, so position sizing must be managed manually.
- Parameter sensitivity. Oscillator thresholds and the EMA length interact; a change to one may require re-tuning the others. This is why forward-testing on a demo account matters.
The strategy is best viewed as a structured framework for studying trend-pullback confluence — not as a finished, hands-off solution.
Risk Management Tips
Sound risk management is what separates disciplined study from gambling. Whatever strategy you explore, keep these general principles in mind:
- Risk a small, fixed fraction per trade. Many educators suggest risking no more than 1–2% of account equity on any single position, so that a losing streak does not do lasting damage.
- Size positions to your stop. Because this EA uses a fixed lot size, calculate what that lot actually risks given the ATR-based stop distance on your symbol, and adjust the
Lotsinput to match your risk tolerance. - Start on a demo account. Run the strategy in a risk-free simulated environment first to understand its behaviour, trade frequency, and drawdown before considering any live capital.
- Understand drawdown. Even a well-designed trend system will experience losing streaks. Knowing the historical depth and duration of drawdowns helps you set realistic expectations and stay disciplined.
- Keep records and review. Journaling each trade and periodically reviewing performance is one of the most effective ways to learn from a mechanical system.
Risk Warning
Trading foreign exchange, CFDs, and other leveraged financial instruments involves substantial risk of loss and is not suitable for all investors. The strategies and tools discussed on this page are provided for educational purposes only and do not constitute financial advice, investment recommendations, or solicitation to trade. Always consult a qualified financial adviser before making trading decisions. Past backtest performance is not indicative of future results.
Downloads
- Expert Advisor: StochasticRsiTrendPullback.ex5 (78 downloads)
- Source Code: StochasticRsiTrendPullback.mq5 (61 downloads)
- Documentation: StochasticRsiTrendPullback.pdf (63 downloads)