
Disclaimer: This article is for educational and informational purposes only. It does not constitute financial or investment advice. Trading forex and CFDs carries significant risk of loss. Past performance of any strategy — including backtests — does not guarantee future results. Never trade with money you cannot afford to lose.
What Is This Strategy?
The Standard Error Band Trend strategy is a trend-following pullback system built around Standard Error Bands, an indicator introduced by Jon Andersen in Stocks & Commodities magazine in 1996. At its core sits a least-squares linear regression line — a straight line mathematically fitted through the most recent closing prices — surrounded by bands whose width is set by the standard error of estimate (SEE). If you have used Bollinger Bands before, it is important to understand that these bands are fundamentally different. Bollinger Bands measure the standard deviation of price around a moving average; Standard Error Bands measure how tightly price actually fits a straight-line trend.
That distinction is the whole idea. The standard error of estimate is the root-mean-square of the residuals — the leftover gaps between each close and the regression line. When a market trends cleanly, those residuals are tiny and the bands pinch inward. When price chops sideways or turns noisy, the residuals grow and the bands flare outward. By comparing SEE against the Average True Range (ATR) — a common measure of volatility — the strategy builds a genuine goodness-of-fit regime gate. In plain terms, it only looks for trades when price is behaving like a real, orderly trend rather than random noise.
This strategy is best suited to traders who want to study how a statistically grounded trend filter can be combined with a disciplined pullback entry. It is designed for trending market conditions, where price marches in a fairly straight line and periodically dips back toward the trend before continuing. As a learning tool, it is a strong example of using regression mathematics and volatility normalization together, rather than relying on a single crossover. It is not a shortcut of any kind — treat it as a framework for understanding trend quality and mean-reverting entries within a trend.
How It Works
The strategy evaluates each newly closed bar on a single timeframe and fits a fresh regression line every time. Here is how it reaches a decision, step by step:
- Fit the trend line. A least-squares regression line is calculated across the last
RegPeriodclosing prices. This produces a slope (the direction and steepness of the trend) and an endpoint (the line's value at the most recent bar). - Measure trend cleanliness. The strategy computes the standard error of estimate (SEE) — the RMS of the residuals around that line — then divides it by ATR. This
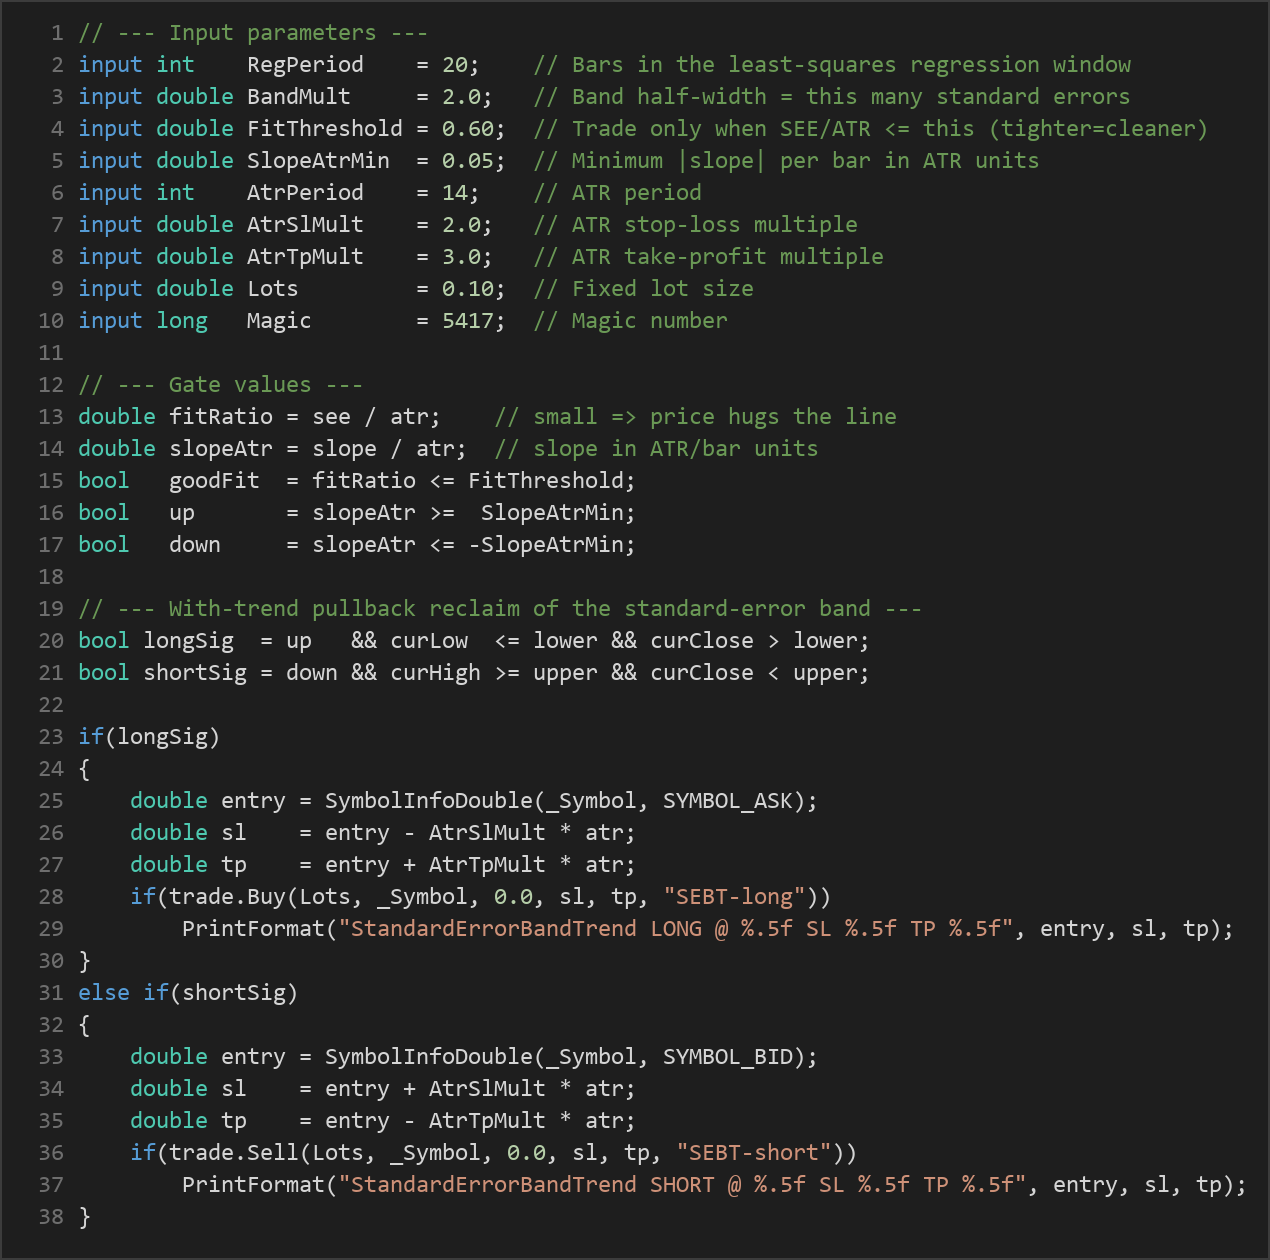
SEE / ATRratio is the trend-quality gate. A small ratio means price is hugging the regression line closely (a clean, low-noise trend); a large ratio means the fit is loose and unreliable. - Confirm direction. The regression slope is normalized by ATR so it becomes symbol-independent and volatility-independent. The strategy signals an uptrend when the ATR-normalized slope is positive enough, and a downtrend when it is negative enough, based on the
SlopeAtrMinthreshold. - Build the error bands. An upper band and lower band are placed at
BandMultstandard errors above and below the regression endpoint.
Once the regime is judged "tight" and directional, the strategy waits for a with-trend pullback and reclaim:
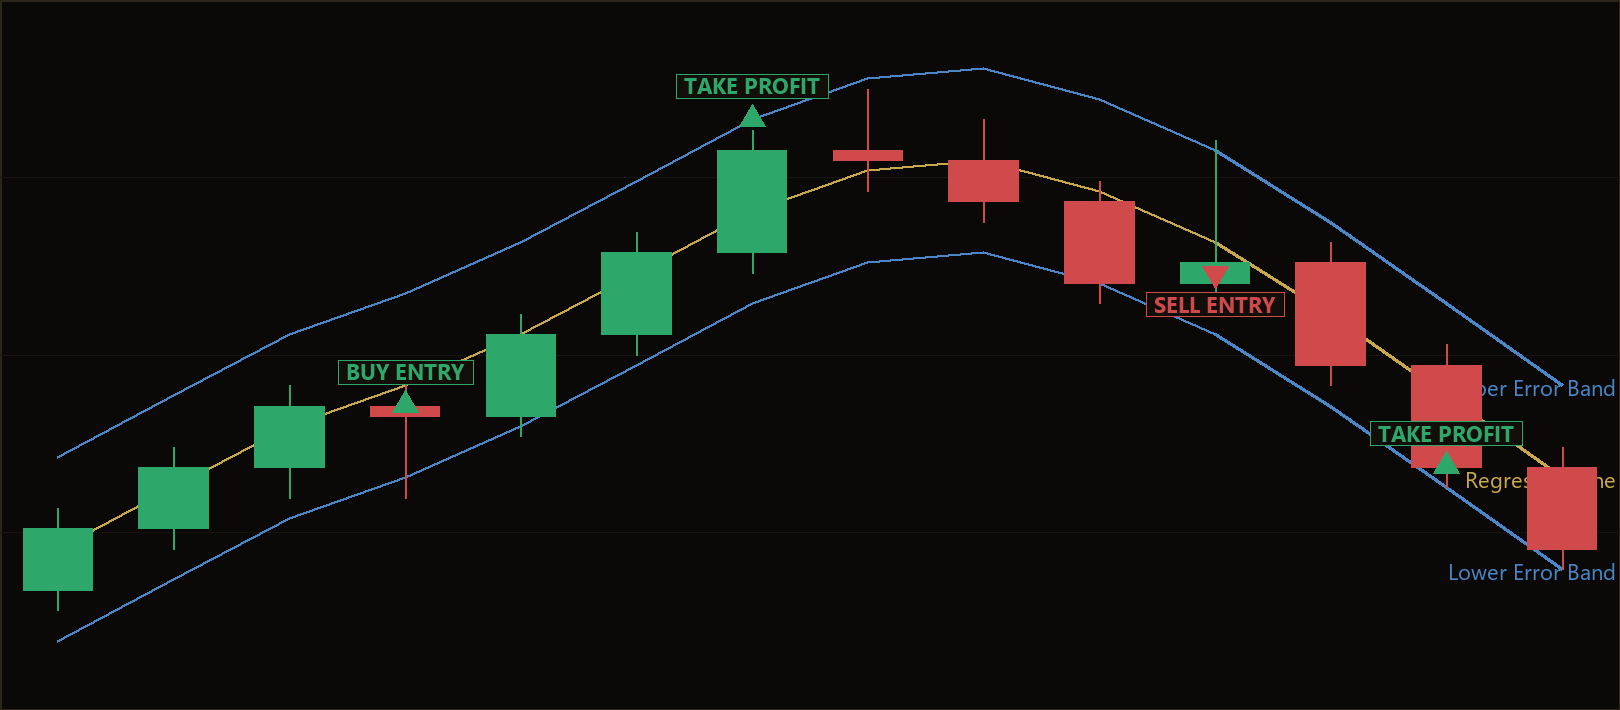
- The strategy signals a long when the trend is up, the fit is tight, and the just-closed bar dipped to or below the lower band yet closed back above it — a buy-the-dip reclaim inside a clean uptrend.
- The strategy signals a short when the trend is down, the fit is tight, and the just-closed bar poked to or above the upper band yet closed back below it — a sell-the-rally reclaim inside a clean downtrend.
Exits are handled three ways:
- Stop-loss: placed at
AtrSlMult× ATR away from the entry price, so the risk distance scales automatically with current volatility. - Take-profit: placed at
AtrTpMult× ATR away from entry, giving a volatility-scaled reward target. - Active regime exit: if the regression slope later flips against an open position, the trend that justified the trade is considered gone, and the strategy closes the position early rather than waiting for the stop or target.
Only one position is held at a time, keeping the logic clean and the exposure controlled.
Strategy Parameters
| Parameter | Default | Min | Max | Description |
|---|---|---|---|---|
| RegPeriod | 20 | 10 | 60 | Number of bars in the least-squares regression window. Larger values smooth the trend line and react more slowly. |
| BandMult | 2.0 | 1.0 | 3.0 | Band half-width expressed as this many standard errors of estimate above and below the regression line. |
| FitThreshold | 0.60 | 0.20 | 1.50 | Trend-quality gate: the strategy trades only when SEE / ATR is at or below this value. Lower means a stricter, cleaner-trend requirement. |
| SlopeAtrMin | 0.05 | 0.00 | 0.50 | Minimum absolute slope per bar (in ATR units) required to call a direction. Higher values demand a steeper trend. |
| AtrPeriod | 14 | 5 | 30 | Number of bars used to calculate the Average True Range for volatility measurement. |
| AtrSlMult | 2.0 | 0.5 | 5.0 | Stop-loss distance as a multiple of ATR. |
| AtrTpMult | 3.0 | 0.5 | 8.0 | Take-profit distance as a multiple of ATR. |
| Lots | 0.10 | 0.01 | 1.0 | Fixed trade size in lots. |
Recommended Chart Settings
This strategy runs on a single timeframe — every calculation uses the chart's own symbol and period, so it adapts to whatever timeframe you attach it to. A common starting point for studying trend-pullback systems is a major forex pair such as EUR/USD on the H1 (1-hour) or H4 (4-hour) timeframe, where clean directional moves and orderly pullbacks are reasonably frequent and spreads are typically tight.
Because the trend-quality gate depends on how well price fits a straight line, the strategy naturally behaves differently across instruments and timeframes. Faster timeframes produce more signals but noisier fits; slower timeframes produce fewer, potentially cleaner signals. Always test on your own broker's data, and remember that results will vary across different market conditions and instruments. There is no single "correct" setting — the defaults are a reasonable baseline for exploration, not a recommendation.
How to Install on MetaTrader 5
- Download the
.ex5file from the link below. - Copy it to your MT5
MQL5\Expertsfolder. - Restart MetaTrader 5 or refresh the Navigator panel.
- Drag the EA onto a chart matching the recommended symbol and timeframe.
- Configure the input parameters and enable Algo Trading.
What to Consider Before Using This EA
The main strength of the Standard Error Band Trend approach is its statistically honest trend filter. Rather than assuming a trend exists because two moving averages crossed, it directly measures how well price fits a straight line and refuses to trade when that fit is poor. Combined with ATR normalization, this makes the logic reasonably portable across symbols and volatility regimes, and the "reclaim" entry helps avoid buying into a falling knife by requiring price to close back on the correct side of the band.
There are real limitations to keep in mind, however. Like all trend-following systems, this strategy may underperform in choppy, range-bound, or reversal-heavy markets — precisely the conditions where the fit gate should keep it flat, but at the cost of long quiet periods with few or no trades. During sharp regime changes, the regression line lags reality, and a "tight fit" can appear right before a trend exhausts. The fixed lot size means position size does not adapt to account equity, and the single-position rule limits how the strategy participates in strong multi-leg moves.
Because the entry depends on a pullback and a same-bar reclaim, some good trends will run away without ever offering the setup, and some reclaims will fail immediately. Historically, trend-pullback logic tends to cluster its results — several profitable trends can be interrupted by a string of small losses when the market stops trending. None of this is a flaw to be "fixed"; it is the nature of the approach, and understanding it is part of using the tool responsibly.
Risk Management Tips
Sound risk management matters more than any single parameter setting. Consider these general principles as you study this strategy:
- Risk a small, fixed fraction per trade. A widely taught guideline is to risk no more than 1–2% of account equity on any single position. The default fixed lot size does not do this for you — you may need to size positions manually to respect that limit.
- Understand your stop distance. Here the stop is
AtrSlMult× ATR, so it widens in volatile conditions. Make sure the resulting monetary risk still fits your per-trade limit before trading. - Test on a demo account first. Run the EA on a demo or simulation for an extended period across different market conditions before ever considering real capital.
- Expect and plan for drawdown. Every strategy experiences losing streaks. Know the maximum drawdown you can tolerate emotionally and financially, and stop if it is exceeded.
- Avoid over-optimization. Tuning parameters until a backtest looks perfect ("curve fitting") often produces settings that fail on new data. Prefer robust settings that work reasonably across a range of conditions.
Risk Warning
Trading foreign exchange, CFDs, and other leveraged financial instruments involves substantial risk of loss and is not suitable for all investors. The strategies and tools discussed on this page are provided for educational purposes only and do not constitute financial advice, investment recommendations, or solicitation to trade. Always consult a qualified financial adviser before making trading decisions. Past backtest performance is not indicative of future results.
Downloads
- Expert Advisor: StandardErrorBandTrend.ex5 (49 downloads)
- Source Code: StandardErrorBandTrend.mq5 (49 downloads)
- Documentation: StandardErrorBandTrend.pdf (61 downloads)