Disclaimer: This article is for educational and informational purposes only. It does not constitute financial or investment advice. Trading forex and CFDs carries significant risk of loss. Past performance of any strategy — including backtests — does not guarantee future results. Never trade with money you cannot afford to lose.
What Is This Strategy?
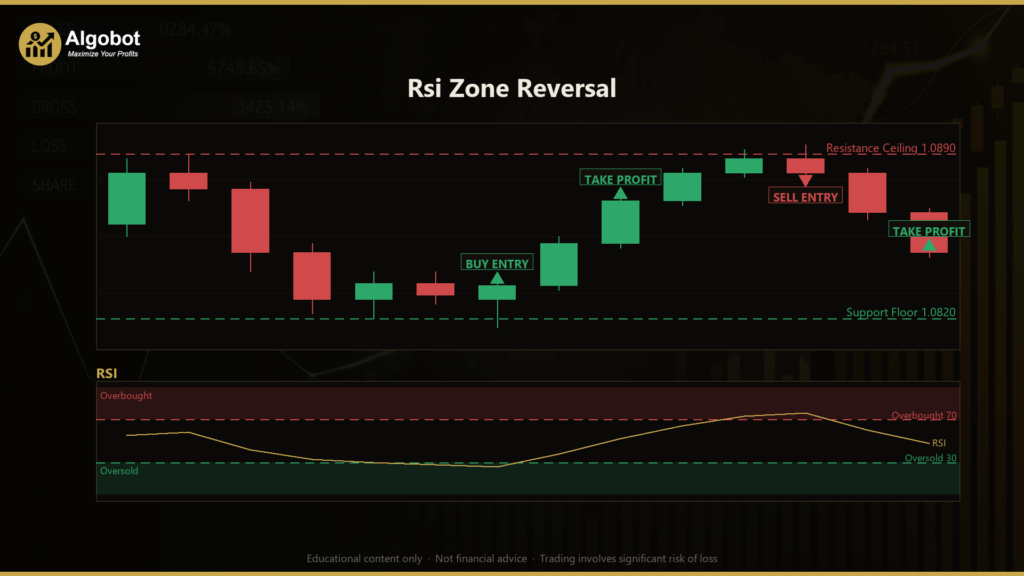
Rsi Zone Reversal is a mean-reversion trading strategy that combines the Relative Strength Index (RSI) — a momentum oscillator that measures the speed and magnitude of recent price changes on a 0–100 scale — with classic support and resistance zones. Rather than chasing breakouts, this approach is built to fade price probes into structural extremes: it looks for moments when price stretches into a recent high or low, momentum signals exhaustion, and the candle rejects the level by closing back inside the range.
The strategy is designed for ranging or range-bound market conditions, where price tends to oscillate between a relatively stable floor (support) and ceiling (resistance) rather than trending strongly in one direction. In these environments, probes beyond the established range often pull back, and Rsi Zone Reversal attempts to identify those pullbacks systematically. It operates on a single timeframe and acts once per closed bar, so it avoids reacting to incomplete price action.
As a learning tool, this strategy is well suited to traders who want to study how momentum confirmation can be layered on top of price-structure analysis. It demonstrates a disciplined, rules-based framework: two independent conditions (a structural zone and an RSI extreme) must align and the candle must confirm rejection before any order is considered. This makes it a useful case study in building filtered, multi-condition entries rather than relying on a single indicator in isolation.
How It Works
The strategy evaluates the market on each newly closed bar. It uses the bar that has just finished forming as the "signal bar" and builds its support and resistance levels from the window of bars before that signal bar, so the signal candle's own probe does not define its own level.
Building the zones:
- The strategy scans the most recent
ZoneLookbackbars (excluding the signal bar) to find the highest high and the lowest low. - The highest high becomes the resistance ceiling; the lowest low becomes the support floor.
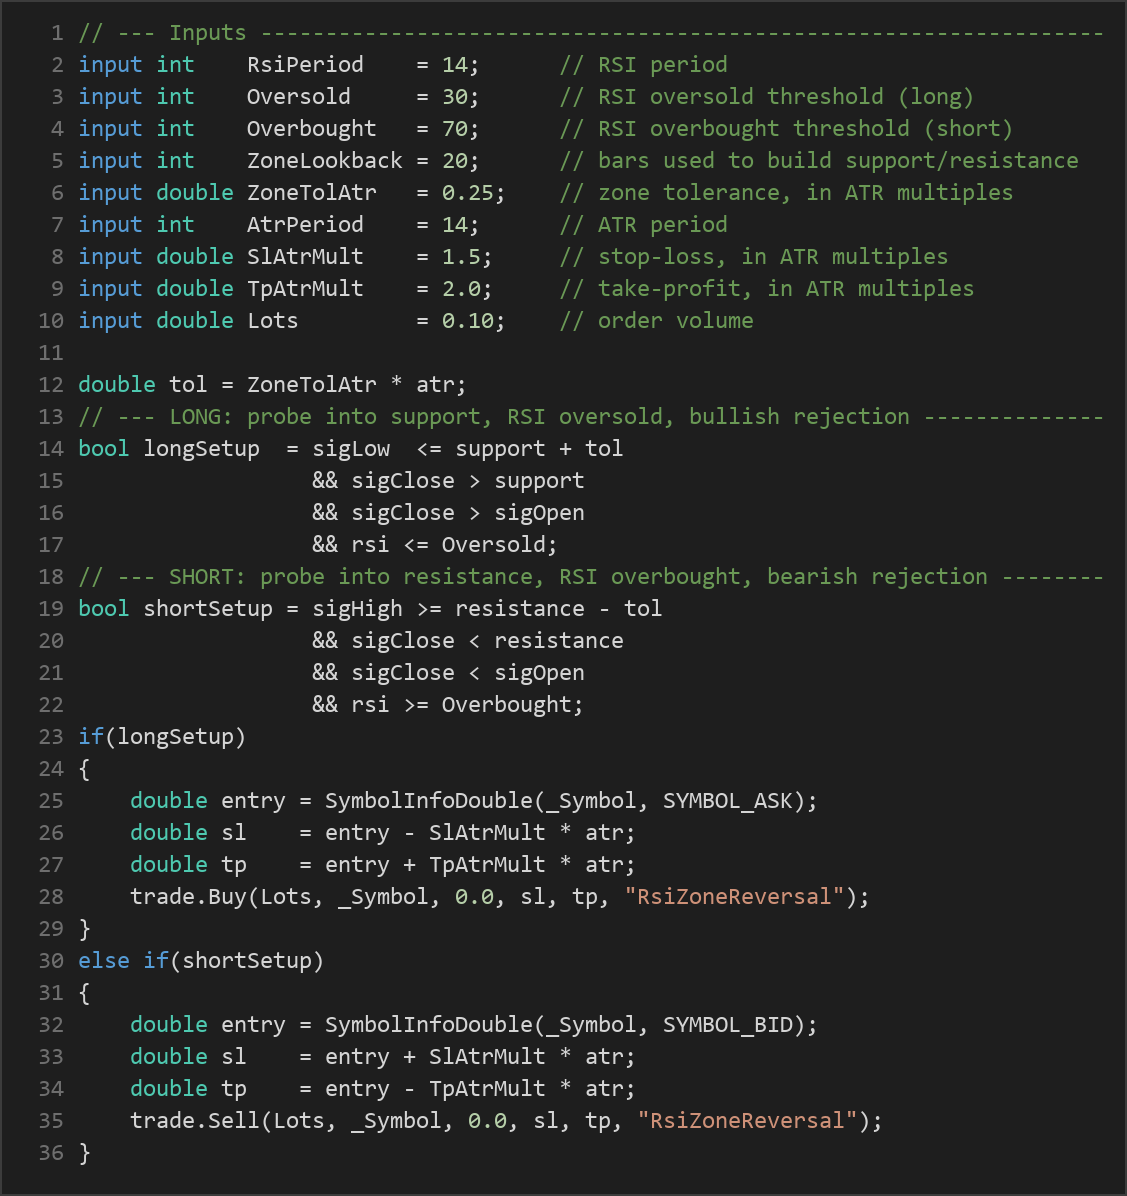
- A tolerance band, sized as a multiple of the Average True Range (ATR) — a volatility measure of the typical bar range — is added around each zone via the
ZoneTolAtrparameter. This lets the strategy treat a near-touch as a valid probe.
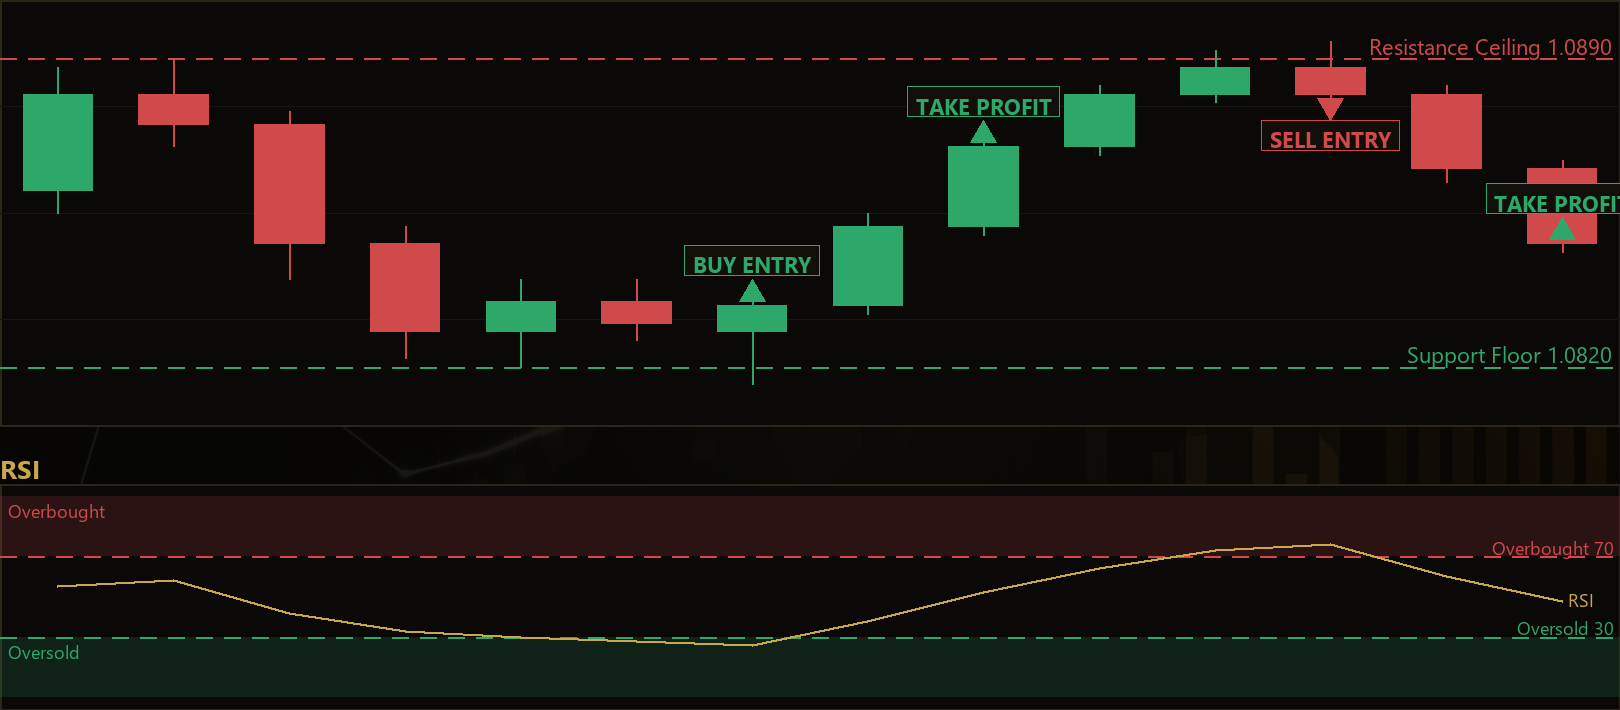
Long (buy) entry — the strategy signals a long when all of the following align:
- The signal bar's low dipped into the support zone (low at or below support plus the ATR tolerance).
- The signal bar closed back above the support floor — a rejection of lower prices.
- The signal bar is bullish (close above its open).
- RSI is at or below the
Oversoldthreshold, indicating momentum exhaustion to the downside.
Short (sell) entry — the strategy signals a short when all of the following align:
- The signal bar's high pushed into the resistance zone (high at or above resistance minus the ATR tolerance).
- The signal bar closed back below the resistance ceiling — a rejection of higher prices.
- The signal bar is bearish (close below its open).
- RSI is at or above the
Overboughtthreshold, indicating momentum exhaustion to the upside.
Stop-loss and take-profit logic:
- For a long, the stop-loss is placed
SlAtrMult× ATR below the entry, and the take-profit isTpAtrMult× ATR above it. - For a short, the stop-loss is placed
SlAtrMult× ATR above the entry, and the take-profit isTpAtrMult× ATR below it. - Because both levels scale with ATR, the strategy adapts its risk distances to current volatility — wider stops in volatile conditions, tighter ones in calm markets.
Position management:
- The strategy allows only one open position per magic number at a time. It will not stack additional trades until the current position has closed via its stop-loss or take-profit.
Strategy Parameters
| Parameter | Default | Min | Max | Description |
|---|---|---|---|---|
| RsiPeriod | 14 | 5 | 30 | Number of bars used to calculate the RSI momentum oscillator. |
| Oversold | 30 | 15 | 40 | RSI level at or below which the strategy considers downside momentum exhausted (long filter). |
| Overbought | 70 | 60 | 85 | RSI level at or above which the strategy considers upside momentum exhausted (short filter). |
| ZoneLookback | 20 | 8 | 60 | Number of bars used to build the support and resistance zones. |
| ZoneTolAtr | 0.25 | 0.05 | 1.0 | Tolerance band around each zone, expressed as a multiple of ATR. |
| AtrPeriod | 14 | 5 | 30 | Number of bars used to calculate ATR (volatility for tolerance, stop, and target). |
| SlAtrMult | 1.5 | 0.5 | 4.0 | Stop-loss distance from entry, as a multiple of ATR. |
| TpAtrMult | 2.0 | 0.5 | 6.0 | Take-profit distance from entry, as a multiple of ATR. |
| Lots | 0.10 | 0.01 | 1.0 | Order volume (position size) in lots. |
Recommended Chart Settings
Rsi Zone Reversal runs on whatever single timeframe you attach it to, which gives you flexibility to study its behavior across different horizons. As a starting point for analysis, many mean-reversion approaches are studied on intraday timeframes such as the M15, M30, or H1 charts, where ranging conditions are common between major sessions. Liquid major forex pairs — for example EUR/USD or GBP/USD — typically offer tighter spreads, which matters for a strategy that targets relatively modest ATR-based moves.
Keep in mind that the strategy's logic is identical regardless of the symbol or timeframe you choose, but its behavior is not. Results will vary considerably across different instruments, timeframes, and market conditions. Before drawing any conclusions, it is worth observing how the support/resistance zones and RSI thresholds interact on the specific chart you intend to study.
How to Install on MetaTrader 5
- Download the
RsiZoneReversal.ex5file from the link below. - Copy it to your MT5
MQL5\Expertsfolder. - Restart MetaTrader 5 or refresh the Navigator panel.
- Drag the EA onto a chart matching the recommended symbol and timeframe.
- Configure the input parameters and enable Algo Trading.
What to Consider Before Using This EA
Strengths of this approach. The strategy is structurally disciplined: it requires a confluence of price structure, momentum, and candle confirmation before acting, which historically helps filter out weaker signals compared with a single-indicator system. Its use of ATR for the tolerance band, stop, and target means risk distances adapt automatically to changing volatility rather than relying on fixed pip values. The one-position-per-magic rule keeps exposure simple and predictable.
Known limitations. Mean-reversion strategies are, by design, vulnerable to strong trends. When a market breaks decisively out of its range, a strategy that fades extremes may repeatedly enter against the dominant move and have its stops hit. RSI thresholds can also remain "overbought" or "oversold" for extended periods during powerful trends — a well-documented characteristic of momentum oscillators — so the RSI filter alone does not guarantee a reversal is near. Because support and resistance are built from only the recent ZoneLookback bars, the zones shift over time and may not reflect longer-term structure visible on higher timeframes.
Conditions where it may underperform. The strategy may struggle during trending or news-driven markets, around major economic releases, and in low-liquidity periods where spreads widen and probes are erratic. It is best understood as a tool for studying range behavior, not as a system that performs uniformly across all conditions.
Risk Management Tips
Sound risk management matters more than any single entry rule. The following general principles apply when studying any automated strategy:
- Position sizing: Choose a lot size appropriate to your account equity rather than a default value. The
Lotsparameter should reflect your own risk tolerance, not a fixed number. - Risk per trade: A widely taught guideline is to risk no more than 1–2% of your account on any single trade. Because this strategy sizes its stop with ATR, you can estimate the monetary risk per trade and adjust your lot size accordingly.
- Use a demo account first: Test the strategy on a demo account across varied market conditions before considering any live use. This lets you observe its behavior without financial consequences.
- Understand drawdown: Every strategy experiences losing streaks. Study the depth and duration of drawdown in your testing so you understand what a realistic worst case might look like, and whether you could tolerate it psychologically.
- Diversify and monitor: Avoid concentrating all your risk in one strategy or instrument, and never leave automated trading entirely unattended.
Risk Warning
Trading foreign exchange, CFDs, and other leveraged financial instruments involves substantial risk of loss and is not suitable for all investors. The strategies and tools discussed on this page are provided for educational purposes only and do not constitute financial advice, investment recommendations, or solicitation to trade. Always consult a qualified financial adviser before making trading decisions. Past backtest performance is not indicative of future results.
Downloads
- Expert Advisor: RsiZoneReversal.ex5 (38 downloads)
- Source Code: RsiZoneReversal.mq5 (40 downloads)
- Documentation: RsiZoneReversal.pdf (41 downloads)