Disclaimer: This article is for educational and informational purposes only. It does not constitute financial or investment advice. Trading forex and CFDs carries significant risk of loss. Past performance of any strategy — including backtests — does not guarantee future results. Never trade with money you cannot afford to lose.
What Is This Strategy?
The Rsi Trend Pullback strategy is a trend-continuation system that combines the Relative Strength Index (RSI) — a momentum oscillator that measures the speed and size of recent price moves on a 0–100 scale — with price-action swing structure to time pullback entries inside an established trend. Rather than relying on moving averages, it reads trend direction directly from confirmed swing highs and lows, then uses RSI to detect the moment a temporary pullback runs out of steam and the dominant trend resumes.
The core idea is one of the oldest in technical trading: trends rarely move in a straight line. They advance, pull back to shake out weak hands, and then continue. This strategy is designed to wait for that pullback and enter on the snap-back — the instant momentum turns back in the direction of the trend — rather than chasing the move at its peak or trying to catch the dip while it is still falling. An Average True Range (ATR) filter, which measures how much an instrument typically moves per bar, frames both the stop-loss and a wider take-profit so that each trade is sized to current volatility.
As a learning tool, the Rsi Trend Pullback is well suited to traders who want to study how momentum oscillators and market structure can be combined into a single, rules-based approach. It is built for trending market conditions on liquid instruments and is most often studied on major forex pairs such as EUR/USD or GBP/USD. This article frames the strategy as an analysis of how the logic works — not as a profit opportunity — so you can understand its mechanics, strengths, and limitations before ever risking capital.
How It Works
The strategy operates on completed bars only — it evaluates conditions once a candle has fully closed, which avoids acting on the noise of a still-forming bar. On each new bar it updates its view of market structure and momentum, then checks for an entry signal. Here is the logic step by step:
- Reading the trend (swing structure): The strategy scans recent bars to identify confirmed swing highs and swing lows. A swing high is a bar whose high is greater than the
SwingLookbackbars on either side of it; a swing low is the mirror image. When the most recent swing low sits above the previous swing low (a "higher low"), the strategy reads this as an uptrend. When the most recent swing high sits below the previous one (a "lower high"), it reads a downtrend. - Waiting for the pullback (RSI momentum): Inside a confirmed trend, the strategy waits for RSI to dip into the opposite-of-trend zone — a sign that price is pulling back. The pullback band is symmetric around the midpoint: a lower band at
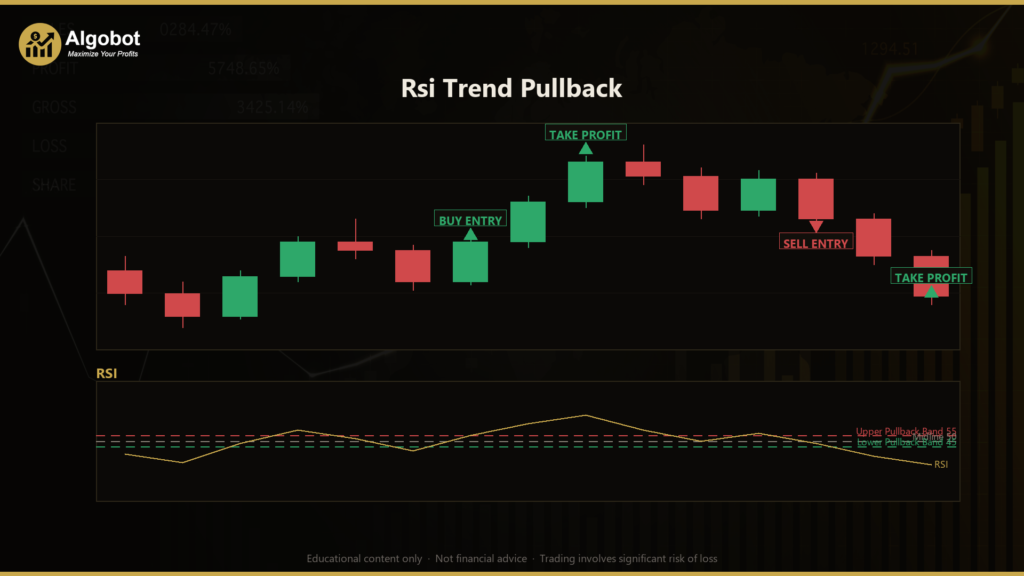
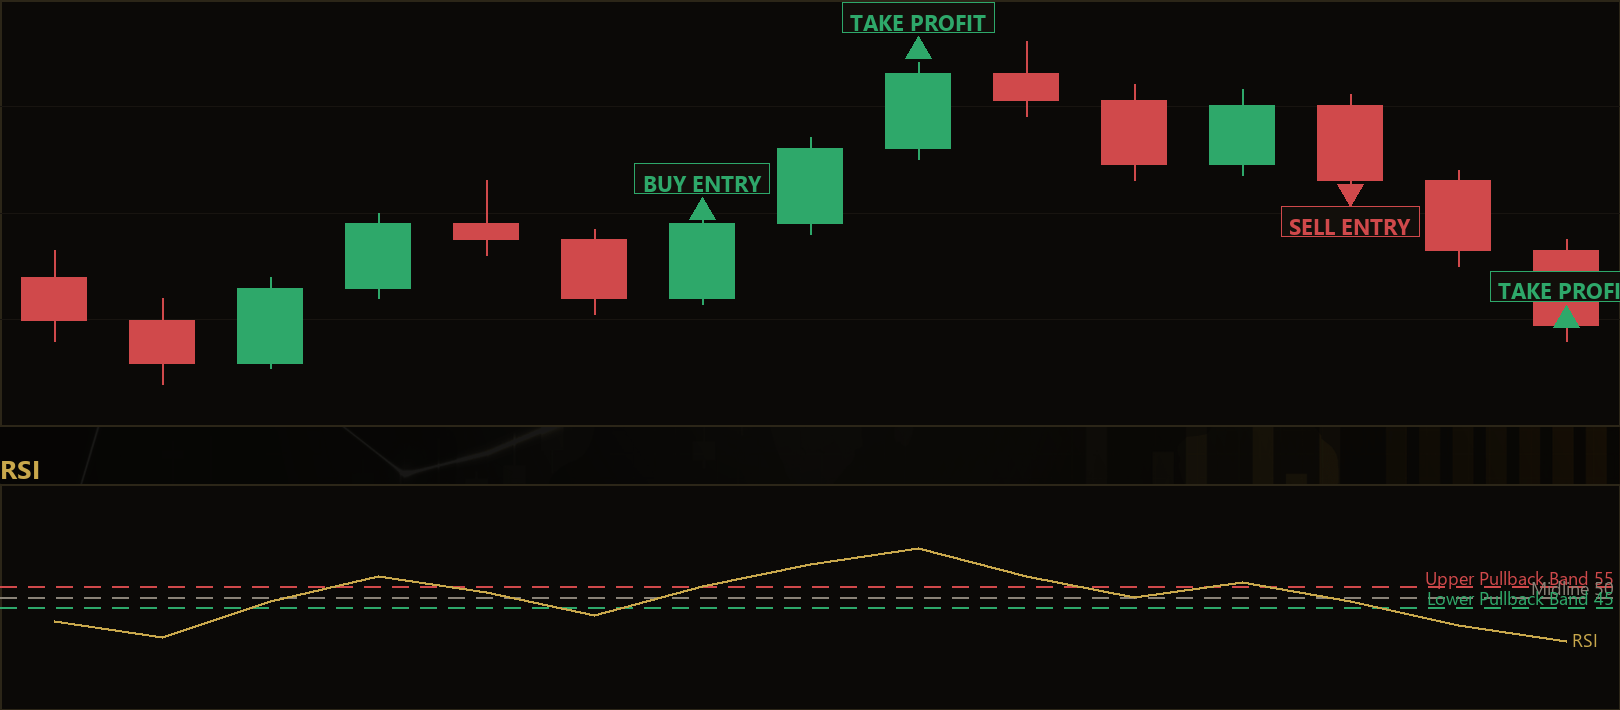
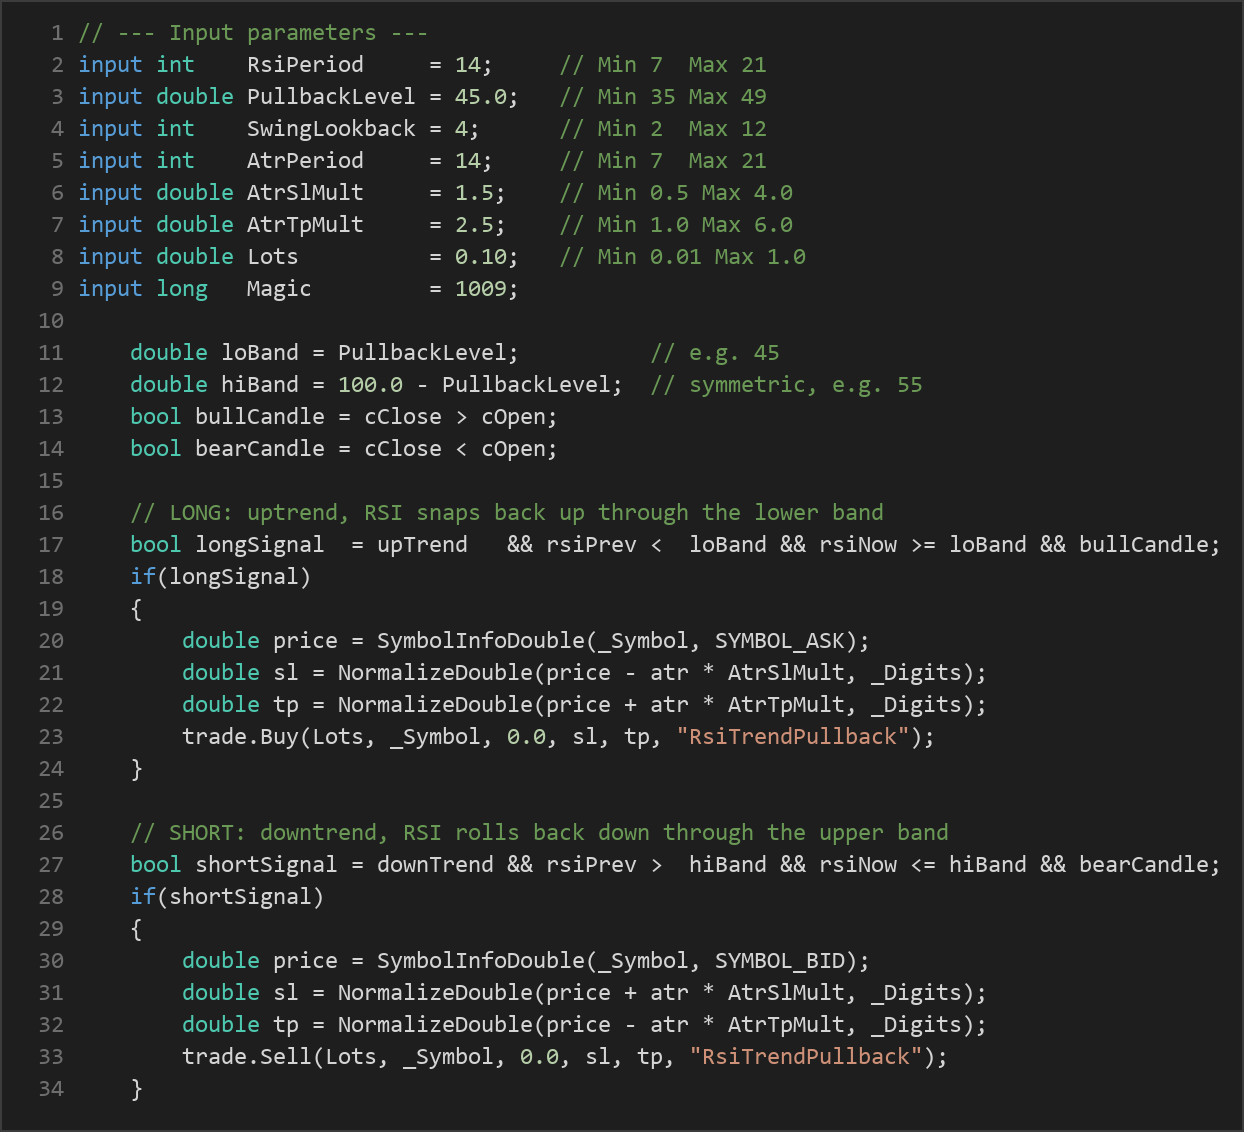
PullbackLevel(e.g. 45) and an upper band at100 − PullbackLevel(e.g. 55). - The long entry signal: In an uptrend, the strategy signals a buy when RSI on the prior bar was below the lower band, RSI on the just-closed bar has crossed back up through that band, and the just-closed candle is bullish (closes above its open). This confirms that the pullback's momentum has reversed and the uptrend may be resuming.
- The short entry signal: In a downtrend, the strategy signals a sell when RSI on the prior bar was above the upper band, RSI on the just-closed bar has rolled back down through it, and the just-closed candle is bearish (closes below its open).
- One position at a time: The strategy holds only a single open position per symbol for its magic number, so it will not stack multiple trades on the same signal.
- Stop-loss logic: When an entry triggers, the stop is placed at a distance of ATR ×
AtrSlMultaway from the entry price — below the entry for longs, above it for shorts. Because it is anchored to ATR, the stop automatically widens in volatile conditions and tightens in quiet ones. - Take-profit logic: The target is placed at ATR ×
AtrTpMultin the direction of the trade. With the default multipliers (1.5 stop, 2.5 target), each trade is framed for a positive reward-to-risk ratio of roughly 1.67-to-1 before costs.
Because the take-profit is wider than the stop, the strategy historically relies on its winning trades being larger than its losing trades to remain viable, rather than on a high win rate.
Strategy Parameters
| Parameter | Default | Min | Max | Description |
|---|---|---|---|---|
| RsiPeriod | 14 | 7 | 21 | Number of bars used to calculate the RSI momentum oscillator. Lower values make RSI more reactive; higher values smooth it. |
| PullbackLevel | 45.0 | 35.0 | 49.0 | The lower RSI band that defines a pullback. The upper band is set symmetrically at 100 − this value. Values closer to 50 trigger on shallower pullbacks. |
| SwingLookback | 4 | 2 | 12 | Number of bars on each side of a candidate bar required to confirm it as a swing high or low. Larger values demand more significant, less frequent swings. |
| AtrPeriod | 14 | 7 | 21 | Number of bars used to calculate ATR, which measures average volatility for stop and target sizing. |
| AtrSlMult | 1.5 | 0.5 | 4.0 | Multiplier applied to ATR to set the stop-loss distance from entry. |
| AtrTpMult | 2.5 | 1.0 | 6.0 | Multiplier applied to ATR to set the take-profit distance from entry. |
| Lots | 0.10 | 0.01 | 1.0 | Fixed trade size (lot volume) sent with each order. |
Recommended Chart Settings
The Rsi Trend Pullback was designed as a single-timeframe strategy — every calculation runs on whichever timeframe the chart is set to. It is best studied on liquid major forex pairs such as EUR/USD or GBP/USD, on intraday timeframes in the M15 to H1 range, where trends are clear enough for swing structure to be meaningful and spreads remain low. That said, the logic is symbol- and timeframe-agnostic and can be applied elsewhere for study. Keep in mind that behavior and results will vary considerably across different instruments, timeframes, and market conditions, and any parameter set that looks favorable in one period may behave very differently in another.
How to Install on MetaTrader 5
- Download the
RsiTrendPullback.ex5file from the link below - Copy it to your MT5
MQL5\Expertsfolder - Restart MetaTrader 5 or refresh the Navigator panel
- Drag the EA onto a chart matching the recommended symbol and timeframe
- Configure the input parameters and enable Algo Trading
What to Consider Before Using This EA
Like every approach, the Rsi Trend Pullback has clear strengths and equally clear limitations, and understanding both is essential.
Strengths. By entering only after momentum has snapped back, the strategy avoids buying into a falling market — a common failing of naive "oversold" RSI systems. Anchoring trend detection to actual swing structure rather than lagging moving averages keeps it responsive to real price behavior, and ATR-based stops and targets adapt the risk frame to current volatility instead of using fixed pip distances.
Limitations. This is fundamentally a trend-continuation method, so its weakest environment is a range-bound or choppy market. In sideways conditions, swings alternate without forming consistent higher-lows or lower-highs, and RSI may whipsaw across the band, producing entries that get stopped out as price reverses. The strategy also requires a sustained trend to reach its wider take-profit; in slow, directionless markets, targets may go untouched while stops are hit. Finally, because it trades a single position at a time, it can miss additional opportunities during strong, extended trends. No indicator combination removes the possibility of losing trades, and a string of consecutive losses is a normal part of any strategy's behavior.
Risk Management Tips
Sound risk management matters far more than any single entry rule. Consider these general principles as part of your education:
- Risk a small, fixed percentage per trade. Many educational sources suggest risking no more than 1–2% of account equity on any single position, so that a losing streak does not threaten the account.
- Size positions to your stop, not the other way around. The default
Lotsvalue is fixed; adjust it so that the ATR-based stop distance translates into an acceptable monetary risk for your account. - Test on a demo account first. Run the strategy on a demo account across varied market conditions before considering any live use, so you understand how it behaves in both trending and ranging periods.
- Understand drawdown. Every strategy experiences periods of consecutive losses and equity decline. Know the historical drawdown of any approach you study, and ask whether you could tolerate it emotionally and financially.
- Account for costs. Spreads, commissions, and slippage all erode results — especially on lower timeframes — and should be factored into any realistic assessment.
Risk Warning
Trading foreign exchange, CFDs, and other leveraged financial instruments involves substantial risk of loss and is not suitable for all investors. The strategies and tools discussed on this page are provided for educational purposes only and do not constitute financial advice, investment recommendations, or solicitation to trade. Always consult a qualified financial adviser before making trading decisions. Past backtest performance is not indicative of future results.
Downloads
- Expert Advisor: RsiTrendPullback.ex5 (57 downloads)
- Source Code: RsiTrendPullback.mq5 (68 downloads)
- Documentation: RsiTrendPullback.pdf (51 downloads)