Disclaimer: This article is for educational and informational purposes only. It does not constitute financial or investment advice. Trading forex and CFDs carries significant risk of loss. Past performance of any strategy — including backtests — does not guarantee future results. Never trade with money you cannot afford to lose.
What Is This Strategy?
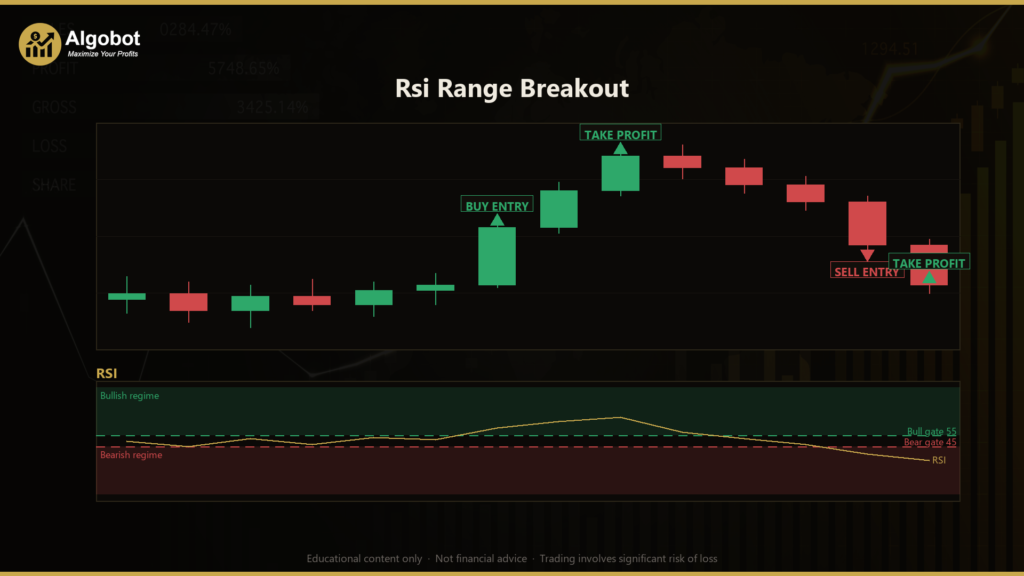
Rsi Range Breakout is a momentum-breakout strategy built around a single technical indicator: the Relative Strength Index (RSI), a classic oscillator that measures the speed and magnitude of recent price changes on a 0–100 scale. What sets Rsi Range Breakout apart is the unconventional way it reads that oscillator. Rather than trading RSI the textbook overbought/oversold way — buying when RSI is "low" and selling when it is "high" — this strategy treats the RSI line itself as a range, or "box," that price-momentum can break out of.
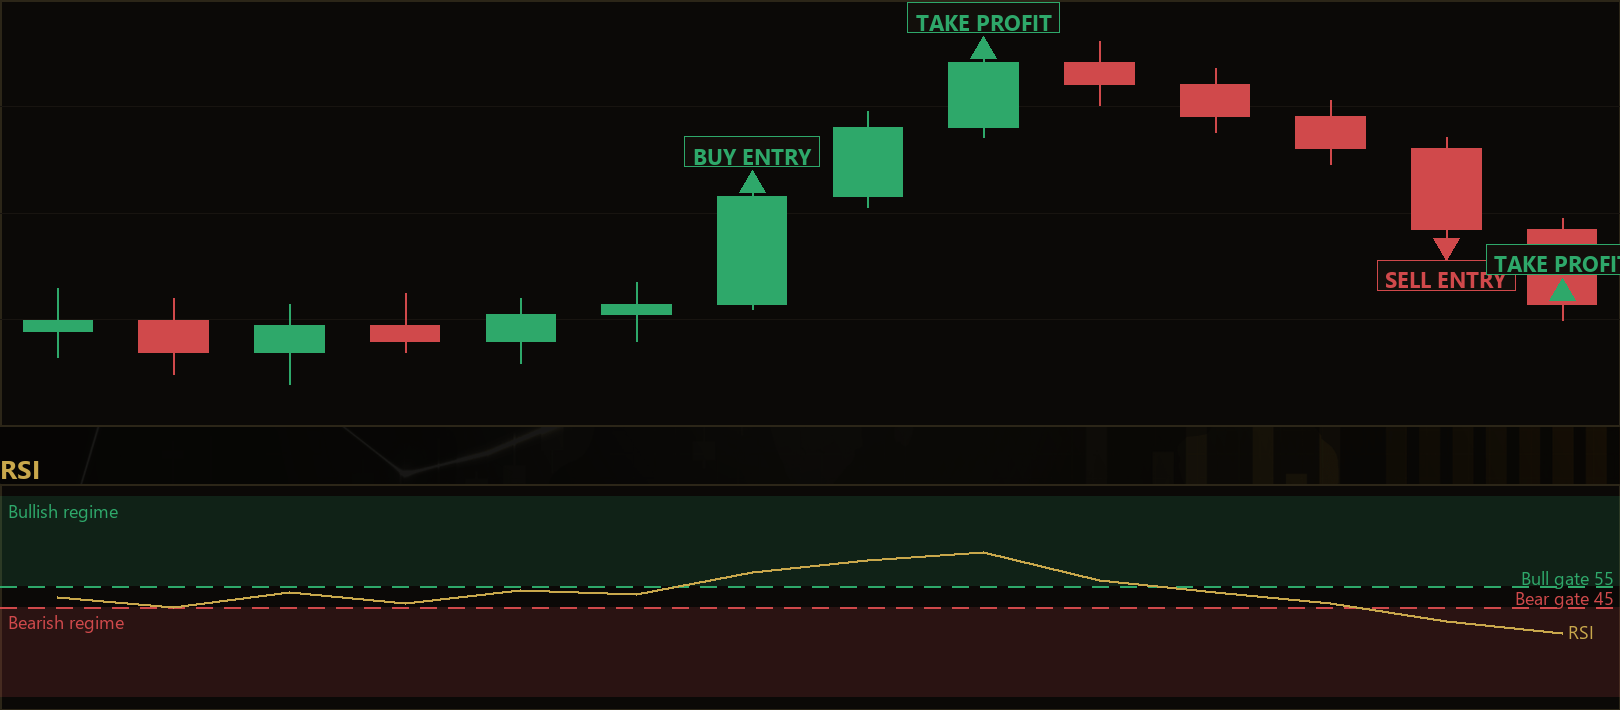
The core idea is that momentum tends to coil before it expands. When RSI spends a stretch of bars oscillating inside a narrow band, it is effectively building a momentum range: its own recent highest and lowest readings define the top and floor of a box. When RSI finally thrusts decisively through that box, the strategy interprets it as a shift in momentum gear — a moment when order-flow pressure has changed regime. Rsi Range Breakout lets the RSI line pick the direction and then enters in the direction of that release. It is, in short, a breakout-style trend-entry system rather than a mean-reversion one.
As a learning tool, this strategy suits traders who want to study how a single oscillator can be repurposed for breakout logic, and who are curious about combining momentum signals with structural (price-based) risk control. It is designed for liquid, trending instruments and is best understood as an analytical framework for studying momentum expansion — not as a turnkey income system. If you are exploring how breakout filters reduce false signals, the design here is a clean, self-contained case study.
How It Works
Rsi Range Breakout evaluates its rules once per newly-closed bar, never mid-bar. On each closed bar it records one RSI value, building a rolling history. From that history it constructs the "RSI box" and checks whether momentum has broken out of it.
Building the RSI box:
- The strategy computes RSI on every closed bar and stores it in a rolling list.
RsiHigh(the box top) is the highest RSI reading over the previousRsiLookbackbars.RsiLow(the box floor) is the lowest RSI reading over that same window.- The current bar's RSI reading is deliberately excluded from the box, so the breakout is measured against prior history.
Long entry — the strategy signals a long when:
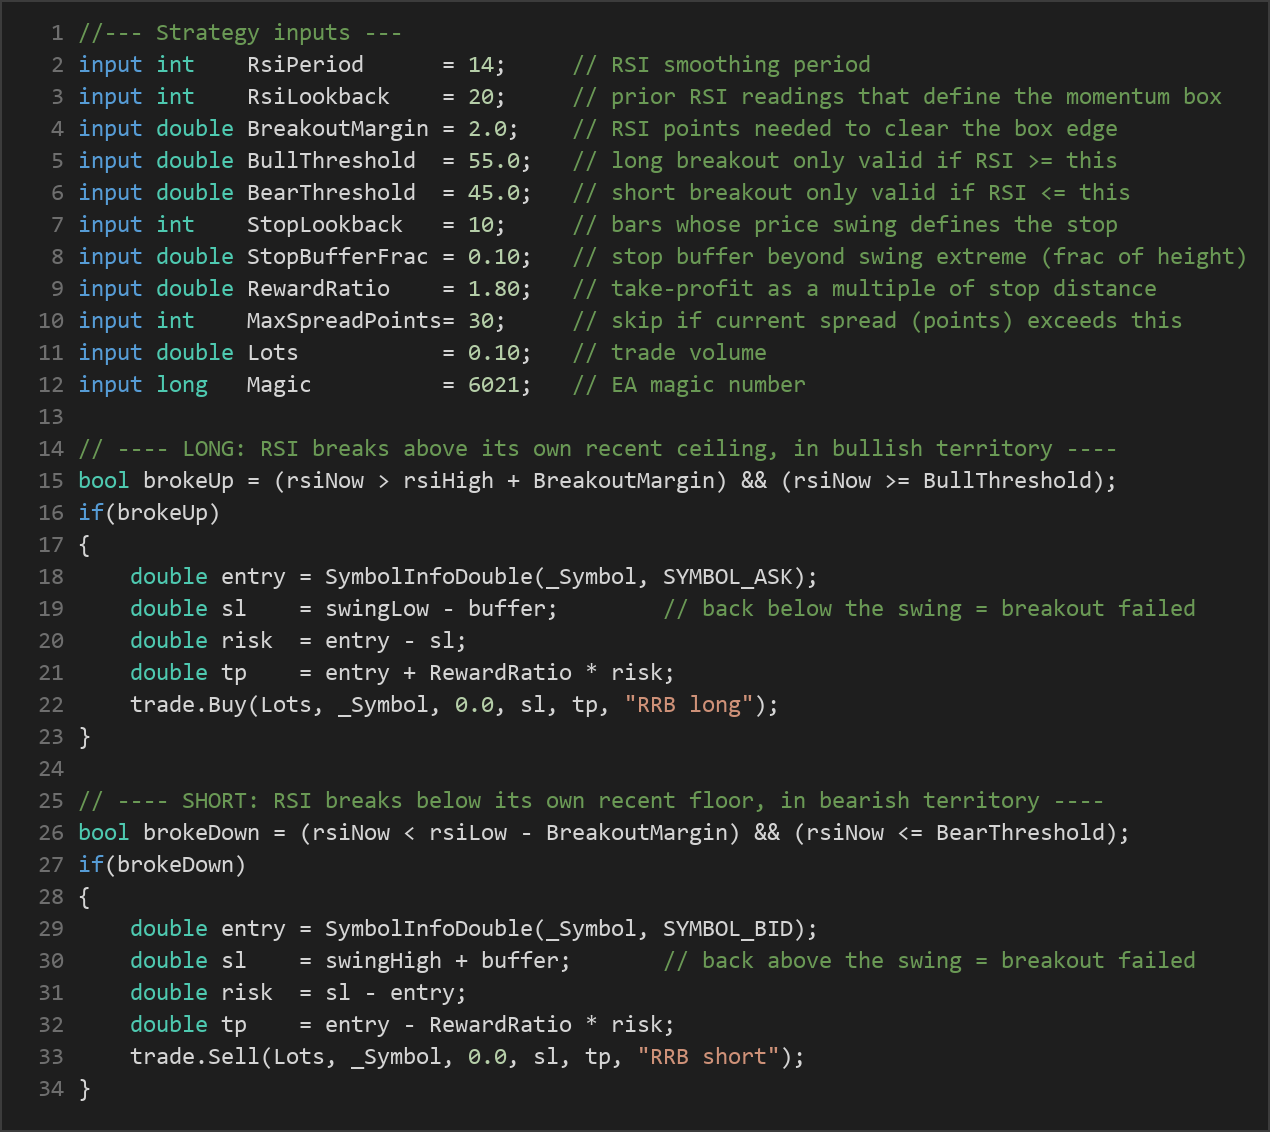
- The current RSI pushes above the box top (
RsiHigh) by at leastBreakoutMarginRSI points — a decisiveness filter that ignores marginal pokes through the ceiling. - And the current RSI is in genuinely bullish territory, at or above
BullThreshold(default 55). This second gate prevents a small bounce off oversold — say RSI rising from 20 to 35, which is technically a new local high but still bearish — from being mistaken for a real upside breakout.
Short entry — the mirror image. The strategy signals a short when:
- The current RSI breaks below the box floor (
RsiLow) by at leastBreakoutMargin. - And the current RSI is in bearish territory, at or below
BearThreshold(default 45).
Stop-loss logic (structural, not fixed-distance):
- The stop is placed beyond the recent price swing rather than at a fixed pip distance.
- For longs, the stop sits below the lowest low of the last
StopLookbackbars; for shorts, above the highest high of that window. - A buffer equal to
StopBufferFrac× the swing's height is added beyond that extreme, so a small wick does not trip the stop. Because raw candle highs and lows are price structure (not an indicator), the "RSI only" signalling rule is preserved.
Take-profit logic:
- The target is a fixed reward-to-risk multiple of the structural stop distance, set by
RewardRatio(default 1.80). If the stop is, say, 30 points away, the target is roughly 54 points in the trade's favour, letting post-breakout momentum run.
Trade management filters:
- Only one position per magic number is allowed at a time; the structural stop and target manage the exit, so there is no separate trailing logic.
- A spread gate skips any signal when the current spread (in points) exceeds
MaxSpreadPoints, helping avoid entries during illiquid or high-cost conditions.
Strategy Parameters
| Parameter | Default | Min | Max | Description |
|---|---|---|---|---|
| RsiPeriod | 14 | 7 | 28 | The smoothing period for the RSI calculation. Lower values make RSI more reactive; higher values smooth it. |
| RsiLookback | 20 | 8 | 60 | How many prior RSI readings define the momentum box that must be broken. |
| BreakoutMargin | 2.0 | 0.0 | 12.0 | How many RSI points the current reading must clear the box edge by — a decisiveness filter. |
| BullThreshold | 55.0 | 50.0 | 70.0 | A long breakout only counts if RSI is at or above this bullish-regime gate. |
| BearThreshold | 45.0 | 30.0 | 50.0 | A short breakout only counts if RSI is at or below this bearish-regime gate. |
| StopLookback | 10 | 3 | 40 | The number of bars whose price swing defines the structural stop. |
| StopBufferFrac | 0.10 | 0.00 | 1.00 | Stop buffer beyond the swing extreme, expressed as a fraction of the swing's height. |
| RewardRatio | 1.80 | 0.80 | 4.00 | Take-profit distance as a multiple of the structural stop distance. |
| MaxSpreadPoints | 30 | 1 | 200 | Skip the trade if the current spread (in points) is wider than this. |
| Lots | 0.10 | 0.01 | 1.00 | The fixed trade volume in lots. |
| Magic | 6021 | 0 | 9,999,999 | The EA's magic number, used to identify its own positions. |
Recommended Chart Settings
Rsi Range Breakout was designed with a liquid, trending instrument in mind — a "trender" such as GBPUSD or XAUUSD (gold) — on the M15 or M30 timeframe. These markets and timeframes tend to produce the kind of momentum expansion the strategy is built to detect: periods of consolidation followed by directional thrusts.
Because the risk model is structural and self-scaling (it derives stop distance from recent price swings rather than from fixed point or pip values), the logic is symbol- and timeframe-agnostic in principle and can be studied on other instruments. That said, results will vary considerably across different market conditions, instruments, and timeframes. Always test any configuration on historical data and a demo account before drawing conclusions about its behaviour.
How to Install on MetaTrader 5
- Download the .ex5 file from the link below
- Copy it to your MT5
MQL5\Expertsfolder - Restart MetaTrader 5 or refresh the Navigator panel
- Drag the EA onto a chart matching the recommended symbol and timeframe
- Configure the input parameters and enable Algo Trading
What to Consider Before Using This EA
Like every approach, Rsi Range Breakout has identifiable strengths and limitations, and understanding both is part of using it responsibly.
Strengths of the approach:
- The dual-gate entry — requiring both a clean break of RSI's own range and a directional threshold — is designed to filter out the aimless mid-range chop where naive RSI signals often bleed out.
- Structural stops that adapt to recent volatility are generally more robust than fixed-distance stops, because they widen in volatile conditions and tighten in quiet ones automatically.
- The strategy is fully self-contained and uses a single indicator, which makes its behaviour easier to study and reason about than multi-indicator systems.
Known limitations:
- Breakout systems are, by nature, prone to false breakouts — moments when momentum appears to expand but quickly reverses. In ranging or choppy markets, this strategy may signal entries that fail shortly after, producing a string of small losses.
- RSI is a lagging, smoothed measure of momentum. By the time a breakout registers, part of the move may already have occurred, which can affect entry timing.
- The fixed reward-to-risk target does not adapt to changing momentum; a strong trend may run far past the target, while a weak one may stall before reaching it.
- A single fixed lot size does not scale risk to account equity. Performance is highly dependent on the chosen parameters and the prevailing market regime.
This strategy is best treated as an educational framework for studying momentum breakouts — not as a finished, hands-off solution.
Risk Management Tips
Sound risk management matters more than any single entry signal. As you study this or any strategy, keep these general principles in mind:
- Risk a small, fixed fraction per trade. Many educational sources suggest risking no more than 1–2% of account equity on any single position, so that a losing streak does not threaten your capital.
- Size positions deliberately. The default fixed lot size here is a starting point for study, not a recommendation. Position size should reflect your account size and the structural stop distance, not convenience.
- Always test on a demo account first. Run the strategy in a risk-free simulated environment until you understand how it behaves across different conditions before considering live capital.
- Understand drawdown. Every strategy experiences losing periods. Knowing the depth and duration of historical drawdowns helps you set realistic expectations and avoid abandoning a plan at the worst moment.
- Account for trading costs. Spreads, commissions, and slippage all erode results, which is why the built-in spread gate exists. Factor these costs into any analysis.
- Never rely on a single strategy or instrument. Diversification of approach and market is a core principle of prudent risk management.
Risk Warning
Trading foreign exchange, CFDs, and other leveraged financial instruments involves substantial risk of loss and is not suitable for all investors. The strategies and tools discussed on this page are provided for educational purposes only and do not constitute financial advice, investment recommendations, or solicitation to trade. Always consult a qualified financial adviser before making trading decisions. Past backtest performance is not indicative of future results.
Downloads
- Expert Advisor: RsiRangeBreakout.ex5 (60 downloads)
- Source Code: RsiRangeBreakout.mq5 (62 downloads)
- Documentation: RsiRangeBreakout.pdf (69 downloads)