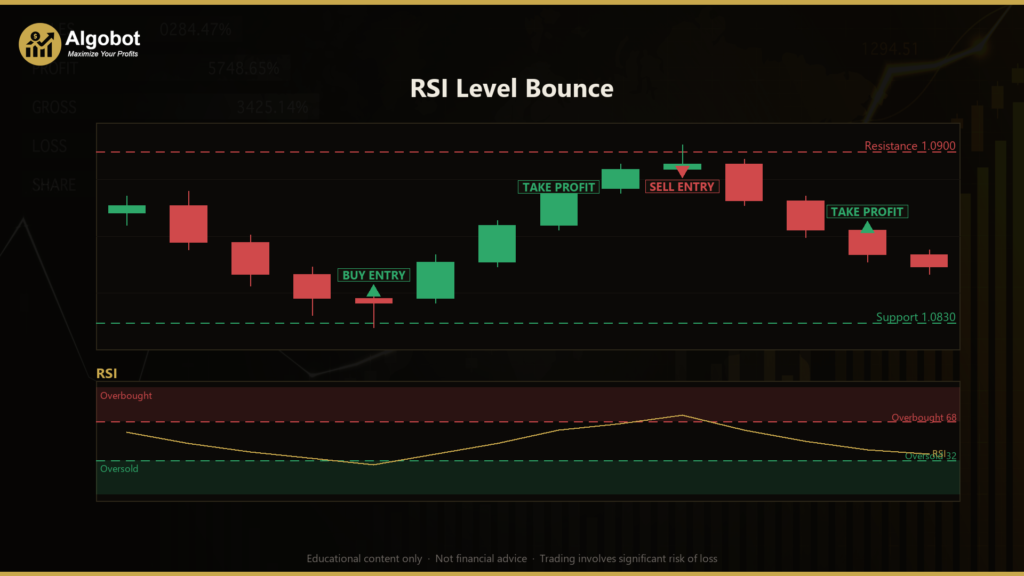
Disclaimer: This article is for educational and informational purposes only. It does not constitute financial or investment advice. Trading forex and CFDs carries significant risk of loss. Past performance of any strategy — including backtests — does not guarantee future results. Never trade with money you cannot afford to lose.
What Is This Strategy?
RSI Level Bounce is a mean-reversion trading strategy that combines the Relative Strength Index (RSI) — a momentum oscillator that measures how stretched recent price moves have become — with objective support and resistance levels and a candlestick rejection filter. Rather than chasing trends, it looks for moments when price overextends into a key level, fails to break through, and snaps back. In trading terms, this is a "fade the extreme" approach, designed for ranging or oscillating markets where price repeatedly tests the same boundaries.
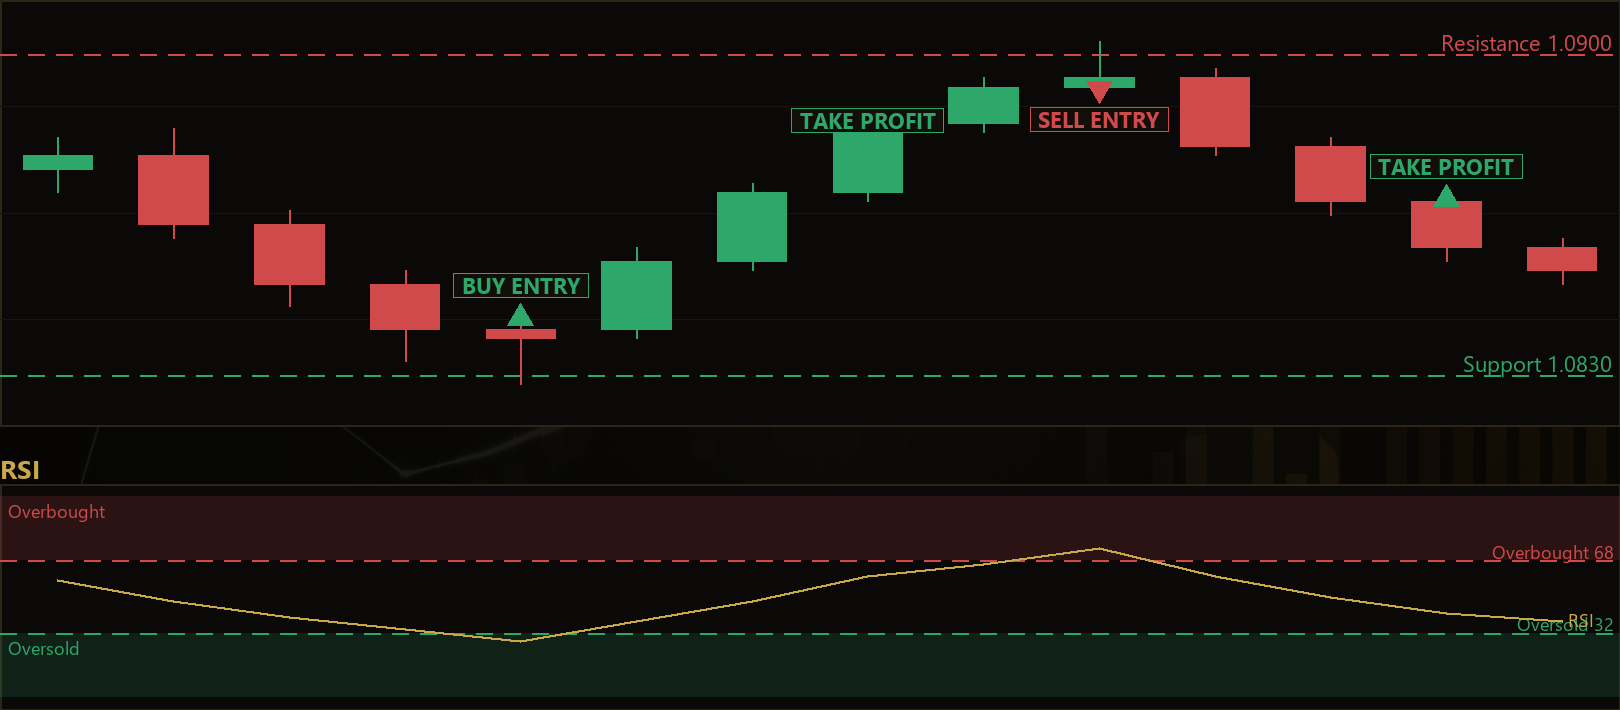
The strategy builds its support and resistance lines mechanically. Support is simply the lowest low, and resistance the highest high, over a rolling lookback window of recent bars. When the most recently closed bar pokes its wick through one of those levels but closes back on the original side — and the RSI confirms that momentum is overstretched — the strategy reads this as a rejection and signals a trade in the opposite direction. Longs are taken at support; shorts are taken at resistance. The two branches are symmetric but completely independent of one another.
As a learning tool, RSI Level Bounce is well suited to traders who want to study how oscillators and price structure can be combined into a single, rule-based system. It demonstrates several concepts at once: objective level construction, multi-condition confirmation (you need three things to align before a trade fires), and volatility-based risk placement using the Average True Range. This article is a strategy analysis — a walkthrough of how the logic works — not a claim about what it can earn.
How It Works
The strategy evaluates its rules only once per bar, acting strictly on the just-closed bar (the "signal bar") so that no decision is made on incomplete data. Here is the logic step by step.
Level construction:
- On each new bar, the strategy looks back over a window of completed bars before the signal bar (controlled by the
Lookbackparameter). - Support is set to the lowest low in that window; resistance is set to the highest high.
Long entry — a bounce off support. The strategy signals a long only when all of the following line up:
- Pierce: the signal bar's low trades into the support zone (its low reaches at or below support plus a small ATR-based tolerance buffer).
- Rejection: the signal bar closes back above support, showing the level held.
- Bar direction: the signal bar is bullish (it closes above its open).
- Momentum: the RSI is oversold — at or below the
50 − RsiLevelthreshold — indicating selling pressure may be exhausted.
Short entry — a rejection at resistance. The mirror image, signalled when:
- Pierce: the signal bar's high reaches into the resistance zone (at or above resistance minus the buffer).
- Rejection: the signal bar closes back below resistance.
- Bar direction: the signal bar is bearish (it closes below its open).
- Momentum: the RSI is overbought — at or above the
50 + RsiLevelthreshold.
Stop-loss logic:
- For longs, the stop is placed below the lower of the signal bar's low or the support level, then pushed further away by a multiple of ATR (
SlAtrMult). This keeps the stop beyond the rejected wick. - For shorts, the stop sits above the higher of the signal bar's high or resistance, again offset by the ATR multiple. Using ATR means the stop adapts to current volatility rather than using a fixed pip distance.
Take-profit logic:
- The distance from entry to stop is treated as the trade's measured risk.
- The take-profit is then set as a fixed multiple of that risk, defined by the
RewardRatioparameter. With the default of 1.8, the target sits 1.8 times further from entry than the stop.
Position management:
- Only one position per Magic number is allowed on the symbol at a time — the strategy never stacks or adds to a trade. Once a position is open, no new signal is acted on until it closes via its stop or target.
Strategy Parameters
| Parameter | Default | Min | Max | Description |
|---|---|---|---|---|
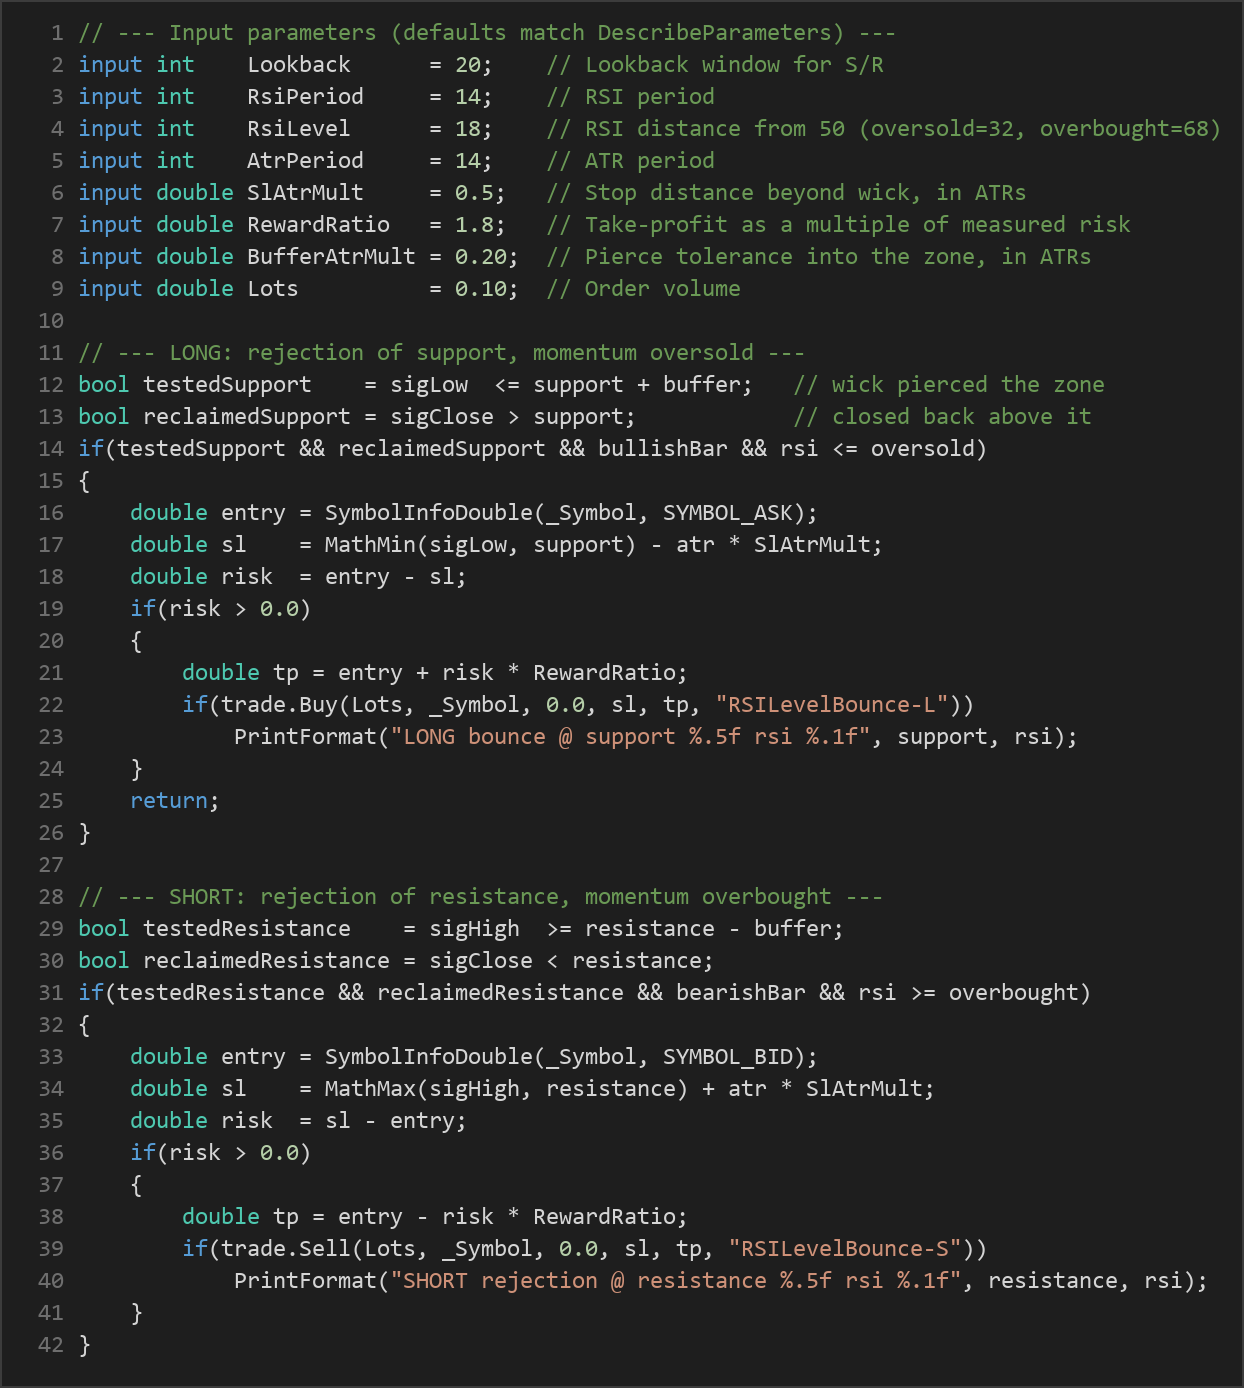
| Lookback | 20 | 5 | 60 | Number of bars used to build the support (lowest low) and resistance (highest high) levels. |
| RsiPeriod | 14 | 5 | 30 | The lookback period for the RSI momentum oscillator. |
| RsiLevel | 18 | 5 | 30 | Distance of the RSI thresholds from the midline of 50. Oversold = 50 − level; overbought = 50 + level. |
| AtrPeriod | 14 | 5 | 40 | The period for the Average True Range, used to size the stop and the pierce buffer. |
| SlAtrMult | 0.5 | 0.1 | 3.0 | How far beyond the rejected wick the stop-loss is placed, measured in ATRs. |
| RewardRatio | 1.8 | 0.5 | 5.0 | Take-profit distance as a multiple of the measured risk (entry-to-stop distance). |
| BufferAtrMult | 0.20 | 0.0 | 1.5 | Tolerance, in ATRs, for how far the wick may pierce into the level and still count as a test. |
| Lots | 0.10 | 0.01 | 1.0 | Fixed order volume in lots for each trade. |
Recommended Chart Settings
RSI Level Bounce is a single-timeframe strategy: every calculation uses the chart's own timeframe, so it runs on whichever timeframe you attach it to. Because it is mean-reversion logic that fades extremes, it tends to suit liquid markets that spend meaningful time ranging rather than trending hard in one direction — for example major forex pairs on intraday timeframes such as M15, M30, or H1.
There is no single "correct" setting. The defaults (a 20-bar lookback, 14-period RSI and ATR) are a sensible starting point for study, but the appropriate symbol, timeframe, and parameter values depend heavily on the instrument's volatility and behaviour. Results will vary considerably across different market conditions, and any setting that historically suited one environment may behave very differently in another. Treat the recommended settings as a baseline for testing, not a finished configuration.
How to Install on MetaTrader 5
- Download the .ex5 file from the link below
- Copy it to your MT5
MQL5\Expertsfolder - Restart MetaTrader 5 or refresh the Navigator panel
- Drag the EA onto a chart matching the recommended symbol and timeframe
- Configure the input parameters and enable Algo Trading
What to Consider Before Using This EA
Every strategy has a personality, and understanding RSI Level Bounce's strengths and weaknesses is part of using it responsibly.
Strengths of this approach:
- Multi-condition confirmation. Requiring a pierce, a close-based rejection, the correct bar direction, and an RSI extreme filters out many weak signals that a single indicator would take.
- Objective levels. Support and resistance are computed mechanically from highs and lows, removing the subjectivity of hand-drawn lines.
- Volatility-aware risk. Because the stop and buffer scale with ATR, the strategy adapts its risk placement to current market conditions instead of using fixed distances.
- Defined risk-to-reward. The take-profit is always a known multiple of the stop distance, making each trade's risk profile explicit before entry.
Known limitations:
- Mean-reversion struggles in strong trends. The biggest weakness of any "fade the level" system is a market that breaks through support or resistance and keeps going. In a powerful trend, repeated bounce signals can fail as price marches past the level.
- Lagging confirmation. Waiting for a bar to close and for RSI to reach an extreme means entries occur after the initial move, which can reduce the favourable distance to the target.
- Level quality varies. A lookback high or low is only as meaningful as the structure around it; in choppy or news-driven conditions, these levels may not represent genuine barriers.
- Fixed lot sizing. The strategy trades a constant volume regardless of account size or stop distance, which does not scale risk per trade.
The strategy may underperform during trending or highly volatile regimes and during major economic news, when levels are routinely overrun. It tends to be more at home in calmer, range-bound conditions. None of this makes the approach "good" or "bad" — it simply means context matters, and forward-testing on a demo account is essential before drawing any conclusions.
Risk Management Tips
Sound risk management matters far more than any single entry rule. Consider these general principles as you study this or any strategy:
- Risk a small, fixed fraction per trade. Many educational resources suggest risking no more than 1–2% of account equity on any single position. Since this EA uses a fixed lot size, you may need to adjust
Lotsso that the ATR-based stop distance keeps your per-trade risk within that band. - Test on a demo account first. Always run a new strategy in a risk-free simulated environment until you understand how it behaves across different conditions.
- Understand drawdown. Even a sound strategy will experience losing streaks. Knowing the historical depth and duration of drawdown helps you decide whether you can stomach the equity swings.
- Account for costs. Spreads, commissions, and slippage all eat into results, especially on lower timeframes where trades are more frequent.
- Never over-leverage. Leverage magnifies both gains and losses; use it conservatively and size positions to survive a string of losses.
Risk Warning
Trading foreign exchange, CFDs, and other leveraged financial instruments involves substantial risk of loss and is not suitable for all investors. The strategies and tools discussed on this page are provided for educational purposes only and do not constitute financial advice, investment recommendations, or solicitation to trade. Always consult a qualified financial adviser before making trading decisions. Past backtest performance is not indicative of future results.
Downloads
- Expert Advisor: RSILevelBounce.ex5 (70 downloads)
- Source Code: RSILevelBounce.mq5 (67 downloads)
- Documentation: RSILevelBounce.pdf (60 downloads)