Disclaimer: This article is for educational and informational purposes only. It does not constitute financial or investment advice. Trading forex and CFDs carries significant risk of loss. Past performance of any strategy — including backtests — does not guarantee future results. Never trade with money you cannot afford to lose.
What Is This Strategy?
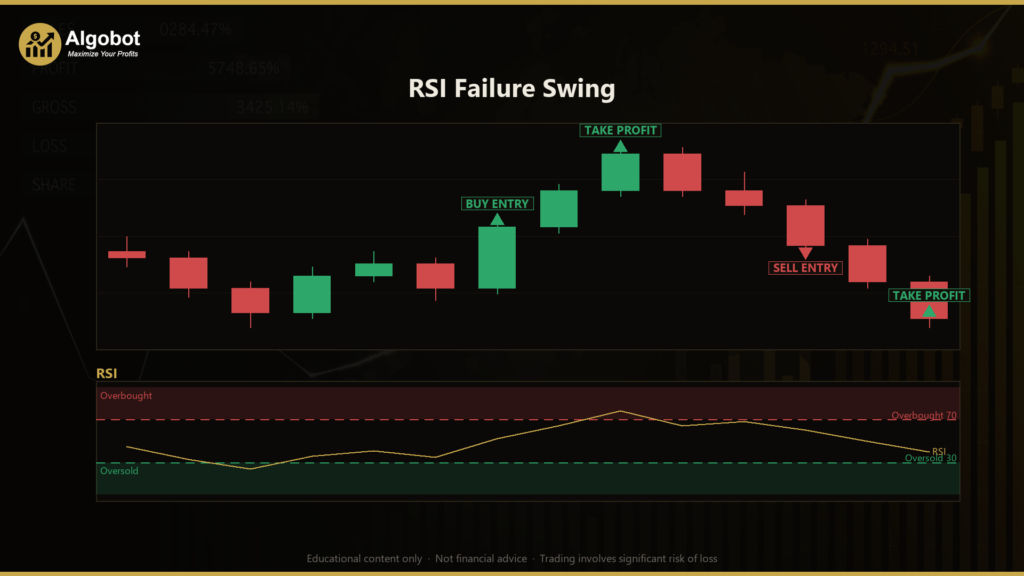
The RSI Failure Swing is a momentum-reversal strategy built around Wilder's Relative Strength Index (RSI), a classic oscillator that measures the speed and magnitude of recent price changes on a scale of 0 to 100. Unlike the common beginner approach of buying simply because RSI dips below 30, this strategy waits for a specific multi-step pattern on the RSI line itself — known as a "failure swing" — before it signals a potential turning point. By requiring the indicator to confirm its own structure before acting, the approach aims to be far more selective and to filter out many of the false signals that plague naive overbought/oversold rules.
This is a counter-trend, swing-style strategy. It is designed to look for moments when downward or upward momentum is structurally exhausting itself, rather than to chase an established trend. As such, it tends to be most interesting in markets that oscillate, range, or experience sharp pushes that then reverse — conditions where momentum exhaustion is a recurring theme. It runs on a single timeframe selected at backtest time and adapts its risk sizing to volatility using the Average True Range (ATR) indicator.
As a learning tool, the RSI Failure Swing is well suited to intermediate traders who already understand basic oscillator behavior and want to study how a disciplined, rules-based pattern can be encoded in software. It demonstrates the difference between a simple threshold cross and a genuine momentum-structure signal, and it offers a clean example of a finite state machine driving trade logic. It is best treated as a study in signal selectivity and risk framing — not as a shortcut to results.
How It Works
The strategy runs two mirrored detectors at the same time: one watching for bullish failure swings near the oversold zone, and one watching for bearish failure swings near the overbought zone. Each detector advances through phases as the RSI line evolves, and it only fires when the full pattern completes.
Bullish failure swing (signals a potential LONG):
- The strategy signals interest when RSI first drops below the Oversold level, printing an initial low it labels L1.
- RSI then recovers back above the Oversold level to an interim peak, called the fail point (P).
- RSI pulls back to a second low (L2) that holds above the Oversold level and is higher than L1 — a higher low on the oscillator.
- When RSI then breaks back above the fail point P, the pattern is complete and the strategy signals a long entry, interpreting the higher low as momentum structurally turning up.
Bearish failure swing (signals a potential SHORT):
- This is the exact mirror image. RSI first pushes above the Overbought level, printing an initial high (H1).
- RSI falls back below Overbought to an interim trough (the fail point).
- RSI bounces to a second high (H2) that stays below Overbought and is lower than H1 — a lower high.
- When RSI then breaks back below the fail-point trough, the strategy signals a short entry.
How signals become trades:
- The strategy acts only once per completed bar, using closed-bar data so signals are not repainted on a still-forming candle.
- On a long signal, it first flattens any open short on the symbol, then opens one long position (it will not stack a second long while one is already open). Shorts work the same way in reverse.
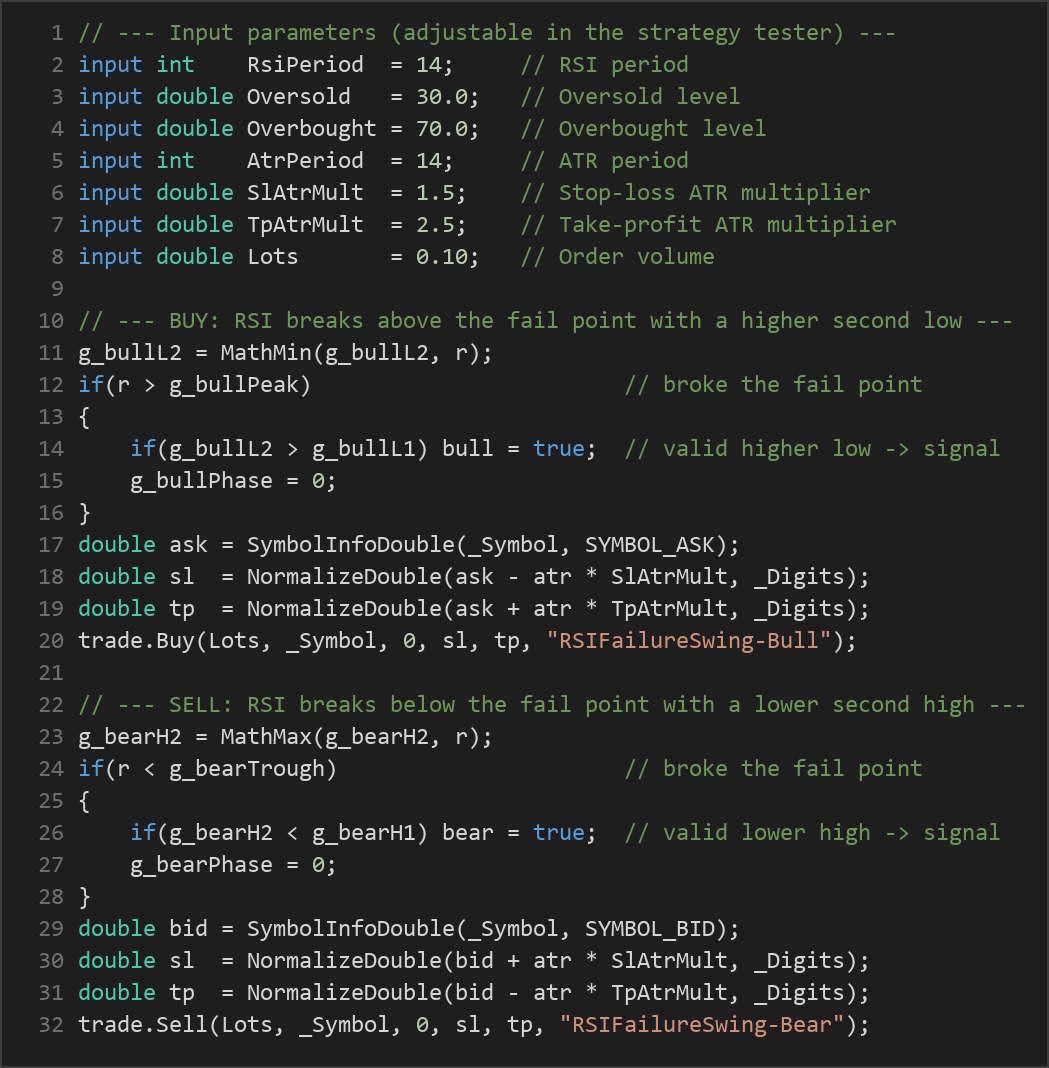
- Stop-loss logic is volatility-based: for a long, the stop is placed at the current Ask price minus ATR multiplied by the
SlAtrMultsetting; for a short, it is the Bid plus that distance. - Take-profit logic uses the same ATR-scaled approach: the target sits ATR multiplied by
TpAtrMultaway from entry. Because both the stop and target are sized from current ATR, the system automatically widens its risk distances in volatile conditions and tightens them in calm ones.
Strategy Parameters
| Parameter | Default | Min | Max | Description |
|---|---|---|---|---|
| RsiPeriod | 14 | 5 | 30 | Number of bars used to calculate the RSI oscillator. Lower values make RSI more reactive; higher values smooth it. |
| Oversold | 30.0 | 15.0 | 40.0 | RSI level that defines the oversold zone. The bullish failure swing forms around this threshold. |
| Overbought | 70.0 | 60.0 | 85.0 | RSI level that defines the overbought zone. The bearish failure swing forms around this threshold. |
| AtrPeriod | 14 | 5 | 30 | Number of bars used to calculate ATR, which drives stop-loss and take-profit distances. |
| SlAtrMult | 1.5 | 0.5 | 4.0 | Stop-loss distance as a multiple of ATR. Larger values give the trade more room but increase risk per trade. |
| TpAtrMult | 2.5 | 0.5 | 6.0 | Take-profit distance as a multiple of ATR. Together with SlAtrMult it sets the reward-to-risk ratio. |
| Lots | 0.10 | 0.01 | 1.0 | Fixed order volume (position size) submitted on each entry. |
With the default settings, the take-profit distance (2.5× ATR) is larger than the stop distance (1.5× ATR), giving a reward-to-risk ratio of roughly 1.67 to 1 before spread and slippage.
Recommended Chart Settings
This strategy is designed to run on a single timeframe selected at backtest time, applied to one symbol at a time. RSI failure swings are a general-purpose oscillator pattern, so the approach is not locked to a specific instrument — but liquid major forex pairs (for example EUR/USD) on intermediate intraday timeframes such as M15 to H1 are a sensible starting point for study, because they tend to produce cleaner oscillator structure than thin or highly news-driven markets.
You should treat any single configuration as a starting point only. Results will vary significantly across different symbols, timeframes, and market regimes. The same parameters that historically behaved well in a ranging environment may underperform in a strong, sustained trend. Always test on the specific instrument and timeframe you intend to study before drawing conclusions.
How to Install on MetaTrader 5
- Download the .ex5 file from the link below
- Copy it to your MT5
MQL5\Expertsfolder - Restart MetaTrader 5 or refresh the Navigator panel
- Drag the EA onto a chart matching the recommended symbol and timeframe
- Configure the input parameters and enable Algo Trading
What to Consider Before Using This EA
Strengths of the approach. The failure-swing pattern is meaningfully more selective than a plain RSI threshold cross. By demanding a higher low (or lower high) on the oscillator plus a break of the fail point, the strategy waits for the indicator to confirm a genuine shift in momentum structure before committing. This selectivity can reduce the number of premature counter-trend entries. The ATR-based stop and target are another strength: they keep risk proportional to current volatility rather than using a fixed pip distance that may be far too tight or too loose as conditions change.
Known limitations. Like all RSI-based reversal logic, this is fundamentally a counter-trend method, and counter-trend strategies are vulnerable in strong, persistent trends. During a powerful directional move, RSI can remain "oversold" or "overbought" for a long time, and a higher-low signal may simply mark a pause before the trend resumes against the position. Because the pattern requires several stages to complete, signals can be relatively infrequent, which means fewer learning samples in a given period. The strategy also uses a fixed lot size and a single position per side, so it does not scale exposure to account equity on its own.
Where it may underperform. Choppy, low-volatility chop with no follow-through can trigger the pattern and then immediately stall, while sharp trending breakouts can run straight through the ATR stop. News spikes that gap past the stop level are another well-known hazard for any reversal system. None of this makes the approach invalid — it simply means the pattern is best understood as one tool with specific blind spots, to be studied and tested rather than relied upon blindly.
Risk Management Tips
Sound risk management matters far more than any single entry signal. As a general educational guideline, many traders aim to risk no more than 1–2% of account equity on any one trade, and they size positions accordingly rather than using a fixed lot for every account — the default Lots value here is a placeholder you should adjust to your own situation.
A few principles worth internalizing:
- Always test on a demo account first. Run the strategy on historical data and in live-simulated demo conditions before risking any real capital, so you can observe how it behaves across different market regimes.
- Understand drawdown. Even a well-built strategy will experience losing streaks. Know the worst peak-to-trough decline you can tolerate emotionally and financially before you begin.
- Account for costs. Spread, commission, and slippage erode results, especially on shorter timeframes. Make sure your testing reflects realistic trading costs.
- Never risk money you cannot afford to lose, and avoid over-leveraging, which can magnify both gains and losses.
Risk management is the part of trading you control directly. A modest, consistent approach to position sizing and loss limits will protect your capital far better than chasing any individual setup.
Risk Warning
Trading foreign exchange, CFDs, and other leveraged financial instruments involves substantial risk of loss and is not suitable for all investors. The strategies and tools discussed on this page are provided for educational purposes only and do not constitute financial advice, investment recommendations, or solicitation to trade. Always consult a qualified financial adviser before making trading decisions. Past backtest performance is not indicative of future results.
Downloads
- Expert Advisor: RSIFailureSwing.ex5 (71 downloads)
- Source Code: RSIFailureSwing.mq5 (57 downloads)
- Documentation: RSIFailureSwing.pdf (61 downloads)