Disclaimer: This article is for educational and informational purposes only. It does not constitute financial or investment advice. Trading forex and CFDs carries significant risk of loss. Past performance of any strategy — including backtests — does not guarantee future results. Never trade with money you cannot afford to lose.
What Is This Strategy?
The Rsi Divergence Reversal is a mean-reversion trading strategy built around RSI divergence — a momentum signal derived from the Relative Strength Index (RSI), an oscillator that measures the speed and magnitude of recent price changes on a scale of 0 to 100. Rather than chasing trends, this strategy is a counter-trend (reversal) system: it looks for moments when price is still pushing to a new extreme while momentum is quietly fading, a condition that historically can precede a turn.
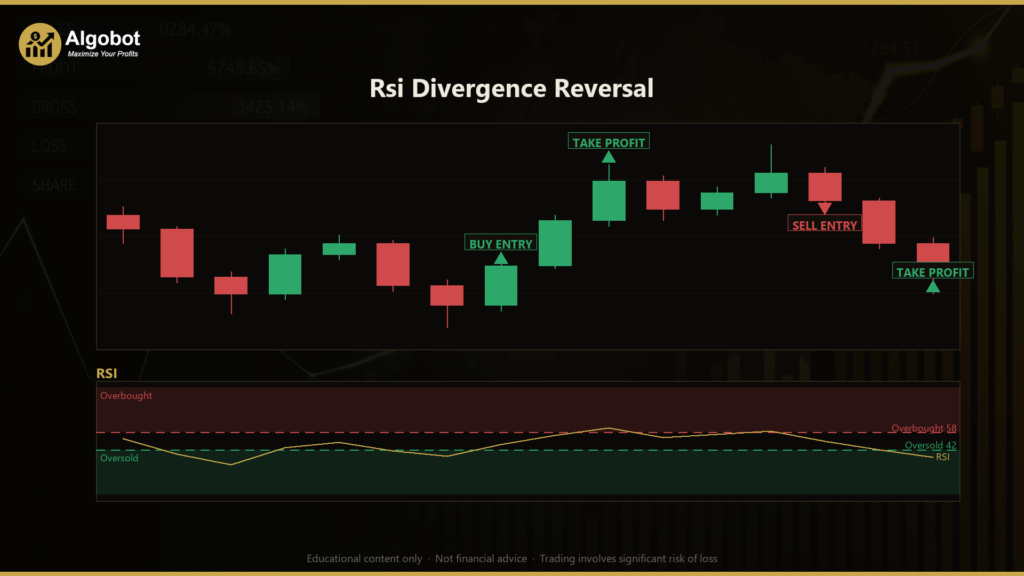
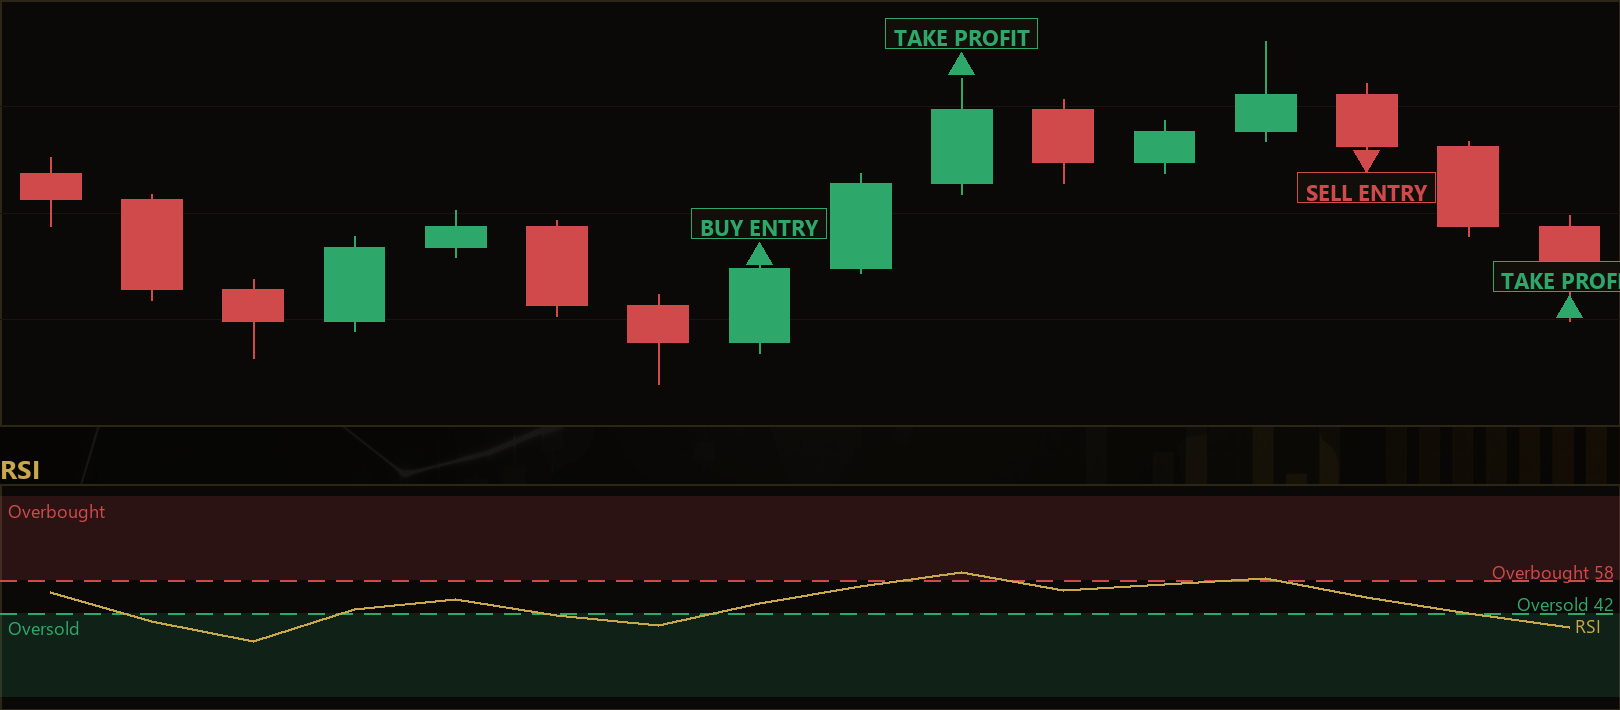
In plain terms, "divergence" means price and the indicator disagree. When price carves a lower low but RSI carves a higher low, the selling pressure behind the move may be weakening even though price has not yet confirmed it — this is classic bullish regular divergence. The mirror image, where price prints a higher high but RSI prints a lower high, is bearish regular divergence. The Rsi Divergence Reversal automates the detection of these patterns and pairs them with an oversold or overbought confirmation so the signal only triggers near a momentum extreme.
This strategy is best suited to traders who want to study how oscillator divergence and confirmed swing structure work together. It is designed for ranging or exhausted markets where swings tend to revert rather than extend, and it is most valuable as a learning tool for understanding pivot detection, ATR-based risk placement, and fixed reward-to-risk targeting. It is not a "set and forget" money machine, and it should be approached as an educational study of a well-defined reversal concept.
How It Works
The strategy processes one signal per completed bar and only acts when no position is already open, letting the stop-loss and take-profit manage each trade to completion. Its logic rests on confirmed swing pivots — points that are the strict lowest (or highest) value within a symmetric window of bars on either side. Because a pivot is only recognized once the bars after it have formed, the divergence reading is locked in and does not "repaint."
Here is how the strategy generates its signals:
- Detecting swing points: A swing low is confirmed when a bar's low is the lowest within a symmetric
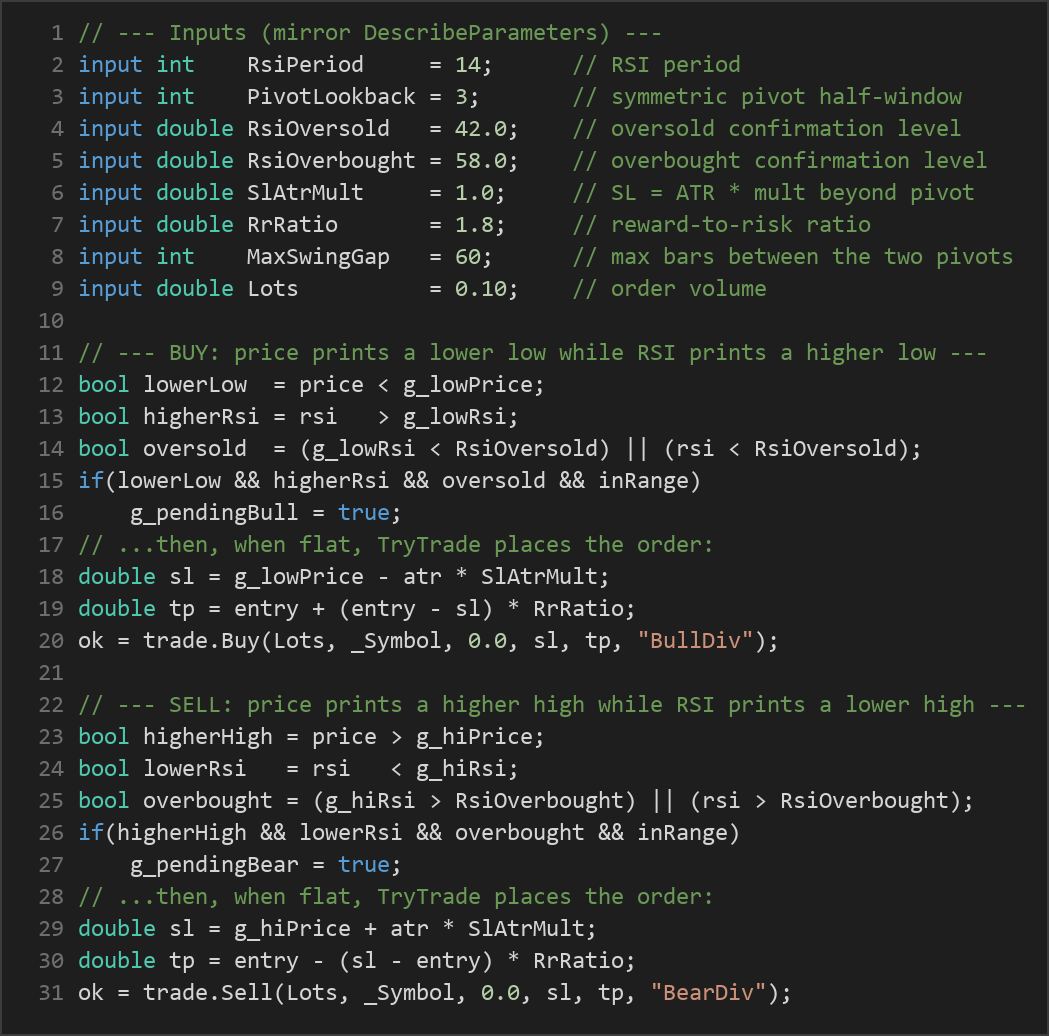
PivotLookbackwindow (bars on both sides). A swing high is confirmed the same way using the highest high. The signal only fires after this pivot is locked in. - Bullish (buy) signal: The strategy signals a long setup when price prints a lower swing low than the previous swing low, while RSI prints a higher swing low — the bullish divergence. At least one of the two swing lows must have formed below the
RsiOversoldlevel, and the two pivots must be no more thanMaxSwingGapbars apart. - Bearish (sell) signal: The strategy signals a short setup when price prints a higher swing high than the previous swing high, while RSI prints a lower swing high — the bearish divergence. At least one of the two swing highs must have formed above the
RsiOverboughtlevel, again within theMaxSwingGapwindow. - Stop-loss logic: Risk is anchored to volatility using the Average True Range (ATR), an indicator that measures typical bar-to-bar range. For a buy, the stop is placed below the confirmed swing low by
SlAtrMult× ATR; for a sell, it is placed above the swing high by the same distance. This keeps the stop beyond the pivot that justified the trade. - Take-profit logic: The target is a fixed multiple of the measured risk. The distance from entry to stop is multiplied by
RrRatioand projected in the direction of the trade, so a 1.8 ratio aims for 1.8 units of reward for every 1 unit risked. - One trade at a time: While a position is open, no new signal is acted upon. The trade exits only when price reaches the stop-loss or the take-profit.
This structure means the strategy may indicate a reversal early — at the point momentum diverges — while keeping every entry tied to an objective, repeatable pivot rather than a subjective read of the chart.
Strategy Parameters
| Parameter | Default | Min | Max | Description |
|---|---|---|---|---|
| RsiPeriod | 14 | 5 | 30 | Number of bars used to calculate the RSI momentum oscillator. |
| PivotLookback | 3 | 2 | 8 | Half-width of the symmetric window used to confirm a swing pivot (bars required on each side). |
| RsiOversold | 42.0 | 20.0 | 50.0 | RSI level marking the oversold zone; a bullish setup needs one swing low below this. |
| RsiOverbought | 58.0 | 50.0 | 80.0 | RSI level marking the overbought zone; a bearish setup needs one swing high above this. |
| AtrPeriod | 14 | 5 | 30 | Number of bars used to calculate ATR, which anchors the stop-loss distance. |
| SlAtrMult | 1.0 | 0.2 | 3.0 | Multiplier applied to ATR to set how far beyond the pivot the stop-loss sits. |
| RrRatio | 1.8 | 1.0 | 4.0 | Reward-to-risk ratio used to project the take-profit from the measured risk. |
| MaxSwingGap | 60 | 10 | 200 | Maximum number of bars allowed between the two pivots that form a divergence. |
| Lots | 0.10 | 0.01 | 1.0 | Order volume in lots for each trade. |
Recommended Chart Settings
This strategy was designed as a general-purpose reversal study and works on any symbol your broker offers, but it tends to be most coherent on liquid instruments such as major forex pairs (for example EUR/USD or GBP/USD) where swing structure is clean and spreads are tight. Intraday and swing timeframes such as M15, H1, and H4 give the pivot window enough bars to confirm meaningful swings without reacting to every tick of noise.
The default parameters (RSI 14, pivot lookback 3, ATR 14) are a balanced starting point rather than an optimized configuration. Because reversal signals behave very differently in trending versus ranging conditions, results will vary considerably across symbols, timeframes, and market regimes. Always study the behavior on a chart before drawing conclusions, and remember that a setting that looks strong on one period may not hold up on another.
How to Install on MetaTrader 5
- Download the .ex5 file from the link below
- Copy it to your MT5
MQL5\Expertsfolder - Restart MetaTrader 5 or refresh the Navigator panel
- Drag the EA onto a chart matching the recommended symbol and timeframe
- Configure the input parameters and enable Algo Trading
What to Consider Before Using This EA
The strengths of this approach lie in its objectivity. Because pivots are confirmed fractals, the divergence is detected the same way every time, removing the guesswork that plagues manual divergence trading. Anchoring the stop to ATR means risk adapts to current volatility instead of using a fixed pip distance, and the fixed reward-to-risk target enforces a consistent payoff structure on every trade. The "act only when flat" rule keeps the strategy simple and avoids stacking correlated positions.
There are real limitations to understand. Divergence is a counter-trend signal, and strong trends can produce repeated divergences that never resolve into a reversal — price can keep making new extremes while the oscillator diverges for a long time. In such conditions the strategy may signal too early and absorb a series of stop-outs. Because it requires a confirmed pivot before acting, entries arrive after the pivot has formed, meaning part of the initial move may already be over. The strategy also trades one position at a time, so it can sit idle through long stretches with no qualifying setup, and a single fixed lot size makes no allowance for account growth or shrinkage. It tends to underperform in persistent, one-directional trends and performs more naturally in balanced, range-bound markets.
None of this makes the concept good or bad — it makes it a tool with a defined edge case. Understanding when a reversal model is in its element is as important as the model itself.
Risk Management Tips
Sound risk management matters far more than any single signal. Consider these general principles as you study this strategy:
- Risk a small, fixed fraction per trade. Many educational sources suggest risking no more than 1–2% of account equity on any single position so that a losing streak cannot do lasting damage.
- Size positions deliberately. The default
Lotsvalue is a placeholder. Translate your chosen risk percentage and the strategy's ATR-based stop distance into an appropriate lot size for your account, rather than using a fixed lot blindly. - Always test on a demo account first. Run the strategy on a demo or in the MT5 Strategy Tester across multiple market conditions before considering any live use.
- Understand drawdown. Even a well-constructed reversal system will have losing periods. Know the largest peak-to-trough decline you could tolerate and confirm the strategy's behavior stays within it.
- Account for costs. Spreads, commissions, and slippage all eat into reversal trades, which often have modest individual moves. Factor them into any evaluation.
- Never trade money you cannot afford to lose, and treat this EA as a way to learn how divergence and risk placement interact — not as a substitute for your own judgment.
Risk Warning
Trading foreign exchange, CFDs, and other leveraged financial instruments involves substantial risk of loss and is not suitable for all investors. The strategies and tools discussed on this page are provided for educational purposes only and do not constitute financial advice, investment recommendations, or solicitation to trade. Always consult a qualified financial adviser before making trading decisions. Past backtest performance is not indicative of future results.
Downloads
- Expert Advisor: RsiDivergenceReversal.ex5 (65 downloads)
- Source Code: RsiDivergenceReversal.mq5 (57 downloads)
- Documentation: RsiDivergenceReversal.pdf (58 downloads)