Disclaimer: This article is for educational and informational purposes only. It does not constitute financial or investment advice. Trading forex and CFDs carries significant risk of loss. Past performance of any strategy — including backtests — does not guarantee future results. Never trade with money you cannot afford to lose.
What Is This Strategy?
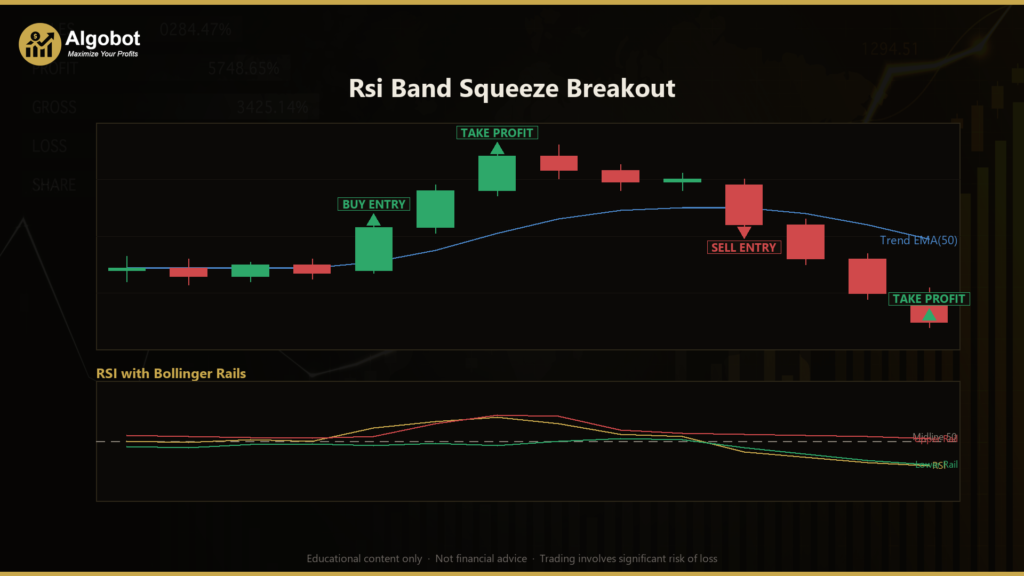
The Rsi Band Squeeze Breakout is a momentum-breakout strategy that takes a familiar tool — the Relative Strength Index (RSI), an oscillator that measures the speed and size of recent price moves on a 0–100 scale — and studies it from an unusual angle. Instead of asking the traditional question, "Is RSI overbought or oversold?", this strategy asks, "How volatile is momentum right now, and which way is it about to fire?" To do that, it wraps the RSI line in Bollinger Bands — a mean plus-or-minus a multiple of standard deviation — built entirely from the RSI's own recent readings. The distance between those two rails is the RSI "bandwidth," a direct measurement of how tightly momentum is currently coiled.
The core idea is a squeeze-and-release cycle. When RSI drifts sideways in a narrow range, its standard deviation collapses and the band pinches shut. This is a momentum squeeze — a period where the market is storing energy rather than spending it. When a genuine directional impulse finally arrives, the RSI's standard deviation flares, the band snaps open, and RSI punches through the expanding rail. The strategy treats that first thrust out of a squeeze as the highest-quality moment of momentum-regime change, and it aligns every entry with the prevailing price trend to filter out counter-trend noise.
As a learning tool, the Rsi Band Squeeze Breakout is well suited to traders who already understand basic RSI behavior and want to explore volatility-of-momentum concepts, breakout timing, and regime filtering. It is designed for liquid, trending instruments and is best viewed as a case study in how layering statistical filters onto a classic indicator can change the questions a system is able to ask — not as a shortcut to any particular outcome.
How It Works
The strategy processes one reading per closed bar on the primary timeframe and evaluates a chain of conditions before it will consider a trade. Each condition must pass in sequence:
- Build the RSI history. An RSI value is calculated for every closed bar using the
RsiPeriodsetting, producing a running momentum line. - Wrap RSI in Bollinger Bands. Over the last
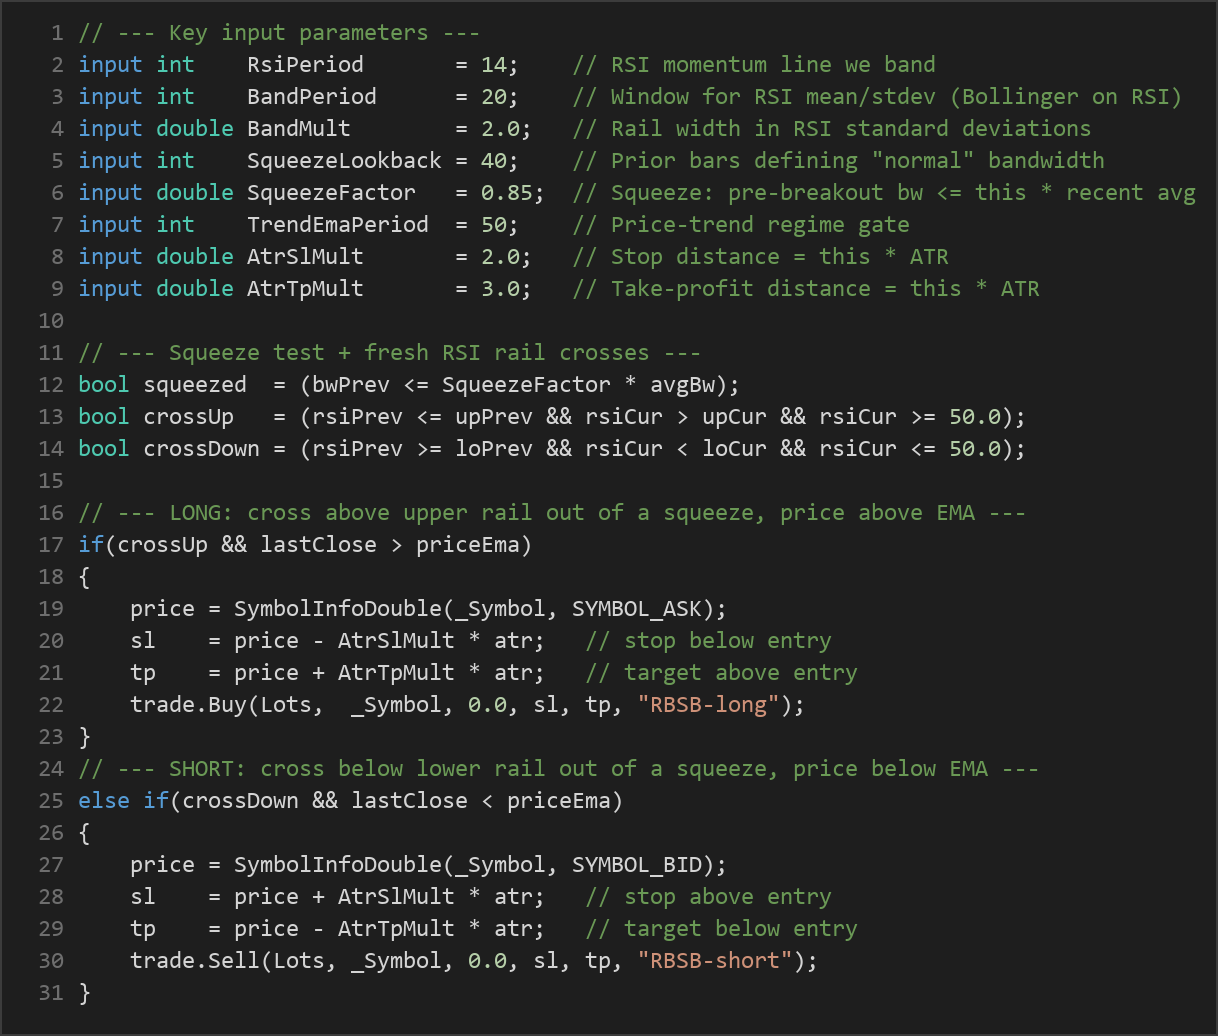
BandPeriodRSI values, the strategy computes the mean and population standard deviation, then sets the upper rail at mean +BandMult× stdev and the lower rail at mean −BandMult× stdev. The gap between them is the RSI bandwidth. - Confirm a squeeze. The pre-breakout bandwidth must be compressed — at or below
SqueezeFactortimes the average bandwidth measured over the priorSqueezeLookbackbars. This ensures the band was genuinely pinched before it expanded, so signals are ignored inside an already-wide, noisy band. - Apply the trend regime gate. A price Exponential Moving Average (EMA) of length
TrendEmaPeriodacts as a directional filter, so the strategy only takes a break that agrees with the prevailing price trend.
Once a squeeze is confirmed, the strategy watches for a fresh rail cross:
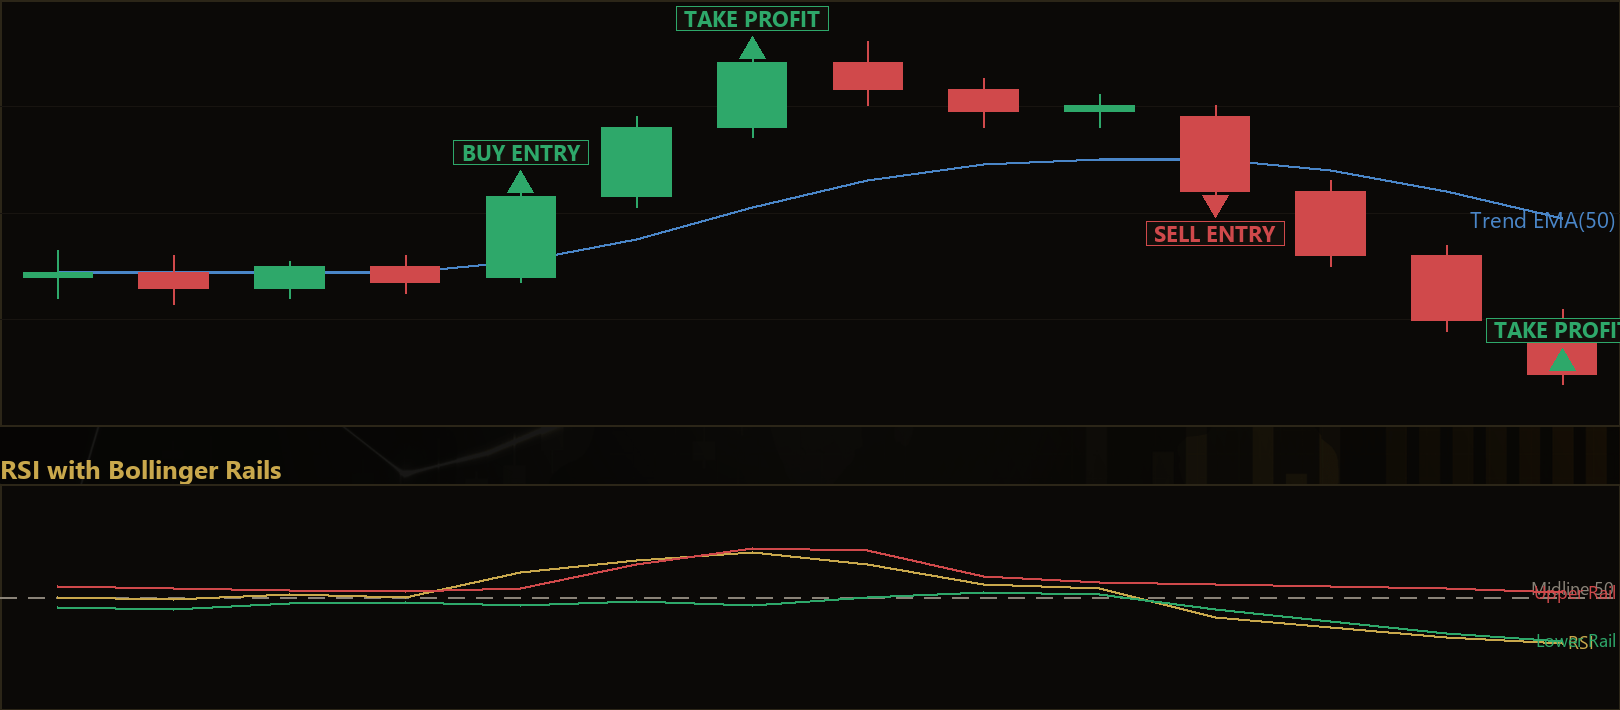
- Long signal: RSI freshly crosses above its upper rail (the prior RSI was at or below the prior upper rail, and the current RSI is now above the current upper rail), RSI sits on the bullish side at 50 or higher, and price is above its trend EMA.
- Short signal: RSI freshly crosses below its lower rail (the mirror image), RSI sits on the bearish side at 50 or lower, and price is below its trend EMA.
Exit, stop-loss, and take-profit logic are all driven by the Average True Range (ATR), a volatility measure, so the risk envelope self-scales to any symbol or timeframe:
- The stop-loss is placed at entry ∓
AtrSlMult× ATR. - The take-profit is placed at entry ±
AtrTpMult× ATR. - Only one position per magic number is held at a time; the ATR-based stop and target manage the exit rather than a separate signal.
- A spread gate skips any signal when the current spread (in points) exceeds
MaxSpreadPoints, avoiding entries during unusually wide, illiquid conditions.
Strategy Parameters
| Parameter | Default | Min | Max | Description |
|---|---|---|---|---|
| RsiPeriod | 14 | 7 | 28 | Smoothing period for the RSI momentum line that gets banded. |
| BandPeriod | 20 | 10 | 50 | Window of RSI values used to compute the mean and standard deviation for the Bollinger rails on RSI. |
| BandMult | 2.0 | 1.0 | 3.0 | Rail width in RSI standard deviations (the Bollinger k multiplier). |
| SqueezeLookback | 40 | 15 | 100 | Number of prior bars that define the "normal" RSI bandwidth for the squeeze test. |
| SqueezeFactor | 0.85 | 0.50 | 1.00 | Squeeze filter: pre-breakout bandwidth must be at or below this fraction of its recent average. |
| TrendEmaPeriod | 50 | 20 | 200 | Length of the price EMA used as the trend regime gate. |
| AtrPeriod | 14 | 7 | 28 | ATR period for the volatility-scaled stop and target. |
| AtrSlMult | 2.0 | 0.5 | 5.0 | Stop-loss distance as a multiple of ATR. |
| AtrTpMult | 3.0 | 0.5 | 6.0 | Take-profit distance as a multiple of ATR. |
| MaxSpreadPoints | 30 | 1 | 200 | Skip a signal if the current spread (in points) is wider than this. |
| Lots | 0.10 | 0.01 | 1.00 | Order volume in lots. |
| Magic | 6042 | 0 | 9,999,999 | Magic number used to identify and manage this EA's positions. |
Recommended Chart Settings
The Rsi Band Squeeze Breakout was designed with liquid, trending instruments in mind — for example EURUSD, GBPUSD, or XAUUSD (gold) — on the M15 to H1 timeframes. These markets tend to alternate between quiet consolidation and clean directional legs, which is exactly the squeeze-then-expansion rhythm the strategy is built to detect. The default parameters were chosen around this environment, but the ATR-based risk model means the logic will still scale mechanically to other symbols and timeframes. Keep in mind that behavior and results will vary considerably across different instruments, sessions, and market conditions, so any new symbol should be studied on its own before it is relied upon.
How to Install on MetaTrader 5
- Download the .ex5 file from the link below.
- Copy it to your MT5
MQL5\Expertsfolder. - Restart MetaTrader 5 or refresh the Navigator panel.
- Drag the EA onto a chart matching the recommended symbol and timeframe.
- Configure the input parameters and enable Algo Trading.
What to Consider Before Using This EA
The main strength of this approach is conceptual discipline. By measuring the volatility of momentum rather than just its level, the strategy tries to enter only when the market has run out of two-sided flow and a fresh directional impulse is beginning. The squeeze filter, the 50-level bias, and the price-EMA regime gate stack together to reject much of the mid-range chop that bleeds naive RSI systems dry, and the ATR-scaled stop and target keep risk proportional to current volatility.
There are important limitations to understand. Breakout systems, by nature, produce false starts: a band can expand, trigger an entry, and then fail as price snaps back into the prior range. The strategy takes only trend-aligned breaks, which helps, but it will still take losing trades during choppy or news-driven whipsaws. Because it waits for a genuine squeeze, signals can be infrequent — long quiet stretches are normal, and forcing more trades by loosening SqueezeFactor may reduce signal quality. In strongly ranging or erratic markets, or on illiquid symbols with wide spreads, the edge the strategy is trying to exploit may simply not be present. Treat it as a framework to study and stress-test, not as a finished, hands-off system.
Risk Management Tips
Sound risk management matters far more than any single indicator setting. Consider these general principles as part of your education:
- Position sizing: Size each trade so that a stop-out costs only a small, predefined fraction of your account. A common educational guideline is to risk no more than 1–2% of your capital on any single trade.
- Test on demo first: Run the EA on a demo account across varied market conditions before committing real capital, so you understand its trade frequency and drawdown behavior.
- Understand drawdown: Even a well-designed strategy will experience losing streaks. Know the depth and duration of drawdown you are willing to tolerate before you begin.
- Respect the spread and session: The built-in spread gate helps, but you should still be mindful of high-impact news and thin liquidity periods where slippage can widen.
- Never over-leverage: Larger lot sizes amplify both gains and losses; keep leverage conservative while you are learning how the strategy behaves.
Risk Warning
Trading foreign exchange, CFDs, and other leveraged financial instruments involves substantial risk of loss and is not suitable for all investors. The strategies and tools discussed on this page are provided for educational purposes only and do not constitute financial advice, investment recommendations, or solicitation to trade. Always consult a qualified financial adviser before making trading decisions. Past backtest performance is not indicative of future results.
Downloads
- Expert Advisor: RsiBandSqueezeBreakout.ex5 (45 downloads)
- Source Code: RsiBandSqueezeBreakout.mq5 (49 downloads)
- Documentation: RsiBandSqueezeBreakout.pdf (49 downloads)