Disclaimer: This article is for educational and informational purposes only. It does not constitute financial or investment advice. Trading forex and CFDs carries significant risk of loss. Past performance of any strategy — including backtests — does not guarantee future results. Never trade with money you cannot afford to lose.
What Is This Strategy?
The Rogers Satchell Trend Rider is a drift-independent, volatility-normalized momentum strategy built around the Rogers-Satchell volatility estimator — a way of measuring how much a market fluctuates using only the open, high, low, and close of each bar. Unlike close-to-close standard deviation or the Average True Range (ATR), the Rogers-Satchell estimator is designed to be drift-independent: it gauges the "noise" inside each candle without getting inflated simply because price is trending steadily in one direction. This makes it a trend-following strategy with an unusually clean way of asking, "is this move really larger than random?"
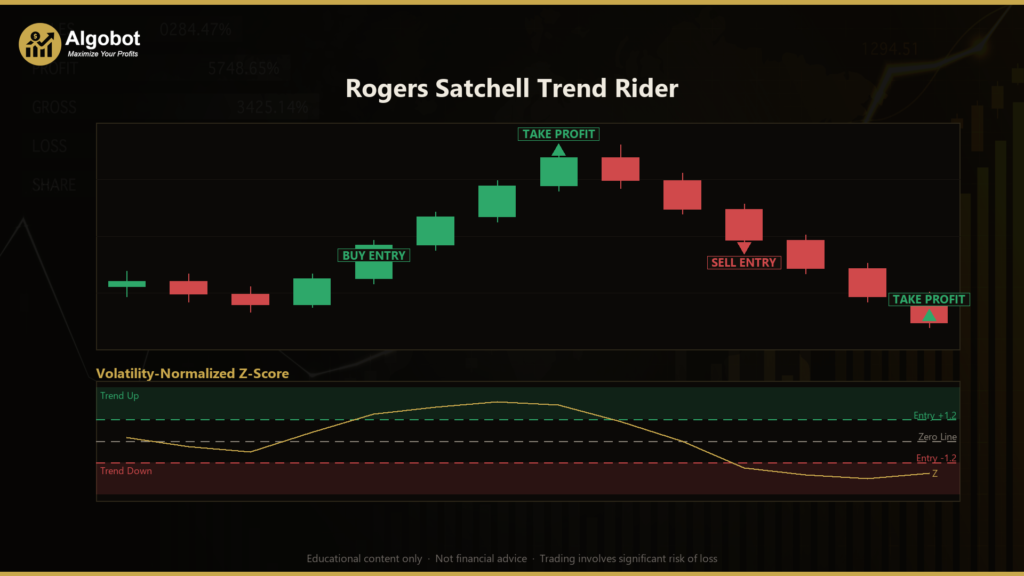
The core idea addresses a subtle problem in technical analysis. Most volatility yardsticks swell during a strong, one-way trend, even when the path of price is smooth. When you divide a trend's displacement by such an inflated yardstick, the trend signal gets damped exactly when you would want it loudest. The Rogers Satchell Trend Rider sidesteps this by measuring per-bar noise purely from intrabar geometry, then comparing a multi-bar price move against that noise floor. The result is a z-score — labelled Z — that behaves like "how many standard deviations of drift-free noise is this move." A random walk keeps the absolute value of Z near 1, while a genuine trend pushes it well beyond that and keeps it there.
As a learning tool, this strategy suits traders who already understand basic candlestick and indicator concepts and want to explore a more statistically-grounded approach to momentum. It is designed for trending market conditions on a single timeframe, and it is best treated as a study in how volatility normalization can sharpen trend detection — not as a shortcut to returns. If you are curious about the reasoning behind volatility estimators and z-score filters, this EA is a compact, well-documented example to analyze on a demo account.
How It Works
The strategy processes one completed bar at a time and computes a fresh Z value on each new bar. Every trading decision flows from that value. Here is the logic in plain English:
- Measuring drift-free volatility: For each of the most recent
VolPeriodbars, the strategy calculates the Rogers-Satchell figureln(H/C)·ln(H/O) + ln(L/C)·ln(L/O), which is always zero or positive. Averaging these and taking the square root givessigmaBar— an estimate of the typical log-return noise per bar that does not inflate just because price is drifting. - Building the normalized momentum (Z): The strategy takes the log return of the close now versus the close
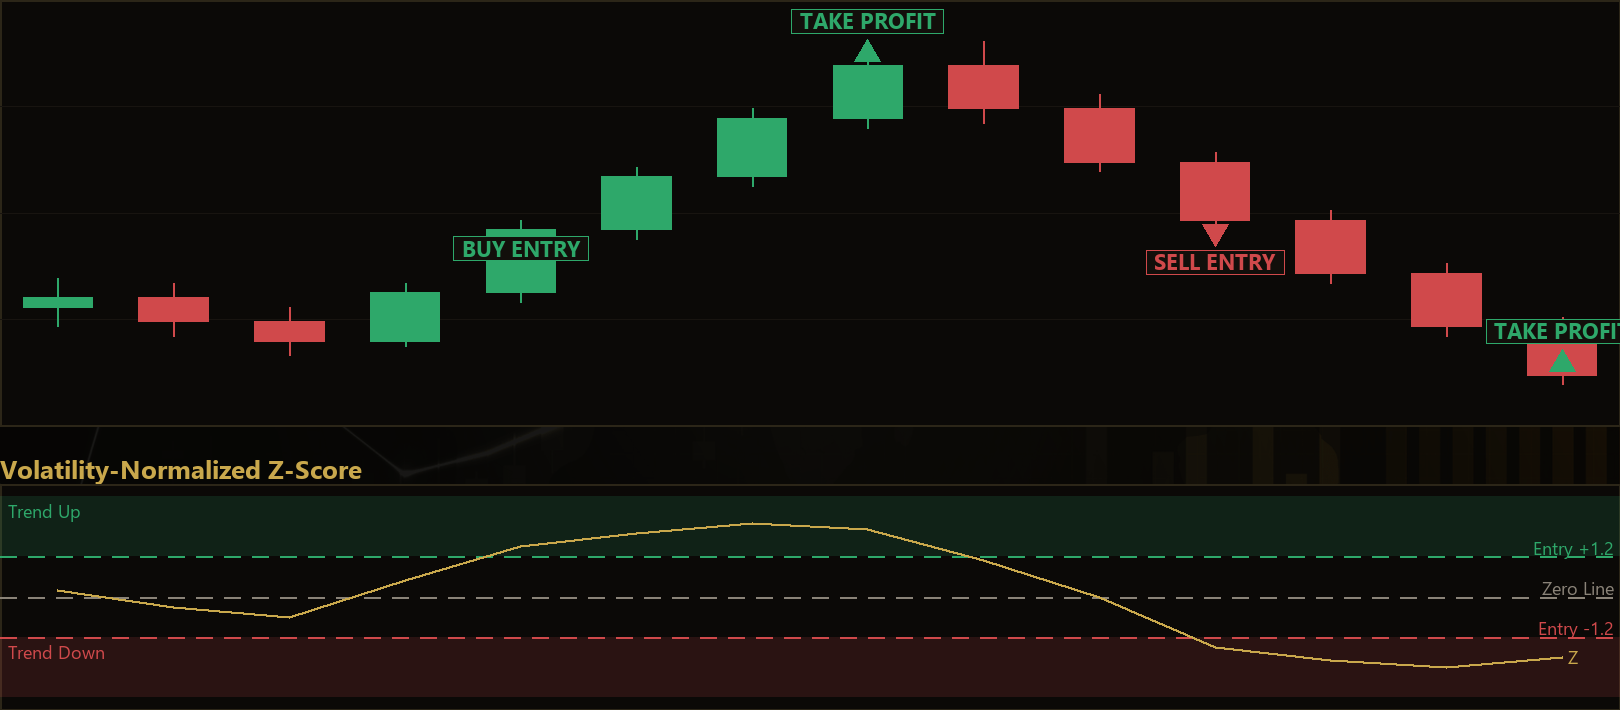
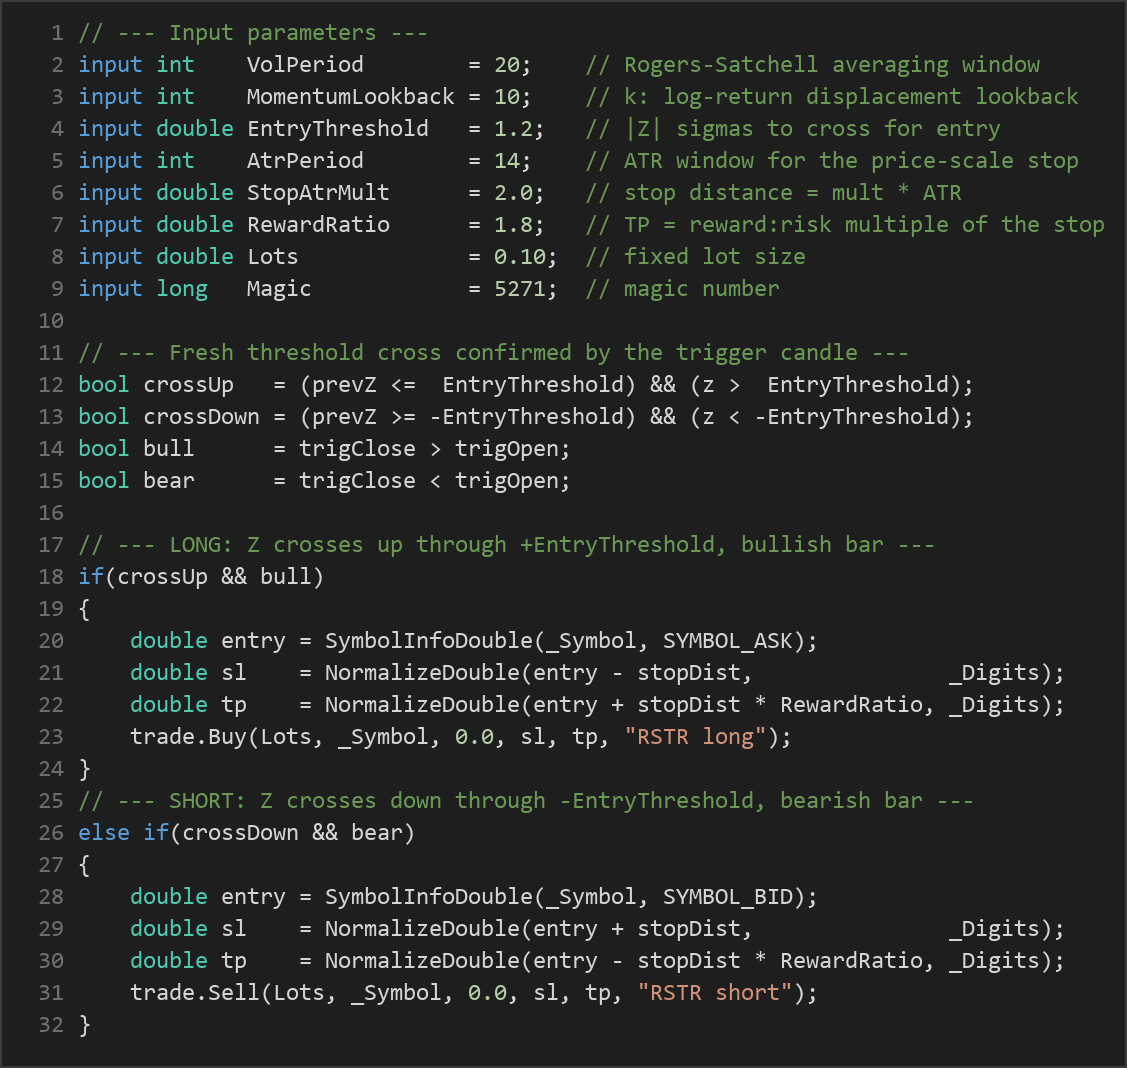
MomentumLookbackbars ago, then divides it bysigmaBar × √(MomentumLookback). This produces Z, a volatility-normalized measure of the recent move relative to drift-free noise. - Long entry signal: The strategy signals a long when Z crosses up through
+EntryThreshold(a fresh cross, not a level that was already exceeded) and the trigger bar closes bullish (close above open). This indicates the upward move is significantly larger than drift-free noise. - Short entry signal: The strategy signals a short when Z crosses down through
−EntryThresholdand the trigger bar closes bearish (close below open). - Fade exit (trend dissipation): While a position is open, the strategy closes it when Z crosses back through zero in the opposite direction — a long is faded when Z turns negative, a short when Z turns positive. This may indicate the volatility-normalized trend has dissipated.
- Stop-loss logic: Each trade uses an ATR-based stop set at
StopAtrMult × ATRaway from the entry price. Because it is measured in price units, the stop adapts to the instrument's current price-scale volatility. - Take-profit logic: The target is placed at a reward-to-risk multiple of the stop distance, defined by
RewardRatio. With the default 1.8, the target sits 1.8 times as far from entry as the stop. - One position per magic number: The strategy holds only a single position at a time and never opens a new trade on the same bar it manages an existing one.
Strategy Parameters
| Parameter | Default | Min | Max | Description |
|---|---|---|---|---|
| VolPeriod | 20 | 8 | 60 | Number of bars used to average the Rogers-Satchell estimator into per-bar noise (sigmaBar). |
| MomentumLookback | 10 | 3 | 40 | Lookback k for the log-return displacement that gets volatility-normalized into Z. |
| EntryThreshold | 1.2 | 0.5 | 3.0 | How many drift-free sigmas the absolute value of Z must cross to trigger an entry. |
| AtrPeriod | 14 | 5 | 40 | ATR window used to size the price-scale stop distance. |
| StopAtrMult | 2.0 | 0.5 | 5.0 | Stop distance as a multiple of ATR. |
| RewardRatio | 1.8 | 0.5 | 5.0 | Take-profit distance as a reward-to-risk multiple of the stop distance. |
| Lots | 0.10 | 0.01 | 1.0 | Fixed lot size used for each trade. |
Recommended Chart Settings
The Rogers Satchell Trend Rider runs on a single timeframe — whichever timeframe you attach it to at backtest or trading time becomes the timeframe for every calculation. Because volatility normalization tends to be most meaningful where trends have room to develop and per-bar noise is well-populated, many traders study strategies of this type on major forex pairs (for example EUR/USD) using an H1 (1-hour) or H4 (4-hour) chart as a starting point for analysis.
There is no universally "correct" symbol or timeframe. The behavior of the Z score, the fade-at-zero exits, and the ATR stops will all shift as you move between instruments and timeframes. Treat the defaults as a baseline for exploration, and remember that results will vary considerably across different market conditions and across different assets.
How to Install on MetaTrader 5
- Download the .ex5 file from the link below
- Copy it to your MT5
MQL5\Expertsfolder - Restart MetaTrader 5 or refresh the Navigator panel
- Drag the EA onto a chart matching the recommended symbol and timeframe
- Configure the input parameters and enable Algo Trading
What to Consider Before Using This EA
The distinctive strength of this approach is its volatility normalization. By using a drift-independent estimator, the strategy avoids a common pitfall where a smooth, powerful trend paradoxically produces a weaker signal. In principle, Z stays elevated for as long as the move genuinely outpaces noise, which can help the strategy stay engaged with a trend rather than exiting prematurely. The distinct long and short logic and the explicit fade-at-zero exit also make the strategy's intentions easy to reason about and audit.
That said, there are real limitations to weigh. Like all trend-following systems, this one is designed for trending conditions and can struggle in choppy, range-bound, or sideways markets, where Z may oscillate across the entry threshold and produce whipsaw trades that are stopped out or faded quickly. The Rogers-Satchell estimator assumes reasonably clean OHLC data; on illiquid instruments, during thin sessions, or around large gaps, the intrabar geometry it relies on may be less reliable. The fixed reward-to-risk target and ATR stop are simple by design and do not include trailing logic, so a strong move that reverses before reaching the target may give back open profit. Finally, the fade-at-zero rule can exit a trade during a temporary pullback that later resumes, which is the natural trade-off of a responsive exit.
None of these points make the strategy good or bad in isolation — they are the characteristics you should test, observe, and understand for yourself. The most valuable use of this EA is as a case study in how a statistically-motivated filter behaves across varied market regimes.
Risk Management Tips
Sound risk management matters far more than any single indicator or entry rule. Keep these general principles in mind as you study this strategy:
- Risk a small, fixed fraction per trade. Many educational sources suggest risking no more than 1–2% of account equity on any single position. Size your
Lotsaccordingly rather than using a large fixed lot on a small account. - Understand your stop before you trade. The ATR-based stop means your risk in price terms changes with volatility. Know how far the stop sits and what that represents in your account currency.
- Test on a demo account first. Run the strategy in a demo environment across different symbols, timeframes, and market conditions before ever considering real capital. This is where you learn how the Z score and fade exits actually behave.
- Expect and plan for drawdown. Every strategy experiences losing streaks. Study the depth and duration of drawdown in your own testing so you understand what a normal rough patch looks like — and so it does not surprise you.
- Avoid over-optimization. Tuning parameters until a backtest looks flawless often produces a curve-fit that fails on new data. Prefer robust settings that behave sensibly across a range of values.
- Never risk money you cannot afford to lose. Leverage magnifies both gains and losses; treat capital preservation as the first priority.
Risk Warning
Trading foreign exchange, CFDs, and other leveraged financial instruments involves substantial risk of loss and is not suitable for all investors. The strategies and tools discussed on this page are provided for educational purposes only and do not constitute financial advice, investment recommendations, or solicitation to trade. Always consult a qualified financial adviser before making trading decisions. Past backtest performance is not indicative of future results.
Downloads
- Expert Advisor: RogersSatchellTrendRider.ex5 (51 downloads)
- Source Code: RogersSatchellTrendRider.mq5 (50 downloads)
- Documentation: RogersSatchellTrendRider.pdf (52 downloads)