
Disclaimer: This article is for educational and informational purposes only. It does not constitute financial or investment advice. Trading forex and CFDs carries significant risk of loss. Past performance of any strategy — including backtests — does not guarantee future results. Never trade with money you cannot afford to lose.
What Is This Strategy?
The Relative Volatility Index Breakout is a trend-following momentum strategy built around Donald Dorsey's Relative Volatility Index (RVI), an oscillator first published in 1993 and refined in 1995. What makes the RVI unusual is what it measures. Most oscillators you have seen — the Relative Strength Index (RSI), the stochastic, and similar tools — measure the direction of price. The RVI instead measures the direction of volatility: whether a market's range is expanding more on up-days or more on down-days. Two symbols can share an identical RSI while one is quietly widening its range to the upside and the other to the downside. The RVI is designed to tell those two situations apart.
That distinction is the core idea this strategy tries to exploit. Rather than entering simply because price ticked higher, the Relative Volatility Index Breakout waits until the range is demonstrably expanding in the trade's direction — the market is not just drifting, it is committing energy one way. The RVI oscillates between 0 and 100 around a 50 midline. A reading above 50 suggests volatility is expanding on up moves (bullish volatility); below 50 suggests it is expanding on down moves (bearish volatility).
As a learning tool, this strategy suits intermediate traders who already understand oscillators and want to study a less conventional signal source. It is framed here as a strategy analysis, not a profit opportunity. It is best examined on liquid, trending instruments — the code's default playground is a liquid trender such as XAUUSD (gold) or EURUSD on the M15 or H1 timeframe — where volatility-direction signals have room to develop into sustained moves.
How It Works
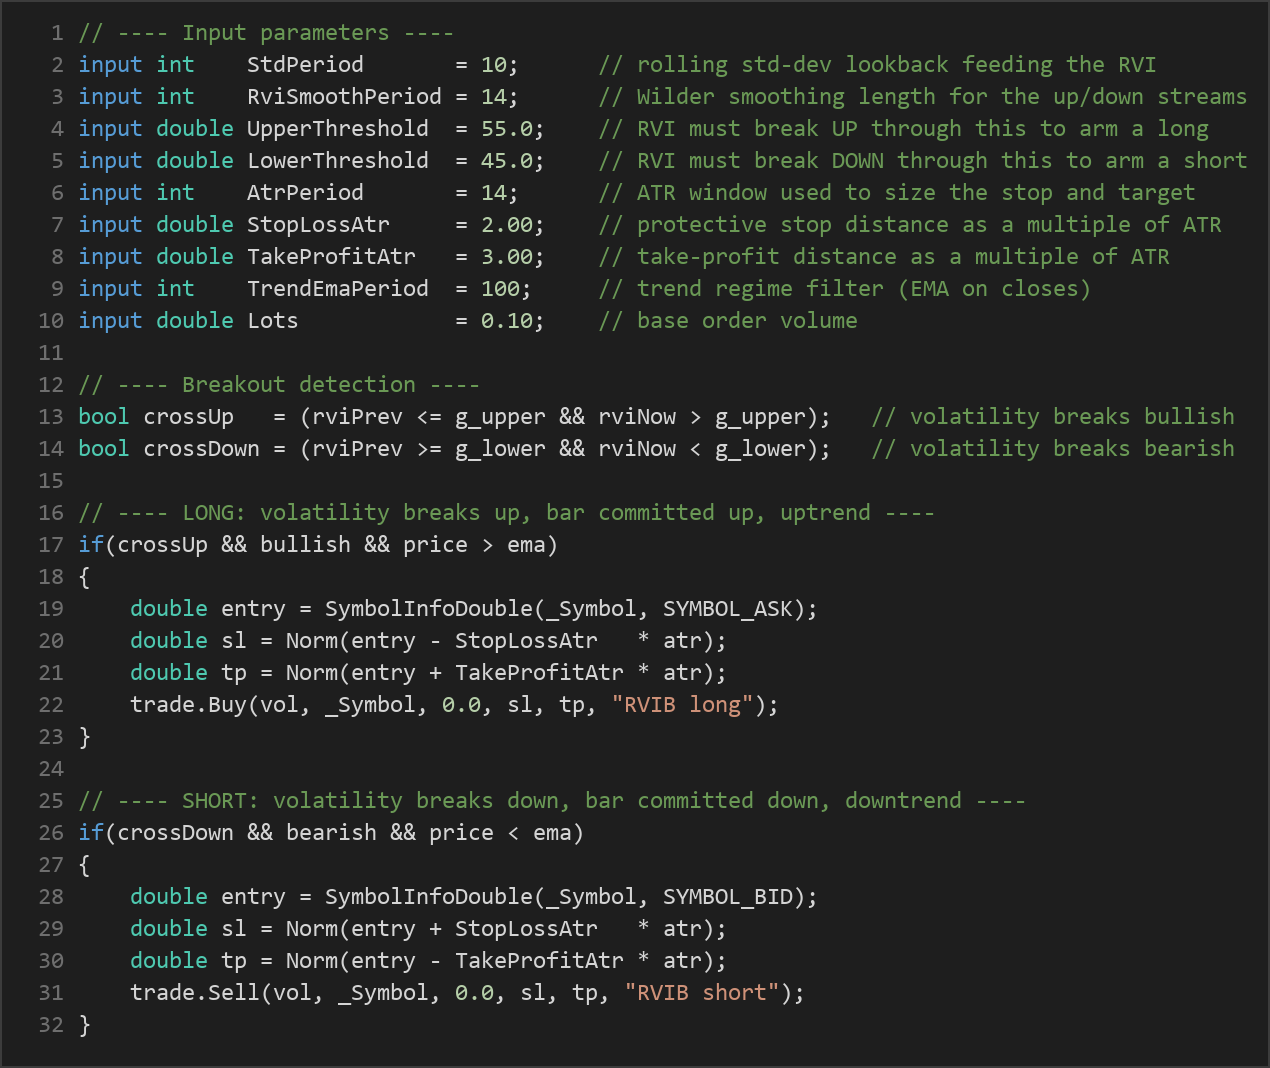
The strategy computes a "refined" RVI by averaging the RVI calculated on bar highs with the RVI calculated on bar lows. Rather than trading a naive cross of the 50 midline — which tends to whipsaw in flat, directionless markets — it uses a hysteresis breakout: the RVI must punch clean through a band placed above and below the midline before any trade is armed. Between the two bands, nothing fires.
The strategy signals a long entry when all of the following align on a newly closed bar:
- The RVI crosses up through the
UpperThreshold(default 55), meaning volatility has turned demonstrably bullish. - The signal bar closes bullish (close above open) — confirming that price actually committed, and the reading is not just a volatility artefact.
- The closing price is above the trend EMA (
TrendEmaPeriod) — a slow moving-average regime filter that keeps entries aligned with the prevailing drift.
The strategy signals a short entry under the mirror-image conditions:
- The RVI crosses down through the
LowerThreshold(default 45), meaning volatility has turned demonstrably bearish. - The signal bar closes bearish (close below open).
- The closing price is below the trend EMA.
Exit logic works on two independent levels:
- Early volatility-flip exit: If a position is open and the RVI recrosses the 50 midline against the trade (dropping below 50 for a long, or rising above 50 for a short), the strategy flattens the position early. The volatility that justified the trade has flipped, so it stops paying to hold the position.
- ATR stop-loss: Every entry receives a protective stop placed at
StopLossAtrmultiples of the Average True Range (ATR) away from entry. Because ATR scales with each market's own volatility, the stop distance self-adjusts across symbols and timeframes. - ATR take-profit: Each entry also receives a target at
TakeProfitAtrmultiples of ATR. With the defaults (2.0 ATR stop, 3.0 ATR target), the reward-to-risk ratio is fixed at roughly 1.5-to-1 and self-scaling.
A few housekeeping rules round out the system: only one position is allowed per magic number (no pyramiding), trades are skipped when the spread is wider than MaxSpreadPoints, and order volume is normalised to the symbol's lot step and min/max limits.

Strategy Parameters
| Parameter | Default | Min | Max | Description |
|---|---|---|---|---|
| StdPeriod | 10 | 5 | 30 | Lookback for the rolling standard deviation that feeds the RVI. |
| RviSmoothPeriod | 14 | 5 | 40 | Wilder smoothing length applied to the up/down volatility streams. |
| UpperThreshold | 55.0 | 50.0 | 75.0 | RVI must break up through this level to arm a long (volatility turning bullish). |
| LowerThreshold | 45.0 | 25.0 | 50.0 | RVI must break down through this level to arm a short (volatility turning bearish). |
| AtrPeriod | 14 | 7 | 30 | ATR window used to size the stop and target. |
| StopLossAtr | 2.00 | 0.50 | 5.00 | Protective stop distance as a multiple of ATR. |
| TakeProfitAtr | 3.00 | 0.50 | 8.00 | Take-profit distance as a multiple of ATR. |
| TrendEmaPeriod | 100 | 20 | 250 | Trend regime filter: only trade breakouts that agree with this EMA on closes. |
| MaxSpreadPoints | 30 | 1 | 200 | Skip the trade if the current spread (points) is wider than this. |
| Lots | 0.10 | 0.01 | 1.00 | Base order volume (normalised to the symbol's lot step and limits). |
| Magic | 7412 | 0 | 9,999,999 | Magic number identifying this EA's positions. |
Recommended Chart Settings
This strategy was designed for a liquid, trending instrument such as XAUUSD (gold) or EURUSD, on the M15 or H1 timeframe. These markets tend to offer the sustained directional moves that a volatility-direction momentum system is built to capture, along with tight spreads that keep the MaxSpreadPoints filter from rejecting too many otherwise-valid signals.
Keep in mind that results will vary significantly across different symbols, timeframes, and market conditions. A parameter set that behaves well on gold during a trending period may behave very differently on a ranging currency pair or during a low-volatility session. Any timeframe or symbol change should be studied carefully in the Strategy Tester before it is considered further.
How to Install on MetaTrader 5
- Download the .ex5 file from the link below.
- Copy it to your MT5
MQL5\Expertsfolder. - Restart MetaTrader 5 or refresh the Navigator panel.
- Drag the EA onto a chart matching the recommended symbol and timeframe.
- Configure the input parameters and enable Algo Trading.
What to Consider Before Using This EA
The most interesting strength of this approach is its signal source. Because the RVI measures volatility direction rather than price direction, it can flag momentum that a conventional oscillator would miss or misread. Layering three independent filters — the RVI breakout, the committed-close confirmation, and the trend-EMA regime check — is a deliberate attempt to keep the system out of the mid-range chop that erodes most single-oscillator strategies. The ATR-based stop and target, plus the early volatility-flip exit, give the risk framework a consistent, self-scaling structure.
There are real limitations to weigh honestly, however. Volatility-based signals can lag: by the time the range is demonstrably expanding, a meaningful portion of the move may already be behind you. In choppy, range-bound conditions, the RVI can flip back and forth across the bands, and even with the confirmation filters some whipsaw entries are unavoidable. The trend-EMA filter helps the strategy join the prevailing drift, but during sharp reversals that same filter can keep it aligned with a trend that has already ended, producing losing trades near turning points. Fixed ATR multiples for the stop and target also mean the strategy does not adapt its exits to changing structure once a trade is live — beyond the midline-flip exit, it simply waits for one of the two ATR levels to be hit.
Like any oscillator system, this strategy tends to underperform in low-volatility, sideways markets and during news-driven spikes that gap through stops. Treat it as a framework to study and stress-test, not a finished product to deploy unattended.
Risk Management Tips
Sound risk management matters far more than any single indicator setting. Consider the following general principles as you study this or any strategy:
- Risk a small, fixed fraction per trade. Many educational sources suggest risking no more than 1–2% of account equity on any single position. Size your
Lotsso that the ATR-based stop distance stays within that limit. - Test on a demo account first. Run the EA on a demo or in the MT5 Strategy Tester across varied market conditions before considering real capital. This helps you understand how it behaves in trends, ranges, and volatile spikes.
- Understand drawdown. Every strategy experiences losing streaks. Know the maximum peak-to-trough decline you would tolerate, and study how the strategy's historical drawdown compares before committing.
- Account for costs. Spread, commission, and slippage all eat into results. The
MaxSpreadPointsfilter helps, but real-world execution on volatile instruments can still differ from backtests. - Never risk money you cannot afford to lose, and avoid over-leveraging your account.
Risk Warning
Trading foreign exchange, CFDs, and other leveraged financial instruments involves substantial risk of loss and is not suitable for all investors. The strategies and tools discussed on this page are provided for educational purposes only and do not constitute financial advice, investment recommendations, or solicitation to trade. Always consult a qualified financial adviser before making trading decisions. Past backtest performance is not indicative of future results.
Downloads
- Expert Advisor: RelativeVolatilityIndexBreakout.ex5 (46 downloads)
- Source Code: RelativeVolatilityIndexBreakout.mq5 (47 downloads)
- Documentation: RelativeVolatilityIndexBreakout.pdf (52 downloads)