Disclaimer: This article is for educational and informational purposes only. It does not constitute financial or investment advice. Trading forex and CFDs carries significant risk of loss. Past performance of any strategy — including backtests — does not guarantee future results. Never trade with money you cannot afford to lose.
What Is This Strategy?
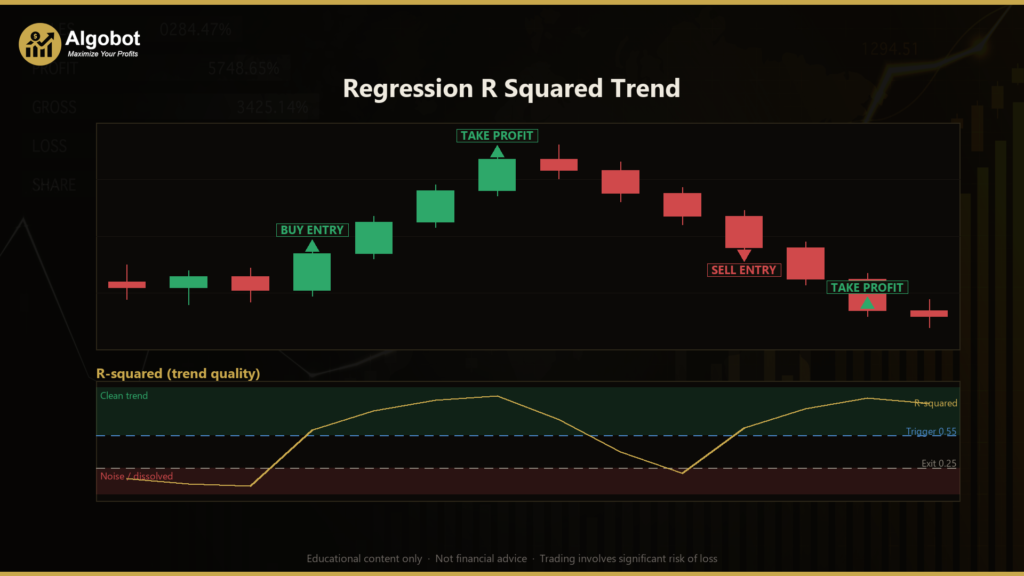
The Regression R Squared Trend strategy is a trend-following expert advisor built around a statistical measure called R-squared (the coefficient of determination) applied to a linear regression of recent closing prices. In plain terms, on every closed bar the strategy draws the best-fit straight line through the last N closes and then asks a single question: how straight is that path? R-squared answers exactly that, on a scale from 0 (the closes are pure scatter, or noise) to 1 (the closes hug a clean straight line). This makes the strategy unusual — instead of reacting to a price level, an oscillator reading, or a channel touch, it reacts to trend quality itself.
The approach is designed for markets that transition out of directionless chop and organise into a well-defined trend. Rather than chasing a move that is already obvious, the strategy watches for the precise moment the market stops behaving randomly and begins tracing a statistically meaningful line. The regression slope then supplies the direction (rising line = long bias, falling line = short bias), and an Average True Range (ATR) volatility filter confirms that the fitted move is large enough to matter. ATR is a standard measure of how much an instrument typically moves per bar, and it is used throughout so the logic self-scales across instruments.
As a learning tool, this strategy is well suited to traders who want to understand how quantitative "regime detection" works — the idea of measuring whether price is trending or ranging using a real statistic rather than a subjective eyeball judgement. It is best studied on liquid, trend-prone markets. Treat it as a framework for analysis and experimentation, not as a shortcut to results.
How It Works
The strategy evaluates its rules only once per newly closed bar, which keeps signals stable and avoids reacting to intrabar noise. Each bar it fits an ordinary least-squares line to the last RegPeriod closes and computes the slope, the R-squared value, and the line's end-point (the fitted price at the most recent bar).
Entry conditions — the strategy signals a long when:
- R-squared freshly crosses up through the
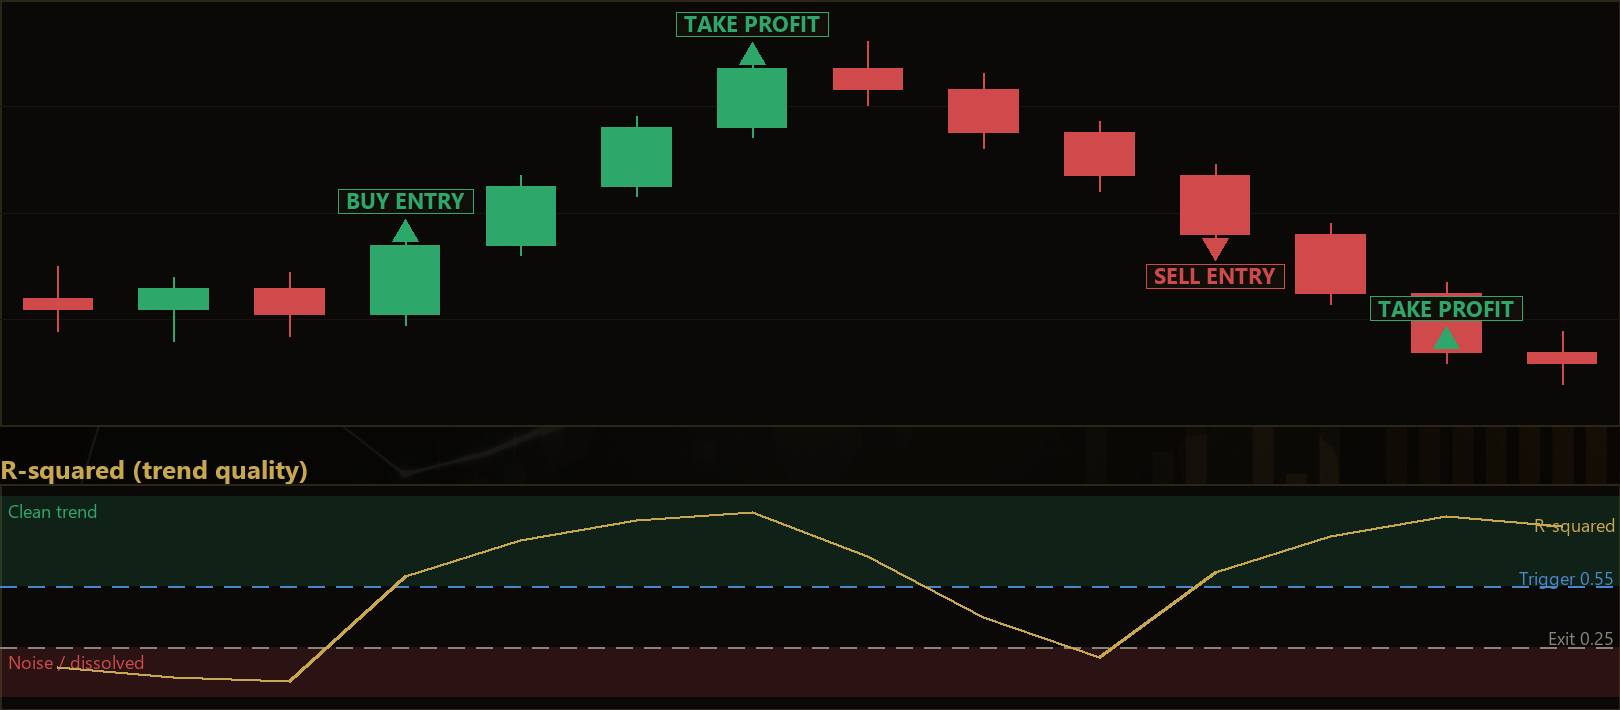
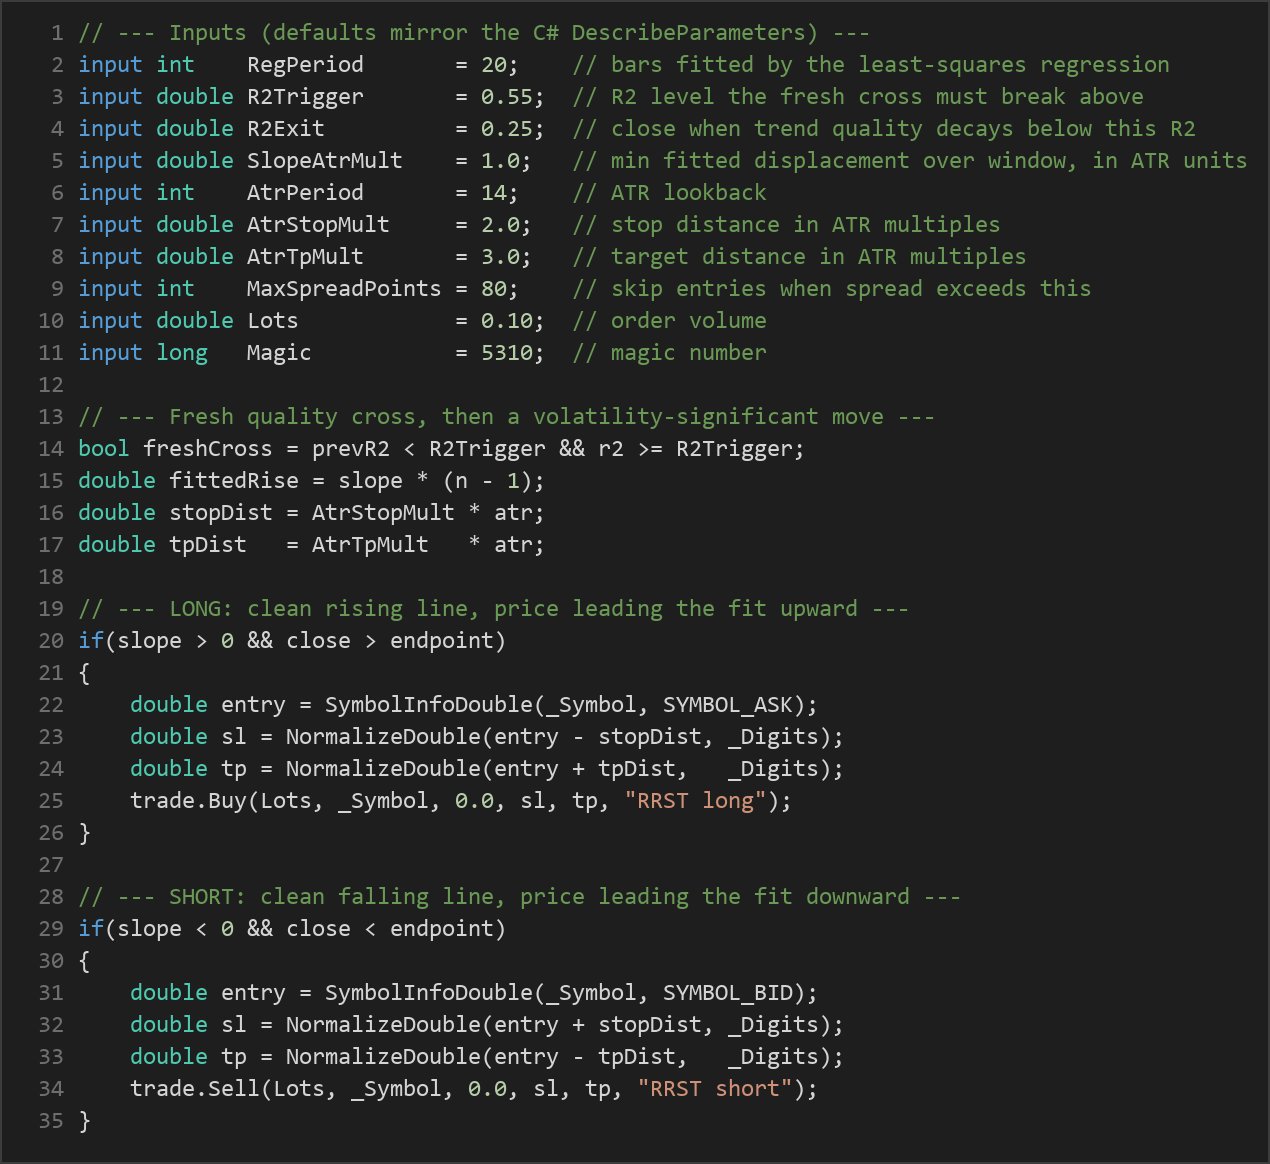
R2Triggerlevel — it was below the trigger on the previous window and is at or above it now. This "fresh cross" is the heart of the strategy: it captures the transition from noise to structure, not a trend that is already mature. - The regression slope is positive, meaning the clean line points upward.
- The fitted rise over the window (slope × (N−1)) is at least
SlopeAtrMult× ATR. This filters out lines that are tidy but nearly flat — a straight line going nowhere is not a tradable trend. - The close sits above the regression end-point, confirming price is leading the fit upward.
A short signal is the exact mirror image: a fresh R-squared cross, a negative slope, a volatility-significant fitted decline, and a close below the regression end-point.
Stop-loss and take-profit logic:
- On entry, the strategy places a stop-loss at
AtrStopMult× ATR away from the entry price and a take-profit atAtrTpMult× ATR away. Because both distances are expressed in ATR units, the bracket automatically widens in volatile conditions and tightens in calm ones.
Active trade management (beyond the fixed bracket):
- Line dissolved: if R-squared decays below
R2Exit, the strategy reads this as the trend losing its statistical definition and closes the position early. - Slope reversal: if R-squared is still strong (at or above the trigger) but the slope flips against the open trade, the strategy interprets this as a genuine reversal rather than random wobble and exits.
Additional filters:
- Only one position per magic number is held at a time.
- New entries are skipped when the current spread (in points) exceeds
MaxSpreadPoints, which avoids opening trades in poor execution conditions.
Strategy Parameters
| Parameter | Default | Min | Max | Description |
|---|---|---|---|---|
| RegPeriod | 20 | 8 | 60 | Number of closed bars fitted by the least-squares regression window. |
| R2Trigger | 0.55 | 0.30 | 0.90 | The R-squared level a fresh cross must break above to confirm an emerging, well-defined trend. |
| R2Exit | 0.25 | 0.05 | 0.60 | Close the trade when trend quality decays below this R-squared (the fitted line has dissolved). |
| SlopeAtrMult | 1.0 | 0.0 | 3.0 | Minimum fitted displacement over the window, in ATR units — rejects tidy but flat lines. |
| AtrPeriod | 14 | 5 | 40 | Lookback length for the ATR volatility measure. |
| AtrStopMult | 2.0 | 0.5 | 5.0 | Stop-loss distance as a multiple of ATR. |
| AtrTpMult | 3.0 | 0.5 | 8.0 | Take-profit distance as a multiple of ATR. |
| MaxSpreadPoints | 80 | 5 | 300 | Skip new entries when the current spread (in points) is wider than this. |
| Lots | 0.10 | 0.01 | 1.0 | Order volume (position size) in lots. |
| Magic | 5310 | 0 | 9,999,999 | Unique identifier so the EA manages only its own trades. |
Recommended Chart Settings
The Regression R Squared Trend strategy is designed with liquid, trending markets in mind — for example major FX pairs such as EURUSD or an index like US100 — on intraday-to-swing timeframes in the M15 to H1 range. Nothing in the logic is hardcoded to a specific symbol or timeframe: every bar read uses the chart's own timeframe, so it will run on whatever chart you attach it to. The default RegPeriod of 20 and R2Trigger of 0.55 are sensible starting points, but the ideal window length and trigger level depend heavily on the instrument's character. Results will vary across different market conditions, and a setting that suits a trending pair may perform quite differently on a range-bound or highly news-driven instrument. Always test on your chosen symbol and timeframe before drawing conclusions.
How to Install on MetaTrader 5
- Download the .ex5 file from the link below
- Copy it to your MT5
MQL5\Expertsfolder - Restart MetaTrader 5 or refresh the Navigator panel
- Drag the EA onto a chart matching the recommended symbol and timeframe
- Configure the input parameters and enable Algo Trading
What to Consider Before Using This EA
Strengths. The strategy's core idea — gating entries on a genuine statistical measure of trend quality — is a thoughtful way to avoid one of the most common trend-following pitfalls: entering choppy markets that merely look like they might trend. By requiring a fresh R-squared cross, a directional slope, and a volatility-significant fitted move all at once, it filters out many low-conviction setups. The ATR-based stops, targets, and slope filter mean the same parameters adapt across instruments without manual rescaling, which makes it a clean framework to study.
Limitations. R-squared measures straightness, not profitability — a market can trace a beautifully straight line right into a reversal. Because the strategy acts on the emergence of a trend, it will inevitably take some signals where the "trend" fizzles out shortly after the cross, and these are managed only by the R2Exit and slope-reversal rules. Like all trend-following systems, it is prone to underperformance in range-bound, choppy, or mean-reverting conditions, where fresh crosses may appear and dissolve repeatedly (so-called whipsaws). The fixed single-position, fixed-lot design also does not scale risk to account size on its own.
Where it may struggle. Low-liquidity sessions, major news events, and instruments with erratic spreads can all degrade signal quality. The MaxSpreadPoints filter helps, but it is a blunt guard, not a complete safeguard. Treat every parameter as a hypothesis to be tested, not a proven setting.
Risk Management Tips
Sound risk management matters far more than any single indicator. Consider the following general principles as you study this strategy:
- Position sizing: Keep individual position sizes small relative to your account. A widely cited guideline is to risk no more than 1–2% of account equity per trade, adjusting the lot size (not just the stop) so that a losing trade stays within that limit.
- Use a demo account first: Test the EA thoroughly in a risk-free demo environment and in the MT5 Strategy Tester before considering any live capital.
- Understand drawdown: Every strategy experiences losing streaks. Study how deep and how long historical drawdowns can run so you are psychologically and financially prepared for them.
- Diversify and avoid over-leverage: Concentrating too much capital in a single instrument or using excessive leverage can amplify losses well beyond expectations.
- Review regularly: Markets evolve. Periodically re-evaluate whether the chosen parameters still suit current conditions, and never assume past behaviour will repeat.
Risk Warning
Trading foreign exchange, CFDs, and other leveraged financial instruments involves substantial risk of loss and is not suitable for all investors. The strategies and tools discussed on this page are provided for educational purposes only and do not constitute financial advice, investment recommendations, or solicitation to trade. Always consult a qualified financial adviser before making trading decisions. Past backtest performance is not indicative of future results.
Downloads
- Expert Advisor: RegressionRSquaredTrend.ex5 (31 downloads)
- Source Code: RegressionRSquaredTrend.mq5 (30 downloads)
- Documentation: RegressionRSquaredTrend.pdf (34 downloads)