Disclaimer: This article is for educational and informational purposes only. It does not constitute financial or investment advice. Trading forex and CFDs carries significant risk of loss. Past performance of any strategy — including backtests — does not guarantee future results. Never trade with money you cannot afford to lose.
What Is This Strategy?
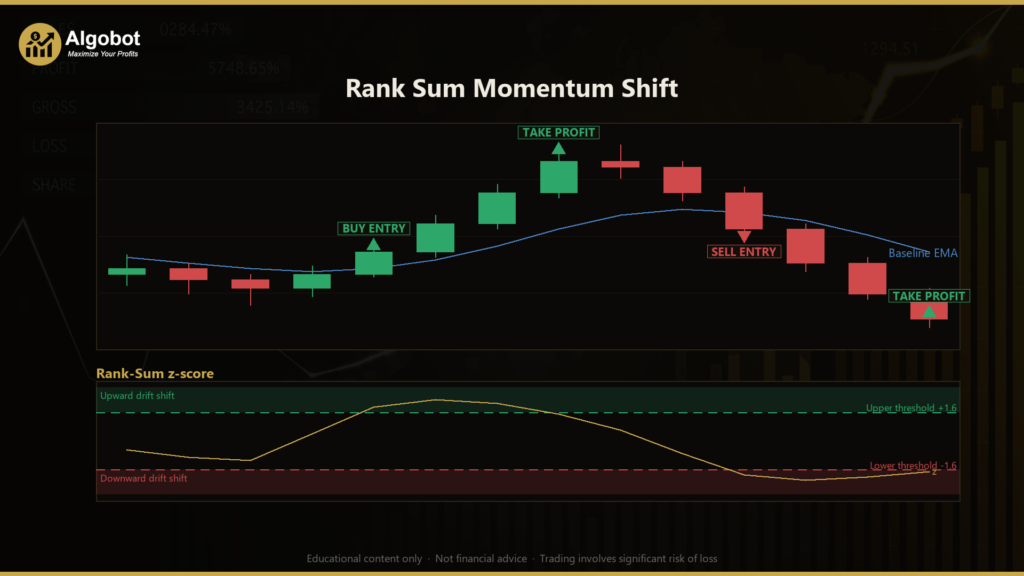
The Rank Sum Momentum Shift strategy is a nonparametric, drift-regime detector built on the Wilcoxon rank-sum test (also known as the Mann-Whitney U test), a classic statistical tool for comparing two samples. Instead of asking "how big are recent moves?", it asks a subtler, more robust question: "have recent bar-to-bar returns started to rank consistently higher or lower than they did a moment ago?" When the answer is yes, the strategy interprets it as a quiet, statistically meaningful shift in the market's underlying drift — the early signature of an emerging trend. This is a systematic, trend-following approach with a mean-reversion-aware twist, and it trades on the transition into a new regime rather than the regime itself.
The core insight is about robustness. Traditional momentum signals — a simple return average, a t-statistic, or a z-score of returns — can be completely distorted by a single spike bar, such as a news candle or a liquidity gap. The rank-sum test sidesteps this problem entirely: it discards the raw magnitudes of returns and looks only at their ordering (their ranks). A single enormous outlier still counts as just one high rank, so the test detects a genuine location shift in the distribution while shrugging off the noise. That makes it well suited to markets that transition gradually from choppy, directionless conditions into a developing trend.
As a learning tool, Rank Sum Momentum Shift is valuable for traders who want to understand how nonparametric statistics can be applied to price action. It introduces concepts like average-ranking, the U statistic, and standardizing a test into a z-score — all in a practical trading context. It is best suited to students of quantitative and algorithmic trading who are comfortable running a backtest, examining the logic, and studying why a signal fired, rather than to anyone seeking a hands-off tool. Treat it as a case study in disciplined, outlier-resistant signal design.
How It Works
The strategy evaluates once per completed bar (never on an unfinished, forming bar) to avoid repainting. On each new bar it compares two adjacent windows of bar-to-bar returns and standardizes the comparison into a single z-score.
Here is the logic, step by step:
- Build two return windows. The strategy takes the most recent
2 × Windowreturns and splits them into two equal halves: the OLD window (the prior regime) and the RECENT window (the emerging regime). - Rank all returns together. All
2 × Windowreturns are pooled and assigned average ranks from smallest to largest, with ties handled by sharing the mean rank. Magnitudes are ignored — only ordering matters. - Compute the z-score. The sum of the ranks belonging to the RECENT window produces the Mann-Whitney U statistic, which is then standardized into a z-score. A positive z means recent returns rank systematically higher (an upward drift shift); a negative z means they rank lower (a downward drift shift).
- Trend-alignment filter. A baseline Exponential Moving Average (EMA) — a moving average that weights recent prices more heavily — acts as a light filter so the strategy joins the new regime only when price agrees with it, rather than fighting a still-dominant opposite trend.
Entry conditions — the strategy acts on the fresh crossing of a threshold, not on the state itself:
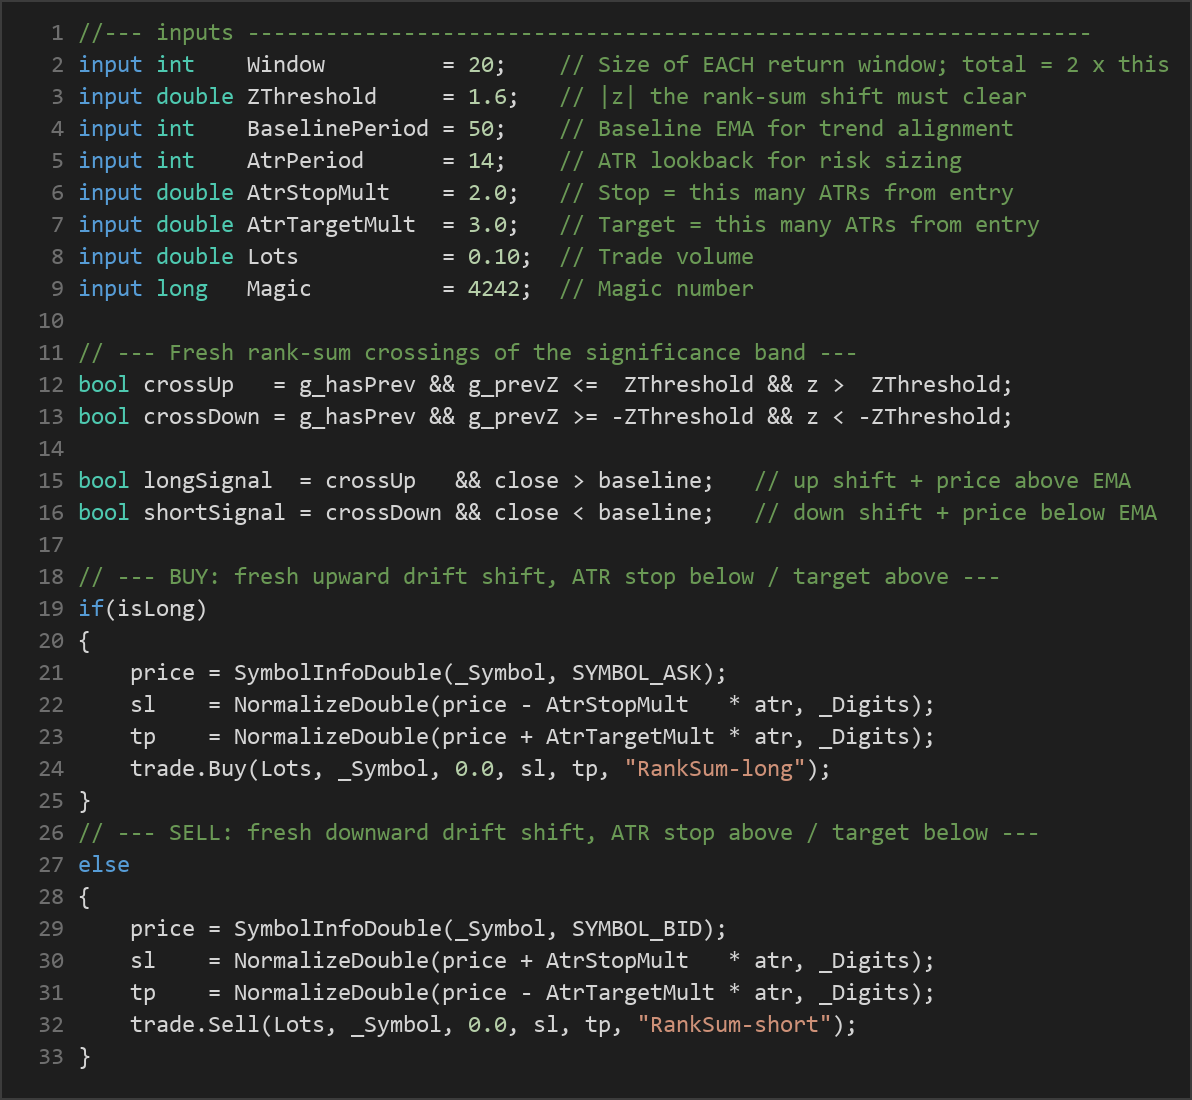
- The strategy signals a long when the z-score crosses up through
+ZThresholdand the last close is above the baseline EMA. - The strategy signals a short when the z-score crosses down through
−ZThresholdand the last close is below the baseline EMA. - These rules are distinct and symmetric. An opposite fresh signal closes the current position and reverses into the new direction.
Exit, stop-loss, and take-profit logic:
- Risk is sized using the Average True Range (ATR), an indicator that measures recent volatility.
- On a long, the stop-loss is placed
AtrStopMult × ATRbelow entry and the take-profitAtrTargetMult × ATRabove it. Shorts mirror this. - With the default multiples (stop 2.0 ATR, target 3.0 ATR), the strategy targets a reward-to-risk ratio of roughly 1.5-to-1.
- A position may also be closed early if an opposite fresh signal fires, triggering the stop-and-reverse behavior described above.
Strategy Parameters
| Parameter | Default | Min | Max | Description |
|---|---|---|---|---|
| Window | 20 | 8 | 60 | Size of each return window (recent vs. prior). The total sample compared is 2 × Window. Larger values smooth the signal but react more slowly. |
| ZThreshold | 1.6 | 0.5 | 3.0 | The absolute z-score the rank-sum shift must clear to be judged statistically significant. Higher values demand stronger, rarer shifts. |
| BaselinePeriod | 50 | 10 | 200 | Lookback for the baseline EMA used as a trend-alignment filter. Only shifts that agree with this EMA are taken. |
| AtrPeriod | 14 | 5 | 40 | Lookback period for the ATR used in risk sizing. |
| AtrStopMult | 2.0 | 0.5 | 5.0 | Stop-loss distance, expressed as this many ATRs from the entry price. |
| AtrTargetMult | 3.0 | 0.5 | 8.0 | Take-profit distance, expressed as this many ATRs from the entry price. |
| Lots | 0.10 | 0.01 | 1.0 | Trade volume (position size) in lots. |
Recommended Chart Settings
The Rank Sum Momentum Shift EA is timeframe-agnostic by design — every internal calculation uses the primary chart's timeframe, so the strategy adapts to whatever timeframe you attach it to. This makes it flexible, but it also means you should test deliberately rather than assume one setting fits all.
A sensible starting point for study is a major forex pair such as EUR/USD or GBP/USD on the H1 (1-hour) or H4 (4-hour) timeframe, where bar-to-bar returns are liquid and comparatively well-behaved, giving the rank-sum test a clean sample to work with. Higher timeframes tend to produce fewer but more considered signals, while lower timeframes generate more frequent activity that may include more noise.
Because the statistical significance of a drift shift depends heavily on the character of the instrument, results will vary substantially across different symbols, timeframes, and market conditions. Always run your own backtests and forward-tests before drawing any conclusions about a particular configuration.
How to Install on MetaTrader 5
- Download the .ex5 file from the link below.
- Copy it to your MT5
MQL5\Expertsfolder. - Restart MetaTrader 5 or refresh the Navigator panel.
- Drag the EA onto a chart matching the recommended symbol and timeframe.
- Configure the input parameters and enable Algo Trading.
What to Consider Before Using This EA
Strengths of the approach. The headline advantage is outlier robustness. By ranking returns instead of averaging them, the strategy resists distortion from single spike bars, gaps, and news candles that routinely wreck mean-based momentum signals. Acting on the fresh crossing of a significance threshold — rather than a persistent state — also encourages the strategy to engage a regime early, and the EMA filter provides a sanity check that keeps it from buying into a still-dominant downtrend (or vice versa). The stop-and-reverse logic keeps the system continuously aligned with the most recent statistically significant shift.
Known limitations. No signal is free. The rank-sum test detects a shift in the distribution of returns, but a distribution can shift without price making a clean, tradable move — so whipsaws in choppy, sideways markets are a real risk, especially at lower ZThreshold values that fire more readily. Because the test ignores magnitude, it can flag a shift built on many small moves that lacks the follow-through to reach an ATR-based target. The strategy is also inherently lagging: it needs 2 × Window completed returns plus EMA and ATR warmup before it can act, so the earliest part of a move is missed by construction.
Where it may underperform. Expect difficulty in tight, low-volatility ranges where "shifts" are statistical artifacts rather than genuine trends, and during violent, two-sided volatility where the stop-and-reverse logic can be caught flipping back and forth. Fixed ATR multiples may also be poorly matched to some instruments, cutting winners short or leaving stops too wide. This is an educational framework for studying nonparametric signal design — not a finished, market-ready system — and it should be studied and stress-tested accordingly.
Risk Management Tips
Sound risk management matters far more than any single entry signal. Keep these general principles in mind as you study this strategy:
- Risk a small, fixed fraction per trade. A widely taught guideline is to risk no more than 1–2% of account equity on any single position. Size your lots so that the distance to your ATR stop represents that small fraction, rather than trading a fixed lot size blindly.
- Understand drawdown. Even a well-designed strategy will experience losing streaks. Study the maximum drawdown in your backtests and ask honestly whether you could tolerate that decline in real capital.
- Always start on a demo account. Run the EA in a risk-free simulated environment first to understand its behavior, signal frequency, and reaction to different market conditions before considering any live deployment.
- Account for costs. Spreads, commissions, and slippage can materially change results — especially on lower timeframes where the strategy trades more often.
- Never over-leverage. Leverage amplifies losses just as much as gains. Use it conservatively and only after you fully understand the strategy's risk profile.
Risk Warning
Trading foreign exchange, CFDs, and other leveraged financial instruments involves substantial risk of loss and is not suitable for all investors. The strategies and tools discussed on this page are provided for educational purposes only and do not constitute financial advice, investment recommendations, or solicitation to trade. Always consult a qualified financial adviser before making trading decisions. Past backtest performance is not indicative of future results.
Downloads
- Expert Advisor: RankSumMomentumShift.ex5 (42 downloads)
- Source Code: RankSumMomentumShift.mq5 (46 downloads)
- Documentation: RankSumMomentumShift.pdf (52 downloads)