Disclaimer: This article is for educational and informational purposes only. It does not constitute financial or investment advice. Trading forex and CFDs carries significant risk of loss. Past performance of any strategy — including backtests — does not guarantee future results. Never trade with money you cannot afford to lose.
What Is This Strategy?
The Range Expansion Index Pullback strategy is a with-trend, pullback-timing system built around Tom DeMark's Range Expansion Index (REI) — a momentum oscillator that measures the signed, gated expansion of a bar's trading range rather than the close-to-close change that drives more familiar tools like RSI or the DeMarker. Because the REI pairs each bar's High and Low with the levels two bars earlier, it captures whether the range of price action is genuinely stretching upward or downward, and it deliberately zeroes out any bar whose range has fully detached from recent prices (a spike or gap). The result is a reading that reflects connected, directional range flow rather than isolated noise.
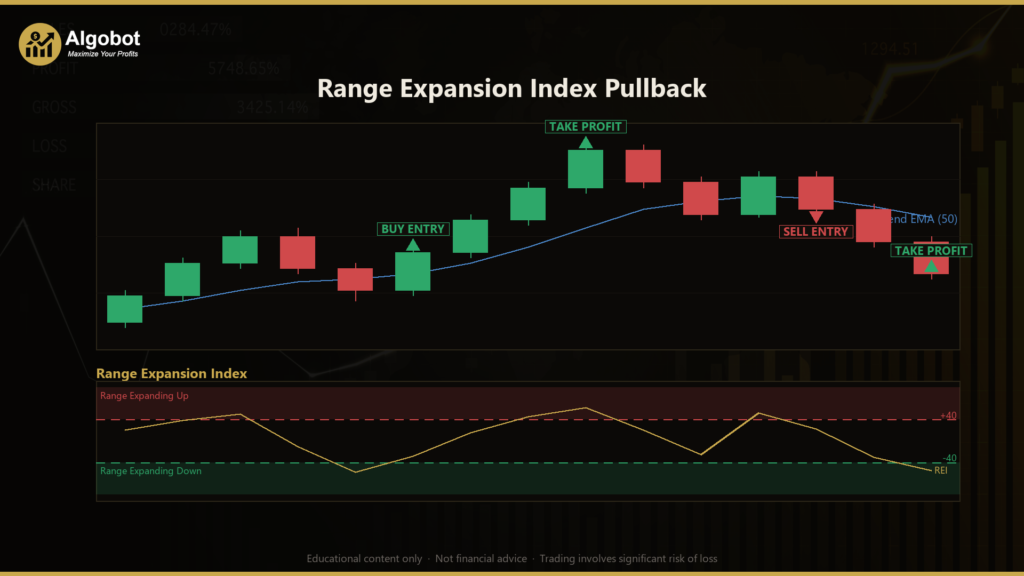
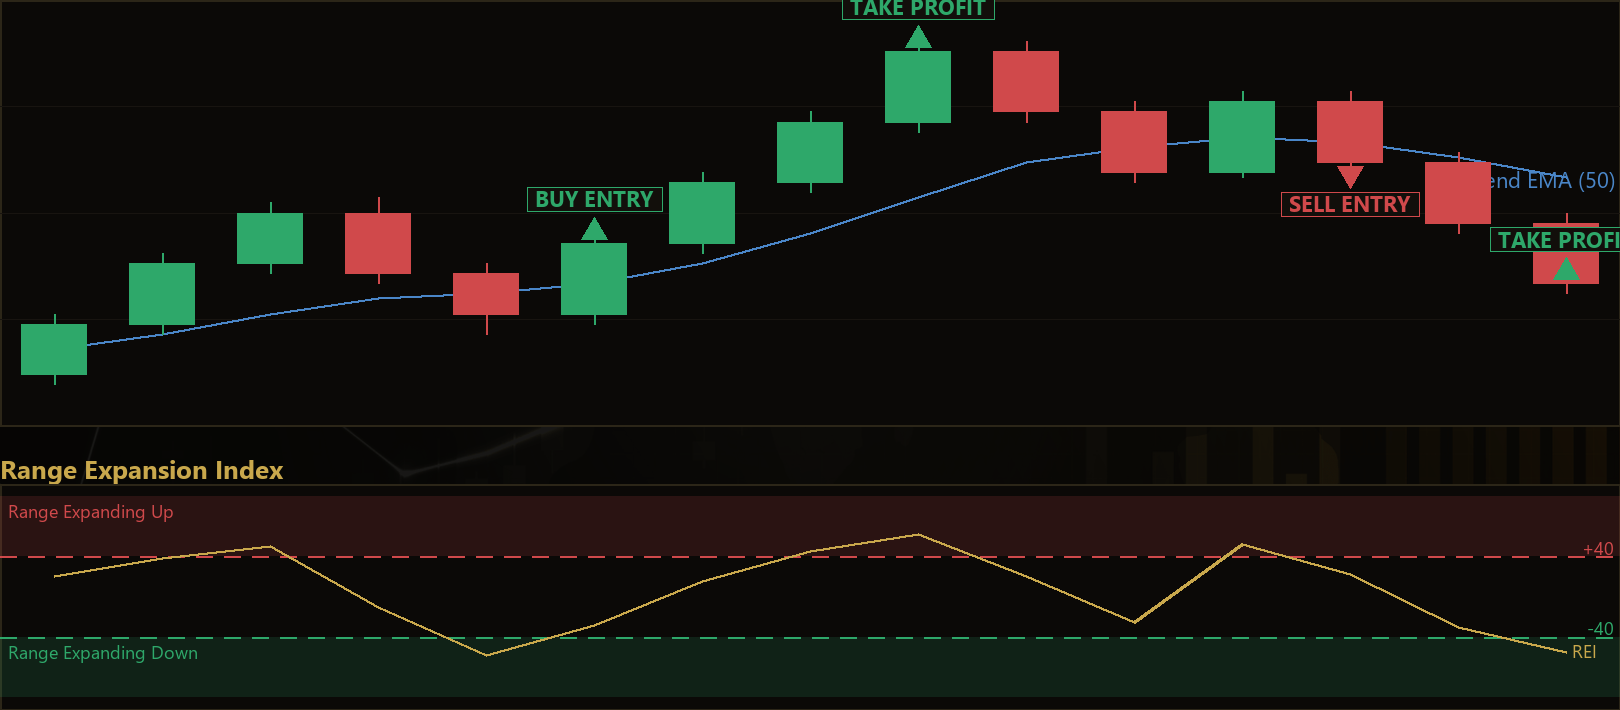
This is a trend-following approach, not a counter-trend fade. The strategy is designed for markets that are already trending on the chosen timeframe. In an established up-trend, an ordinary pullback pushes the REI down into oversold territory; when that pullback exhausts and buyers step back in, the REI turns back up through the oversold band. The strategy signals an entry on that recovery — a shallow dip inside a healthy trend — so trades are placed at a favorable pullback price with the prevailing drift on the same side. Short trades are the exact mirror in a down-trend.
As a learning tool, this EA suits traders who want to study how range-based oscillators differ from price-based ones, and how a with-trend filter (a rising or falling moving average) can be combined with an oscillator to time entries. It is best explored on liquid, trending instruments — major FX pairs, gold, and stock indices — across intraday-to-swing timeframes. It is intended for educational analysis of a systematic method, not as a profit opportunity.
How It Works
The strategy evaluates conditions only once per completed bar, then checks for a single entry setup at a time. Here is the logic in plain English.
Trend filter (the direction gate):
- The strategy computes an exponential moving average (EMA) of closing prices over the
TrendPeriodlength. - It compares the EMA now against its value
SlopeLookbackbars ago to test whether the trend is rising or falling. - An up-trend requires price to be above a rising EMA; a down-trend requires price to be below a falling EMA. Trades are only ever taken in the direction of this slope, so the strategy never fades a strong move.
Entry signal (the pullback recovery cross):
- The Range Expansion Index is calculated over the last
ReiPeriodbars for both the just-completed bar and the bar before it. - Long setup: in a confirmed up-trend, the REI was below
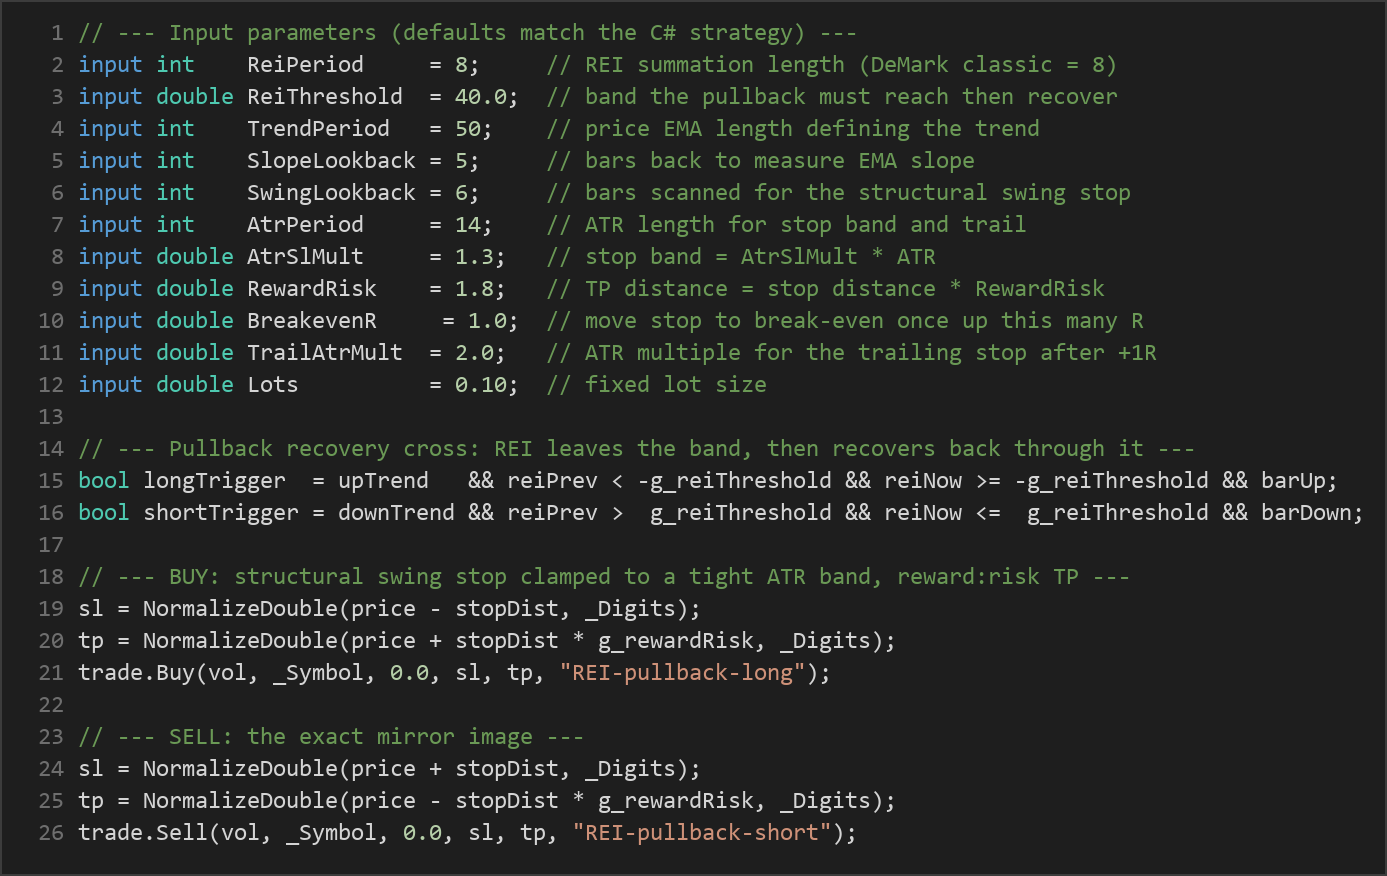
-ReiThresholdlast bar (an oversold pullback) and has just recovered back up through-ReiThresholdthis bar, and the trigger bar closes higher than it opened. - Short setup: in a confirmed down-trend, the REI was above
+ReiThresholdlast bar and has just fallen back through+ReiThreshold, with the trigger bar closing lower than it opened. - Only one position per magic number is held at a time, so no new trade opens while another is running.
Stop-loss logic (structural, tightly bounded):
- For longs, the strategy finds the lowest low over the last
SwingLookbackbars and places the stop just beneath it (with a small ATR buffer). For shorts it uses the highest high. - That structural distance is then clamped to a tight band between 0.7× and 1.5× of
AtrSlMult× ATR, so risk-per-trade stays small and bounded regardless of how wide the raw swing is.
Take-profit logic:
- The take-profit is placed at the stop distance multiplied by the
RewardRiskratio, giving a fixed reward-to-risk target on every trade.
Trade management (protecting the position):
- Once a trade moves in profit by
BreakevenRmultiples of its initial risk, the stop is moved to a small locked-in gain near break-even. - After the trade reaches +1R, an ATR-based trailing stop (
TrailAtrMult× ATR) follows price. The stop is only ever tightened, never loosened — losers are cut small while winners are given room to run.
Strategy Parameters
| Parameter | Default | Min | Max | Description |
|---|---|---|---|---|
| ReiPeriod | 8 | 5 | 14 | Number of bars summed for the Range Expansion Index (DeMark's classic value is 8). |
| ReiThreshold | 40.0 | 25.0 | 60.0 | The oversold/overbought band the pullback must reach and then recover through. |
| TrendPeriod | 50 | 20 | 150 | Length of the price EMA that defines the prevailing trend. |
| SlopeLookback | 5 | 2 | 15 | Bars back used to measure the EMA slope (the rising/falling test). |
| SwingLookback | 6 | 3 | 15 | Bars scanned to find the structural swing low/high for the stop. |
| AtrPeriod | 14 | 7 | 30 | ATR length used for the stop band and the trailing stop. |
| AtrSlMult | 1.3 | 0.6 | 3.0 | Sets the ATR stop band; the structural stop is clamped to this. |
| RewardRisk | 1.8 | 1.0 | 3.5 | Take-profit distance as a multiple of the stop distance. |
| BreakevenR | 1.0 | 0.3 | 2.0 | Profit (in R multiples) at which the stop moves to break-even. |
| TrailAtrMult | 2.0 | 0.8 | 4.0 | ATR multiple used for the trailing stop after +1R. |
| Lots | 0.10 | 0.01 | 1.0 | Fixed position size in lots. |
Recommended Chart Settings
This strategy operates on a single timeframe — whichever chart it is attached to — so every calculation uses that chart's bars. It was designed with liquid, trending instruments in mind: major FX pairs (such as EUR/USD or GBP/USD), gold (XAU/USD), and major stock indices. Intraday-to-swing timeframes (for example H1 through H4) are a reasonable starting point for study, as they give the EMA trend filter and the REI enough bars to behave stably.
Keep in mind that results will vary significantly across different symbols, timeframes, and market conditions. A setting that appears well-behaved on one instrument during one period may perform very differently on another. Always test any configuration on historical data and a demo account before drawing conclusions.
How to Install on MetaTrader 5
- Download the .ex5 file from the link below
- Copy it to your MT5
MQL5\Expertsfolder - Restart MetaTrader 5 or refresh the Navigator panel
- Drag the EA onto a chart matching the recommended symbol and timeframe
- Configure the input parameters and enable Algo Trading
What to Consider Before Using This EA
Strengths of the approach. The Range Expansion Index is a distinctive oscillator: because it measures range expansion and filters out detached spike bars, it can register genuine directional pressure that close-based indicators sometimes miss. Pairing it with a slope-confirmed EMA means entries are only taken with the trend, and the structural-stop-clamped-to-ATR design keeps individual risk small and consistent. The automatic break-even lock and ATR trail are built to keep the loss distribution compact.
Known limitations. No oscillator is a crystal ball. The REI, like any momentum tool, can whipsaw during choppy, directionless conditions — the very periods where a "pullback recovery" cross may fire repeatedly without a real trend resuming. The strategy's reliance on a moving-average trend filter means it will lag at turning points and can be caught out when a trend reverses shortly after entry. Clamping the stop to a tight ATR band controls risk but can also place the stop closer than a genuine structural level would suggest, occasionally stopping out trades that later recover.
Where it may underperform. Expect weaker behavior in range-bound, low-volatility markets, during major news shocks that produce gaps, and on illiquid instruments with erratic spreads. Because it is trend-following, extended sideways periods will tend to produce a string of small losses. Treat this EA as a framework for studying REI-based pullback timing, not as a set-and-forget solution.
Risk Management Tips
Sound risk management matters more than any single indicator. As you study this strategy, keep these general principles in mind:
- Risk a small fraction per trade. Many educational sources suggest risking no more than 1–2% of account equity on any single position. Adjust the
Lotsparameter so a full stop-out stays within that limit for your account size. - Use a demo account first. Test the strategy in MT5's Strategy Tester and on a demo account across different symbols and market regimes before considering any live use.
- Understand drawdown. Even a well-designed system will experience losing streaks. Study the historical drawdown so you know the depth and duration you would need to tolerate.
- Keep leverage modest. High leverage magnifies both gains and losses; conservative sizing gives a strategy room to work through normal variance.
- Review regularly. Markets evolve. Periodically re-examine whether the parameters and instruments you have chosen still behave as expected.
Risk Warning
Trading foreign exchange, CFDs, and other leveraged financial instruments involves substantial risk of loss and is not suitable for all investors. The strategies and tools discussed on this page are provided for educational purposes only and do not constitute financial advice, investment recommendations, or solicitation to trade. Always consult a qualified financial adviser before making trading decisions. Past backtest performance is not indicative of future results.
Downloads
- Expert Advisor: RangeExpansionIndexPullback.ex5 (46 downloads)
- Source Code: RangeExpansionIndexPullback.mq5 (43 downloads)
- Documentation: RangeExpansionIndexPullback.pdf (50 downloads)