Disclaimer: This article is for educational and informational purposes only. It does not constitute financial or investment advice. Trading forex and CFDs carries significant risk of loss. Past performance of any strategy — including backtests — does not guarantee future results. Never trade with money you cannot afford to lose.
What Is This Strategy?
The Rainbow Oscillator Trend Shift is a trend-following Expert Advisor built around the Rainbow Oscillator, a momentum tool derived from Mel Widner's "Rainbow Charts" concept first published in Stocks & Commodities magazine in 1997. Instead of relying on a single moving average, this strategy constructs a ladder of recursively smoothed averages — each one is a moving average of the average below it. Stacked together, these lines "fan out" like a rainbow, and their mean forms an unusually stable, noise-resistant centre of gravity for price. A moving average, for readers new to the term, is simply the average price over a set number of bars, used to smooth out short-term fluctuations.
The Rainbow Oscillator measures how far the current closing price sits above or below that rainbow centre, expressed as a percentage of the recent high-to-low trading range. Because the reading is normalised by range, it becomes "scale-free" — the same numeric thresholds behave consistently across different instruments and across calm versus volatile market conditions. This makes the oscillator a compact way to answer a single question: how far has price broken free of its own smoothed trend cloud?
As a learning tool, this strategy is designed for trending market conditions and is best suited to traders who want to study how multi-layer smoothing and range normalisation can filter out the "chop" that whipsaws simpler moving-average crossover systems. It is a strategy analysis intended for education — not a shortcut, and not a profit opportunity. Beginner and intermediate traders can use it to explore how confirmation filters (a threshold thrust plus an agreeing trend tilt) reduce false signals.
How It Works
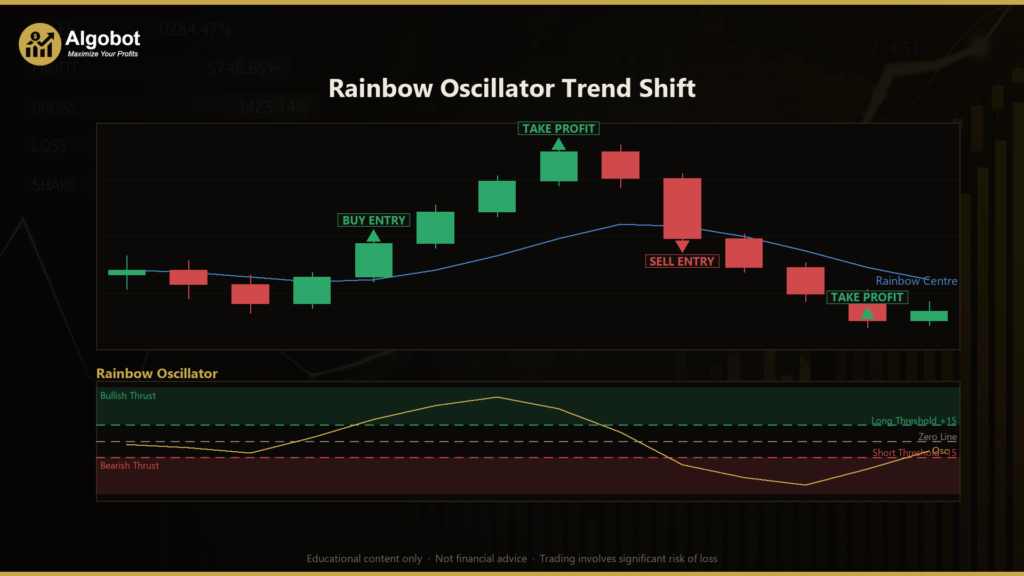
The strategy evaluates its logic only on closed bars, meaning it does not repaint or change past signals once a bar has completed. Every tick, it also checks whether an open position's trailing stop should be advanced. Here is how the signals are generated:
- Building the rainbow: The strategy computes the first smoothed average of closing prices, then smooths that result, and repeats the process for as many levels as configured. The mean of all these rungs becomes the "rainbow centre."
- Calculating the oscillator: It measures the distance between the current close and the rainbow centre, then divides by the recent high-low range and multiplies by 100. A positive reading means price is riding above the rainbow (a bullish pull); a negative reading means price is below it (a bearish pull).
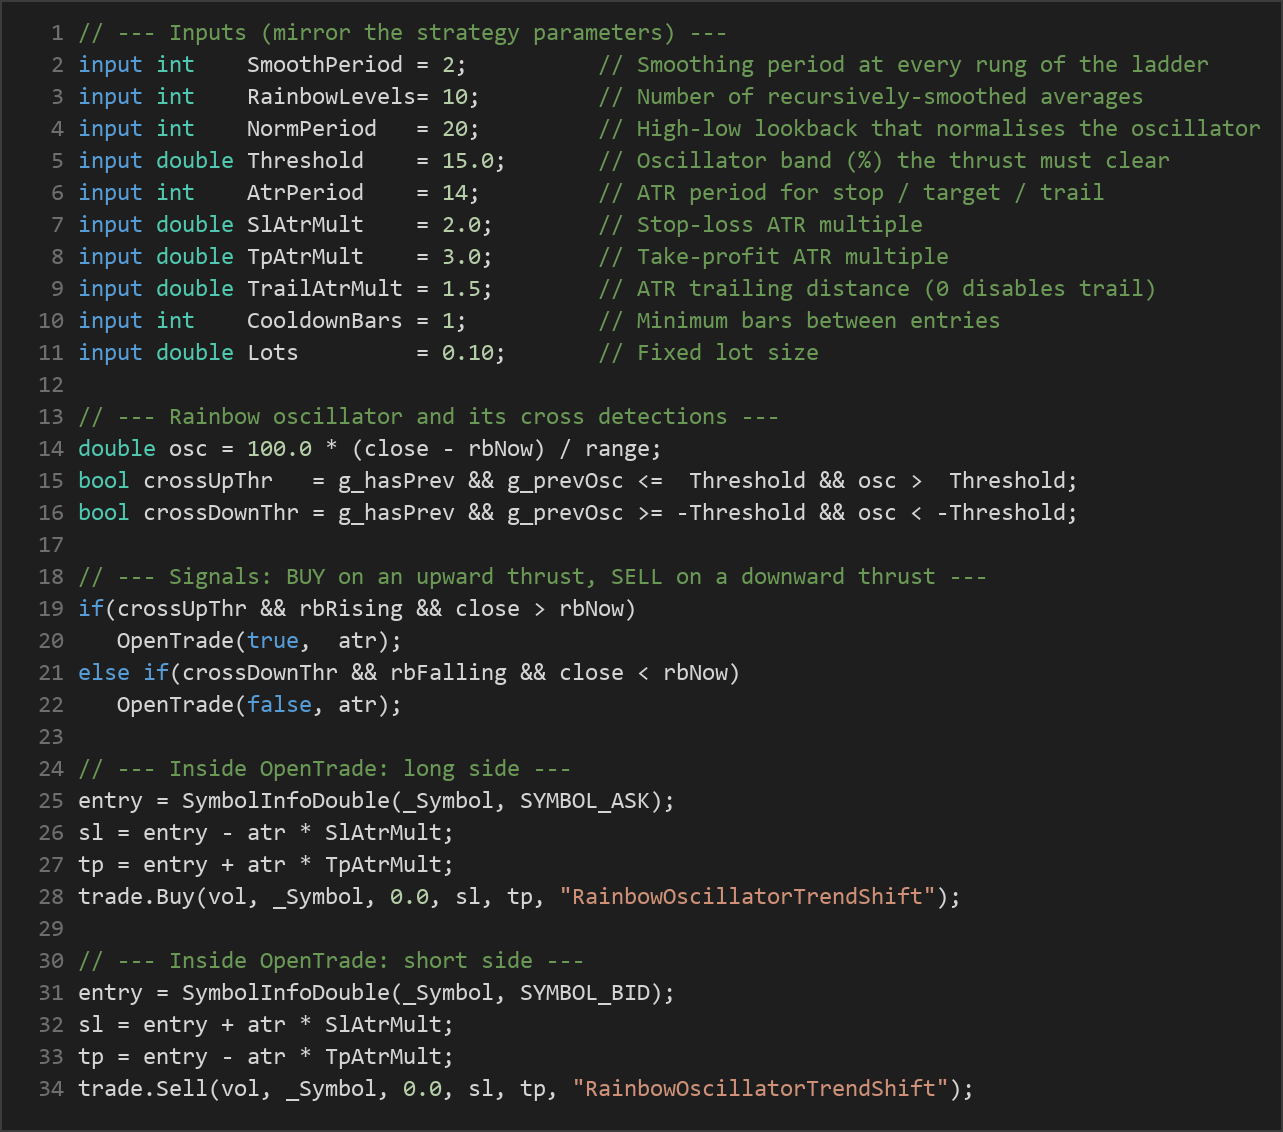
- Long entry signal: The strategy signals a potential long when the oscillator crosses up through the positive threshold, the rainbow mean is rising, and the close is above the rainbow centre. All three conditions must agree.
- Short entry signal: The strategy signals a potential short when the oscillator crosses down through the negative threshold, the rainbow mean is falling, and the close is below the rainbow centre.
- Exit signal: A long position is closed when the oscillator falls back through zero — meaning price has re-entered the rainbow cloud. A short is closed when the oscillator crosses back above zero. This is the primary "trend shift" exit.
- Stop-loss logic: Each trade is protected by a stop placed a multiple of the Average True Range (ATR) away from entry. ATR is a volatility measure based on the size of recent bars, so the stop automatically widens in volatile conditions and tightens in quiet ones.
- Take-profit logic: A target is set at a separate ATR multiple from entry, giving a volatility-scaled reward objective.
- Optional trailing stop: If enabled, the strategy ratchets the stop toward price by an ATR-based distance, but only ever in the favourable direction — locking in progress as a trend extends.
- Cooldown filter: A minimum number of bars must pass between entries to curb over-trading and reduce churn.
Strategy Parameters
| Parameter | Default | Min | Max | Description |
|---|---|---|---|---|
| SmoothPeriod | 2 | 2 | 6 | Smoothing period applied at every rung of the rainbow ladder. Higher values make each layer lag more. |
| RainbowLevels | 10 | 4 | 16 | Number of recursively smoothed averages that make up the rainbow. More levels mean a smoother, slower centre. |
| NormPeriod | 20 | 10 | 60 | High-low lookback window used to normalise the oscillator into a scale-free reading. |
| Threshold | 15.0 | 0.0 | 50.0 | The oscillator band (in %) the thrust must clear to arm a trade. Higher values demand a stronger breakout. |
| AtrPeriod | 14 | 7 | 30 | Number of bars used to calculate ATR for the stop, target, and trail. |
| SlAtrMult | 2.0 | 0.8 | 5.0 | Stop-loss distance as a multiple of ATR. |
| TpAtrMult | 3.0 | 1.0 | 8.0 | Take-profit distance as a multiple of ATR. |
| TrailAtrMult | 1.5 | 0.0 | 5.0 | ATR trailing-stop distance. Set to 0 to disable the trail. |
| CooldownBars | 1 | 0 | 20 | Minimum number of bars required between entries to reduce over-trading. |
| Lots | 0.10 | 0.01 | 2.0 | Fixed trade size in lots. |
Recommended Chart Settings
This strategy is timeframe-agnostic by design — it uses whichever symbol and timeframe the chart is set to at test time, with nothing hardcoded. Because the oscillator is range-normalised, the same threshold settings tend to behave consistently across FX majors, metals, and index CFDs.
As a practical starting point for study, many traders test trend-following systems like this on the H1 (1-hour) or H4 (4-hour) timeframes, where trends have room to develop and noise is reduced compared to lower timeframes. A liquid instrument such as EUR/USD is a reasonable candidate for initial exploration. Remember that results will vary across different symbols, timeframes, and market conditions — what looks stable in one regime may behave differently in another. Always test thoroughly on your own broker's data before drawing conclusions.
How to Install on MetaTrader 5
- Download the .ex5 file from the link below
- Copy it to your MT5
MQL5\Expertsfolder - Restart MetaTrader 5 or refresh the Navigator panel
- Drag the EA onto a chart matching the recommended symbol and timeframe
- Configure the input parameters and enable Algo Trading
What to Consider Before Using This EA
The core strength of the Rainbow Oscillator Trend Shift is its layered confirmation. By requiring both a threshold thrust and an agreeing rainbow tilt, it filters out many of the false signals that plague single-moving-average crossover systems. Each additional smoothing pass strips more high-frequency noise, so the rainbow centre is a cleaner trend proxy than one moving average alone. The range-normalised oscillator turns "how far has price broken free" into a single stationary number, which historically makes threshold-based rules more robust across regimes.
That said, this approach has known limitations. As a trend-following system, it is designed to underperform in range-bound or sideways markets, where price repeatedly crosses the rainbow without following through — producing whipsaw entries that are stopped out or exited near breakeven. The heavy smoothing that makes the rainbow clean also introduces lag: entries occur after a move is already underway, so the strategy may enter late and give back some gains when a trend reverses. The zero-cross exit is deliberately loose, which can mean returning meaningful open profit before the position is closed.
The strategy also carries no news filter or session filter, so it may signal during low-liquidity periods or around high-impact economic releases when spreads widen and slippage increases. Parameter choices matter: too low a threshold produces frequent, noisy entries, while too high a threshold may miss trends entirely. None of this makes the strategy "good" or "bad" — it simply means the tool is specialised, and understanding where it may struggle is as important as understanding where it may help.
Risk Management Tips
Sound risk management matters far more than any single indicator setting. Consider these general principles as part of your education:
- Risk a small, fixed fraction per trade. Many educational sources suggest risking no more than 1–2% of account equity on any single position, so that a string of losses does not threaten your capital.
- Size positions to your stop, not the other way around. Let the ATR-based stop distance and your risk percentage determine lot size, rather than choosing an arbitrary lot value.
- Practice on a demo account first. Run the strategy on a demo or simulated account until you understand its behaviour across different market conditions before considering any real capital.
- Understand drawdown. Every strategy experiences losing streaks. Study the maximum peak-to-trough decline in your testing so you know what to expect emotionally and financially.
- Diversify and avoid over-leveraging. Concentrating risk in one instrument or using excessive leverage magnifies both losses and volatility.
- Keep expectations realistic. No strategy wins every trade, and no configuration removes risk. Treat this EA as a structured way to learn, not as a solution.
Risk Warning
Trading foreign exchange, CFDs, and other leveraged financial instruments involves substantial risk of loss and is not suitable for all investors. The strategies and tools discussed on this page are provided for educational purposes only and do not constitute financial advice, investment recommendations, or solicitation to trade. Always consult a qualified financial adviser before making trading decisions. Past backtest performance is not indicative of future results.
Downloads
- Expert Advisor: RainbowOscillatorTrendShift.ex5 (46 downloads)
- Source Code: RainbowOscillatorTrendShift.mq5 (49 downloads)
- Documentation: RainbowOscillatorTrendShift.pdf (59 downloads)