Disclaimer: This article is for educational and informational purposes only. It does not constitute financial or investment advice. Trading forex and CFDs carries significant risk of loss. Past performance of any strategy — including backtests — does not guarantee future results. Never trade with money you cannot afford to lose.
What Is This Strategy?
The Quasimodo Divergence Reversal is a counter-trend, reversal-style trading approach that combines the Quasimodo (QM) price pattern — also known as the "over-and-under" pattern — with RSI divergence as a momentum filter. The Relative Strength Index (RSI) is a classic oscillator that measures the speed of recent price changes on a scale from 0 to 100. This strategy uses it not as an overbought/oversold gauge, but as a way to detect when price and momentum disagree at a fresh swing extreme.
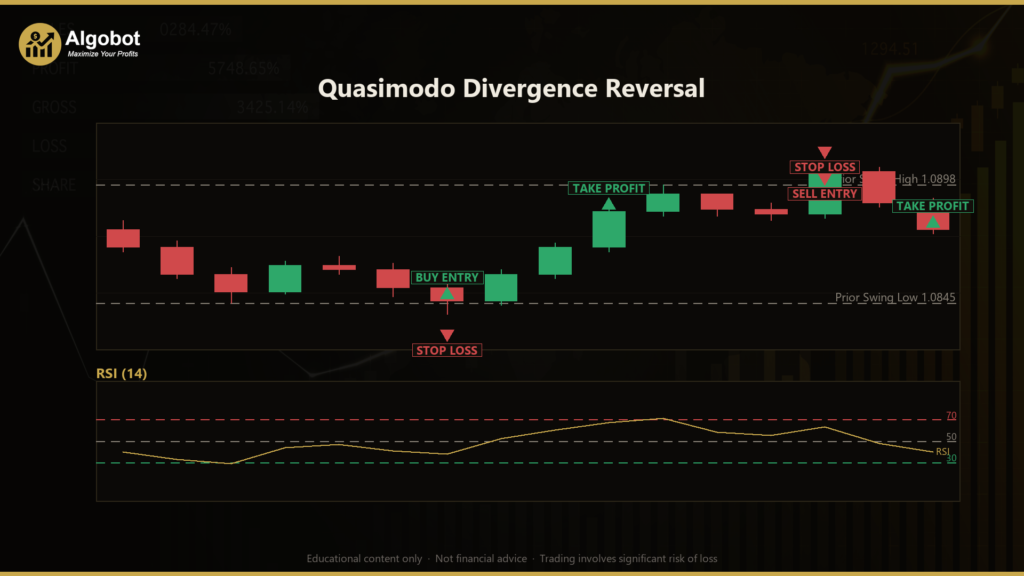
The core idea is simple to describe. In a healthy uptrend, each new higher high should be accompanied by stronger momentum. When price pushes to a higher high than the previous swing but the RSI simultaneously prints a lower high, that is a bearish divergence: the market made a new extreme, but the energy behind it faded. This "failed extension" at a fresh higher high is the classic Quasimodo short signature. The mirror image — a lower low in price paired with a higher RSI low — forms the bullish setup for a potential long.
This strategy is designed for traders who want to study reversal trading and momentum divergence in a rules-based, non-repainting format. It is best understood as a learning tool for exploring how swing structure and oscillator behaviour interact, rather than as any kind of income opportunity. If you are curious about how automated pattern detection works, or how ATR-based risk sizing is applied to reversal setups, this Quasimodo Trading Strategy offers a clear, transparent example to analyse.
How It Works
The strategy locates swing points using confirmed 5-bar fractals. A fractal is a small local peak or trough: the centre bar must be higher (or lower) than the two bars on each side. Because the centre is only evaluated after two later bars have closed, the swing is confirmed and does not repaint — it will not appear and disappear as new ticks arrive.
Each newly confirmed fractal is compared to the previous same-side fractal to check for divergence. Here is how the strategy signals:
- Short (bearish reversal): A new up-fractal forms a higher high than the prior up-fractal — by at least
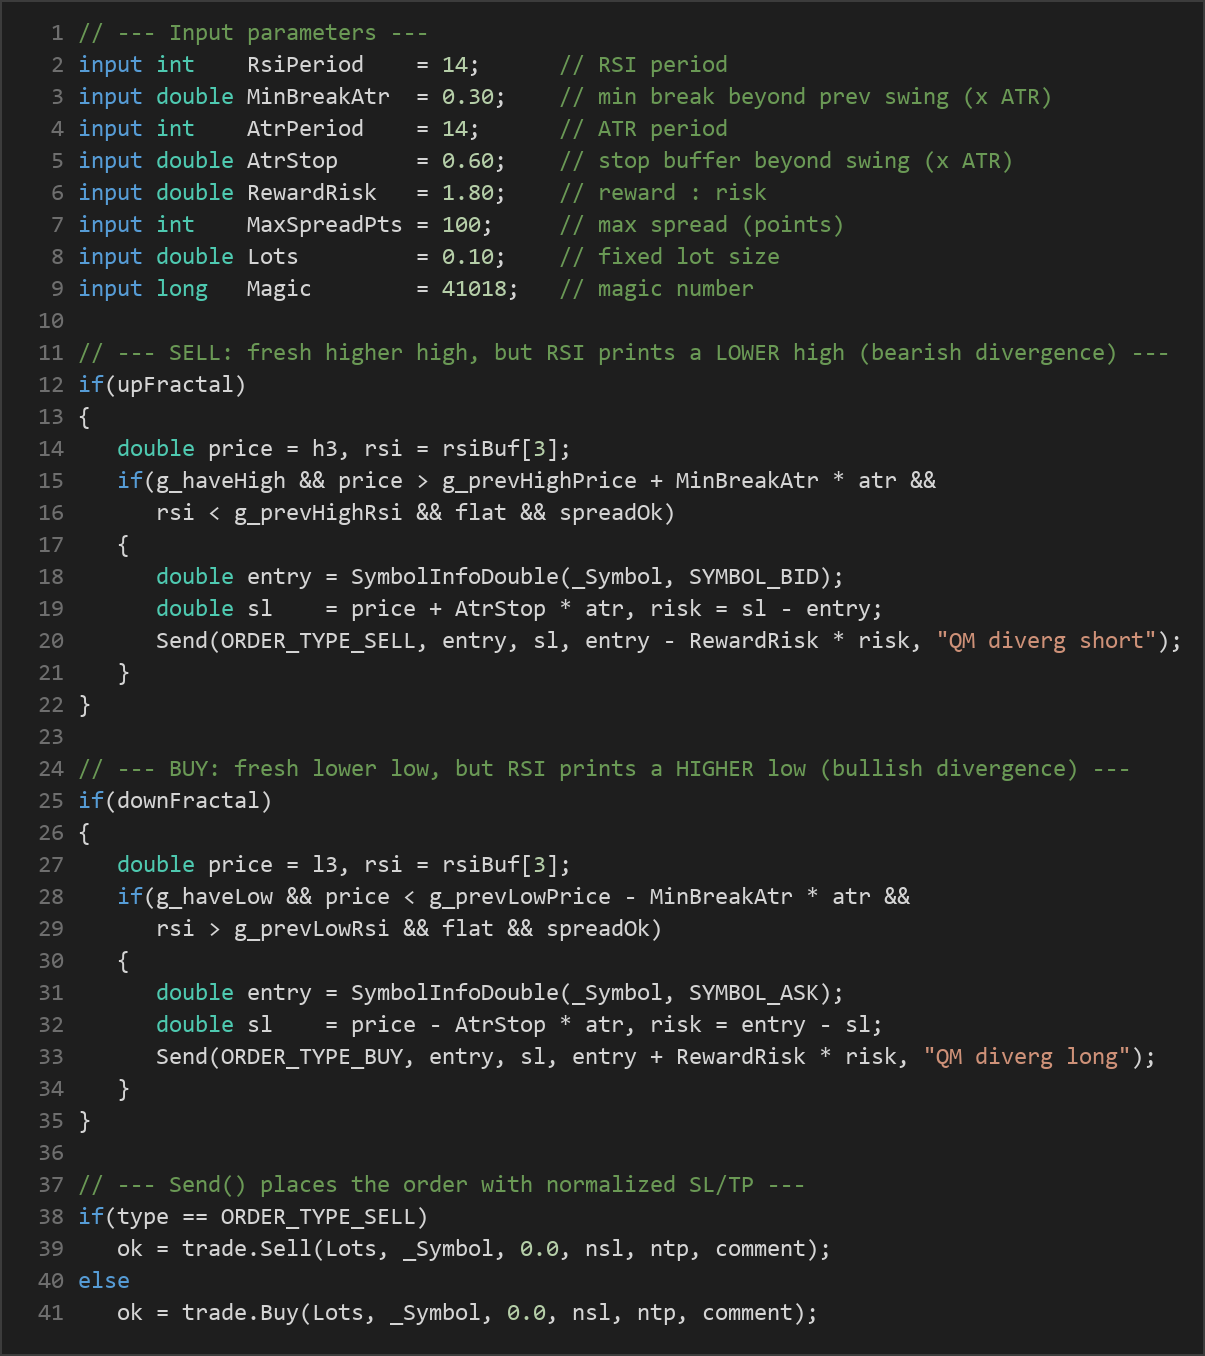
MinBreakAtr × ATR— while its RSI value is lower than the prior up-fractal's RSI. This price-up / momentum-down disagreement signals possible exhaustion, and the strategy sells. - Long (bullish reversal): A new down-fractal forms a lower low than the prior down-fractal (by the same ATR-scaled margin) while its RSI value is higher than before. This signals possible seller exhaustion, and the strategy buys.
- Trade filters: A new signal is only taken when there is no open position for the strategy's Magic number and when the current spread is at or below
MaxSpreadPts. This avoids stacking trades and skips setups during unusually wide, low-quality spread conditions.
Exit and risk logic is handled entirely with the Average True Range (ATR), a volatility measure of how far price typically moves per bar:
- Stop-loss: For a short, the stop is placed above the fresh swing high at
high + AtrStop × ATR. For a long, it sits below the fresh swing low atlow − AtrStop × ATR. Scaling the buffer by ATR means the stop adapts to current volatility rather than using a fixed distance. - Take-profit: The target is set by the
RewardRiskratio. The strategy measures the risk (entry-to-stop distance) and projects the take-profit that same multiple in the profitable direction. With the default 1.80, the target distance is 1.8× the stop distance. - One position at a time: Only a single position per Magic number is allowed, so the strategy fully resolves one trade before considering the next.
The MinBreakAtr requirement is important: it ensures the new swing meaningfully exceeds the previous one before a divergence qualifies. This helps filter out insignificant double-tops or double-bottoms that would otherwise generate noise.
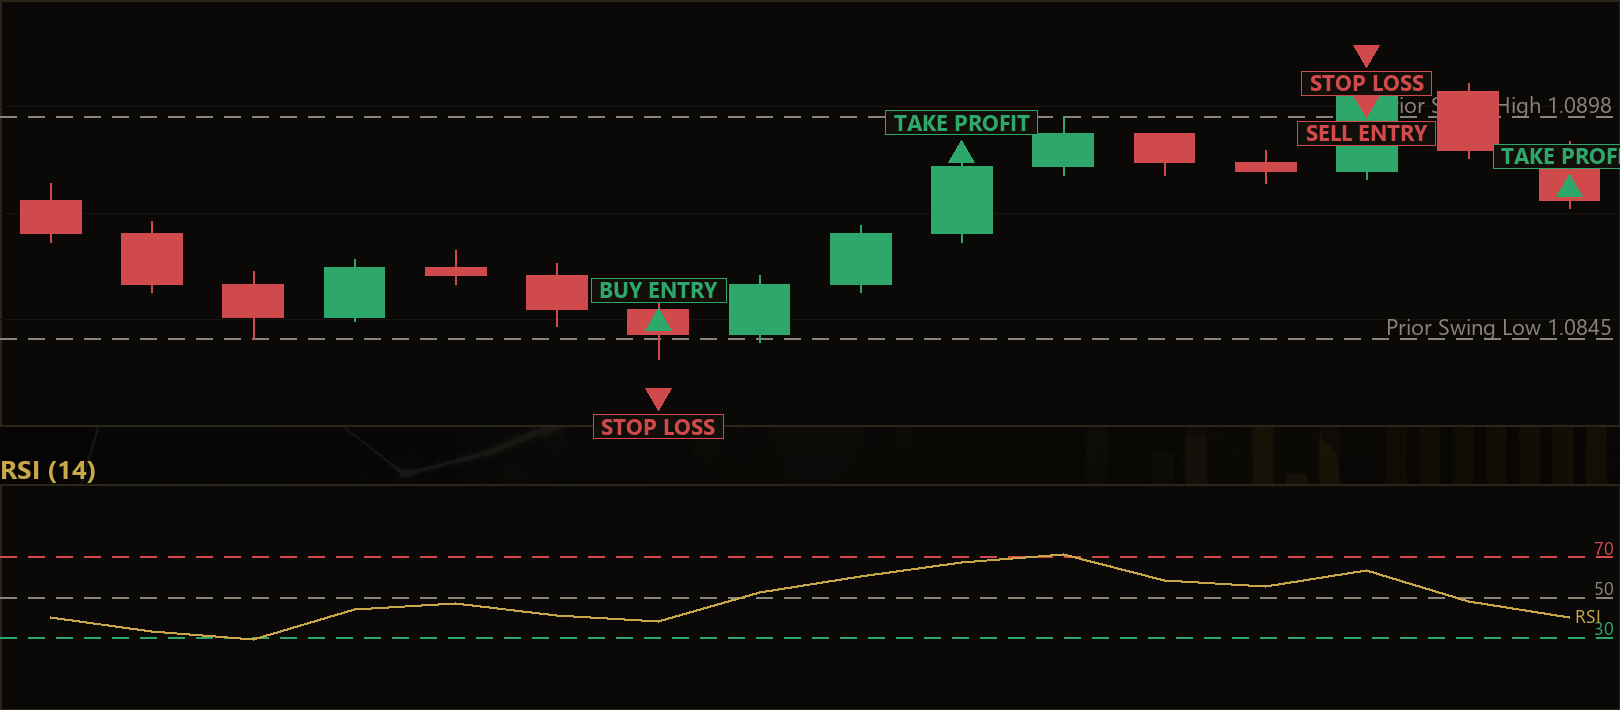
Strategy Parameters
| Parameter | Default | Min | Max | Description |
|---|---|---|---|---|
| RsiPeriod | 14 | 4 | 40 | Number of bars used to calculate the RSI momentum oscillator. |
| MinBreakAtr | 0.30 | 0.00 | 3.00 | Minimum distance (in ATR multiples) a new swing must exceed the previous swing before a divergence qualifies. |
| AtrPeriod | 14 | 5 | 50 | Number of bars used to calculate the ATR volatility measure. |
| AtrStop | 0.60 | 0.10 | 3.00 | Stop-loss buffer beyond the swing extreme, expressed in ATR multiples. |
| RewardRisk | 1.80 | 0.50 | 5.00 | Take-profit distance as a multiple of the stop-loss (risk) distance. |
| MaxSpreadPts | 100 | 5 | 400 | Maximum allowable spread, in points, for a new trade to be opened. |
| Lots | 0.10 | 0.01 | 1.00 | Fixed trade volume in lots. |
| Magic | 41018 | 0 | 9,999,999 | Unique identifier so the strategy manages only its own positions. |
Recommended Chart Settings
This Quasimodo Divergence Reversal strategy was designed with FX major pairs and gold (XAU/USD) in mind, on the M15 to H1 timeframes. These conditions tend to produce clean, well-defined swing structure where fractal-based divergence is easier to interpret. The strategy operates on the primary chart timeframe only — it does not reference higher or lower timeframes.
Keep in mind that reversal strategies behave very differently across market regimes. A setting that produces reasonable-looking signals on one symbol or during one period may perform poorly on another. Results will vary across different market conditions, and any parameter set should be studied carefully in a testing environment before it is trusted.
How to Install on MetaTrader 5
- Download the
QuasimodoDivergenceReversal.ex5file from the link below - Copy it to your MT5
MQL5\Expertsfolder - Restart MetaTrader 5 or refresh the Navigator panel
- Drag the EA onto a chart matching the recommended symbol and timeframe
- Configure the input parameters and enable Algo Trading
What to Consider Before Using This EA
Every strategy has strengths and limitations, and an honest assessment matters more than optimism.
Strengths of this approach:
- The use of confirmed, non-repainting fractals means signals are stable — what you see in a backtest is what would have been generated live at the same bar.
- Requiring momentum divergence in addition to a raw price extreme filters out many setups that are simply trend continuation, which is a common weakness of naive reversal systems.
- ATR-scaled stops and targets allow the strategy to adapt to changing volatility rather than relying on fixed distances that quickly become stale.
Known limitations:
- Reversal strategies inherently trade against the prevailing move. In a strong, persistent trend, higher highs with weakening RSI can continue for a long time before any actual reversal — meaning divergence signals may repeatedly be stopped out. This is the classic pitfall: shorting a higher high that has no follow-through can simply be fighting the trend.
- Because fractals need bars on both sides to confirm, entries occur a few bars after the actual swing peak, so some of the initial reversal move is missed.
- The strategy takes one position at a time and uses a fixed lot size, so it does not scale exposure to account equity or pyramid into winners.
- Divergence is a probabilistic condition, not a certainty. It may indicate weakening momentum, but momentum can just as easily re-accelerate.
The strategy is likely to underperform in strongly trending, low-volatility grind conditions and during erratic news-driven spikes where swing structure breaks down. It is best studied as an educational illustration of divergence-based reversal logic.
Risk Management Tips
Sound risk management is the foundation of any responsible approach to the markets, and it matters far more than the entry signal itself.
- Size positions conservatively. A widely taught guideline is to risk no more than 1–2% of your account equity on any single trade. Since this strategy uses a fixed lot size, calculate what that lot represents relative to your stop distance and account balance before deploying it.
- Use a demo account first. Test the strategy in a risk-free simulated environment until you thoroughly understand how and when it generates signals.
- Understand drawdown. Reversal strategies can experience clusters of consecutive losses when they repeatedly attempt to catch a trend that keeps extending. Study the depth and duration of drawdown before committing real capital.
- Respect the spread filter. Keep
MaxSpreadPtsrealistic for your broker and symbol so trades are only taken in reasonable conditions. - Never risk money you cannot afford to lose, and treat every parameter change as a hypothesis to be tested, not a shortcut.
Risk Warning
Trading foreign exchange, CFDs, and other leveraged financial instruments involves substantial risk of loss and is not suitable for all investors. The strategies and tools discussed on this page are provided for educational purposes only and do not constitute financial advice, investment recommendations, or solicitation to trade. Always consult a qualified financial adviser before making trading decisions. Past backtest performance is not indicative of future results.
Downloads
- Expert Advisor: QuasimodoDivergenceReversal.ex5 (46 downloads)
- Source Code: QuasimodoDivergenceReversal.mq5 (45 downloads)
- Documentation: QuasimodoDivergenceReversal.pdf (54 downloads)