Disclaimer: This article is for educational and informational purposes only. It does not constitute financial or investment advice. Trading forex and CFDs carries significant risk of loss. Past performance of any strategy — including backtests — does not guarantee future results. Never trade with money you cannot afford to lose.
What Is This Strategy?
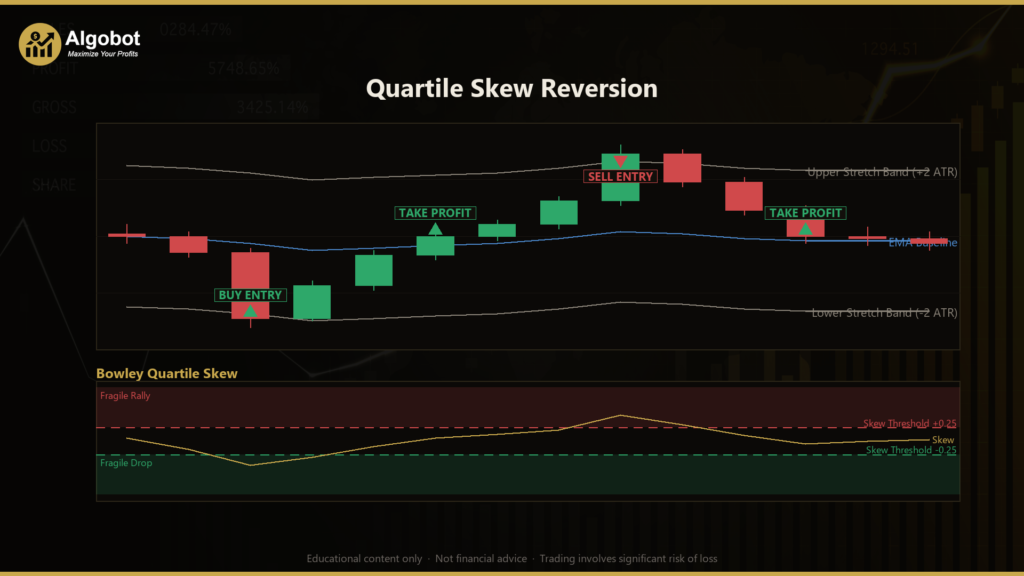
Quartile Skew Reversion is a mean-reversion trading strategy built around Bowley (quartile) skewness — a robust, outlier-resistant measure of how lopsided a distribution is. Instead of asking only "how far has price stretched from fair value?", this strategy also asks "what kind of move produced that stretch?" It combines that skewness reading with an EMA baseline (Exponential Moving Average — a moving average that weights recent prices more heavily), an ATR filter (Average True Range — a common gauge of volatility), and a flat-market regime check. The result is a fading system that only looks to trade against overextended moves it judges to be fragile.
The core idea is that not every stretch away from a baseline deserves to be faded. A large move can be durable — created by broad participation, where many bars each push a little in the same direction — or fragile, where a handful of oversized spike bars did nearly all the work while the rest of the window drifted. Durable moves tend to keep going; fragile ones tend to snap back. Bowley skewness, because it is computed from quartiles rather than from squared deviations, can flag the presence of a few spike bars without being distorted by them. That is exactly the property a spike-detector needs.
This strategy is best understood as a learning tool for traders who want to study distribution-shape analysis, volatility-normalized entries, and regime filtering. It is designed for range-bound, non-trending conditions, and it deliberately stands aside when the market is trending. If you are exploring how statistical properties of returns — beyond simple price levels — can be used to filter trade signals, this is an instructive example. It is not a shortcut, and like any mean-reversion approach it carries the inherent risk of a genuine breakout running against a faded position.
How It Works
The strategy evaluates the market once per freshly closed bar and requires three independent conditions to align before it acts. All calculations use the primary chart symbol and timeframe.
- The fragility filter (Bowley skew): The strategy takes the last
ReturnWindowclose-to-close returns, sorts them, and computes the first, second, and third quartiles (Q1, Q2, Q3). It then calculates Bowley skewness asSK = (Q3 + Q1 − 2·Q2) / (Q3 − Q1), a value bounded between −1 and +1. A large positive value signals a long right tail (an up-move that leaned on a few spikes); a large negative value signals a long left tail (a down-move that leaned on a few down-spikes). Either extreme flags a fragile move. - The stretch filter (ATR distance from baseline): Price must be over- or under-extended relative to the EMA baseline. The strategy measures the signed distance
Close − baselineand compares it toEntryStretch × ATR. Only when price has stretched at least that many ATR multiples away does a setup become possible. - The regime filter (flat-market guard): The strategy measures the EMA baseline's slope over
SlopeLookbackbars and normalizes it by ATR. If the absolute normalized slope is inside theSlopeGuardband, the market is treated as flat and fade-able. If the slope is steeper than the guard, the market is trending and the strategy stands aside — this is what stops it from fighting a real trend.
When these align, the strategy signals a trade:
- Long setup:
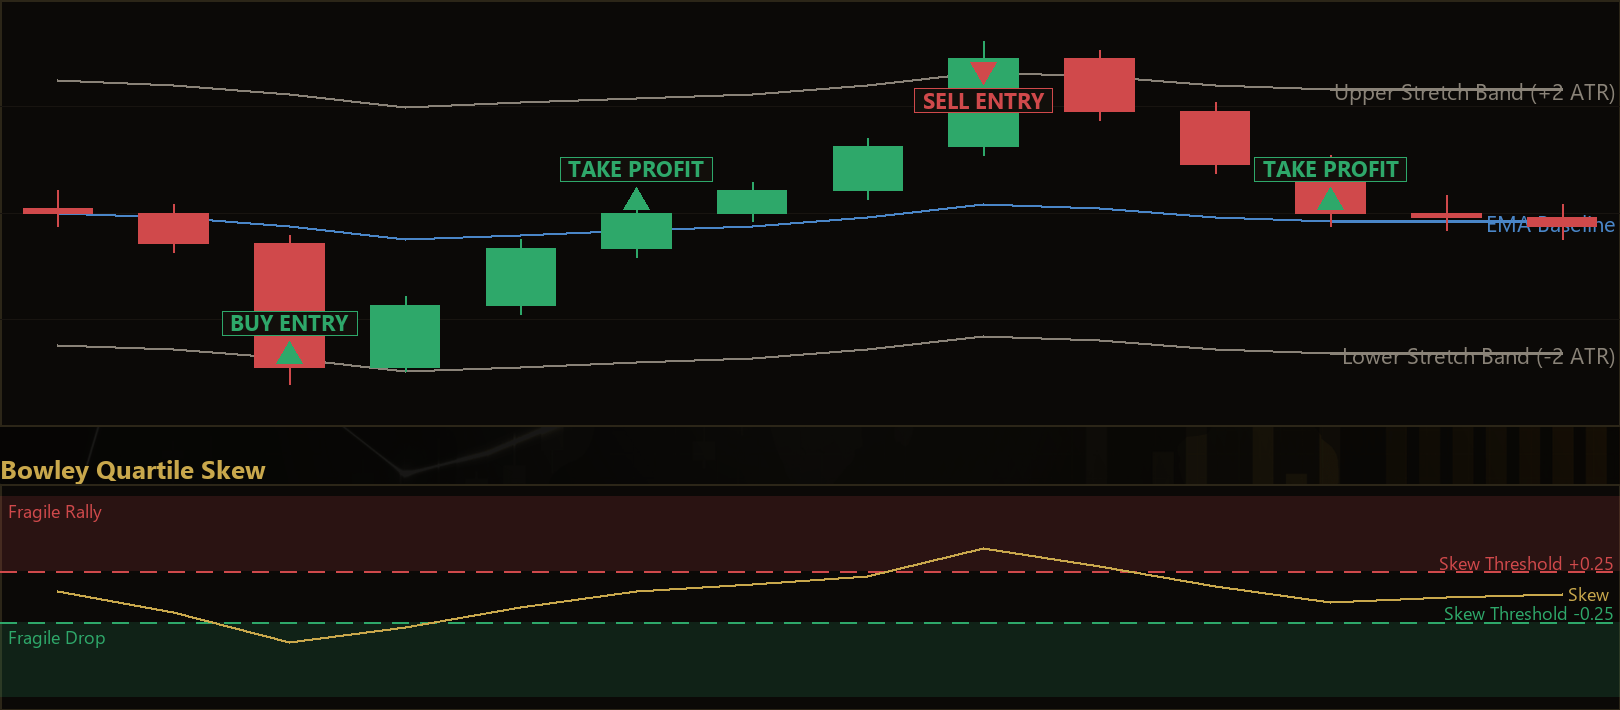
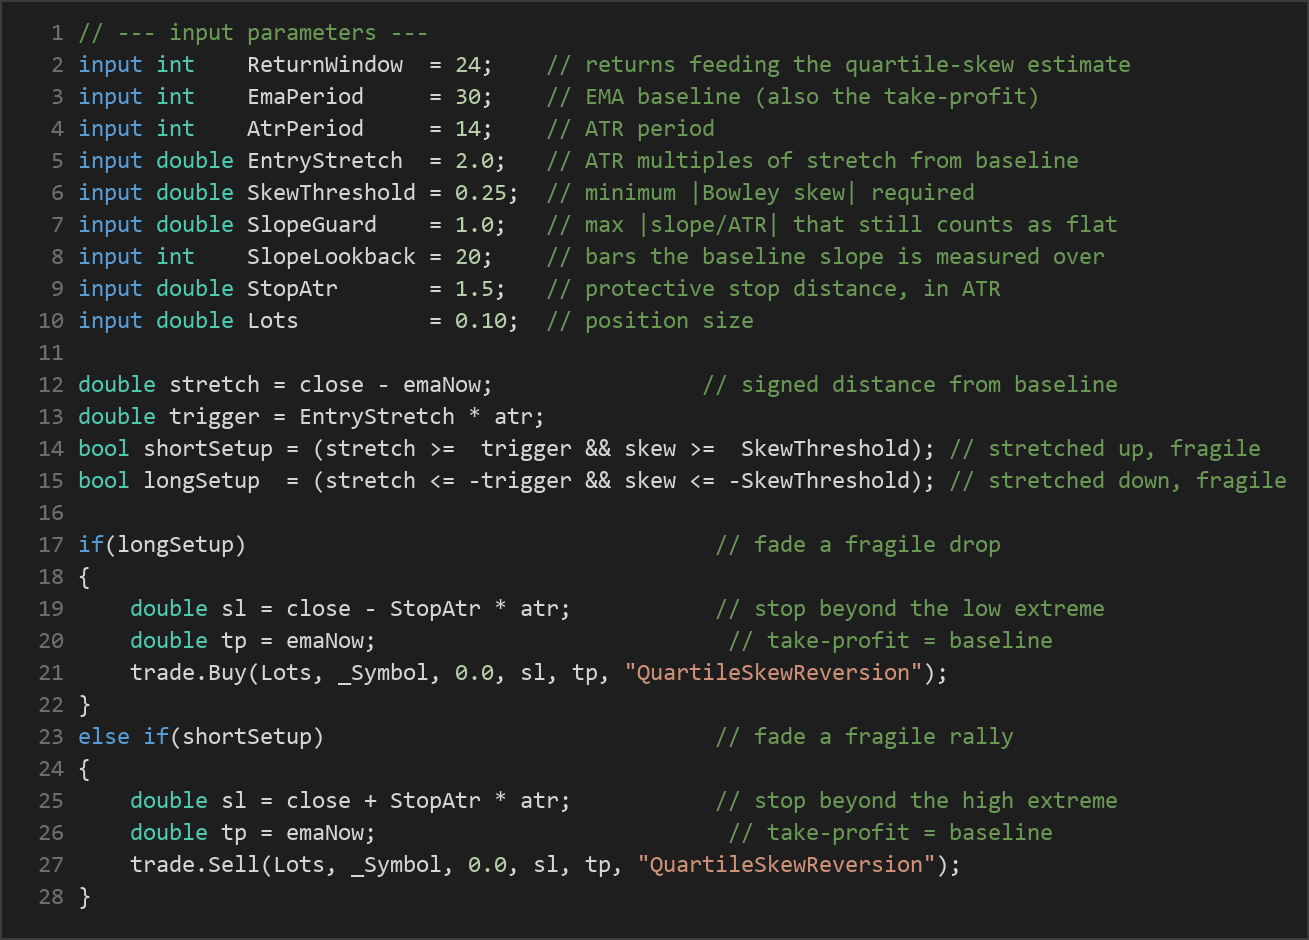
Close ≤ baseline − EntryStretch·ATRandSK ≤ −SkewThresholdand the regime is flat. The strategy signals a buy — price is stretched down and the drop looks spike-driven and fragile. - Short setup:
Close ≥ baseline + EntryStretch·ATRandSK ≥ +SkewThresholdand the regime is flat. The strategy signals a sell — price is stretched up and the rally looks spike-driven and fragile.
Exit, stop-loss, and take-profit logic:
- Take-profit is placed at the EMA baseline itself — the strategy is betting that price reverts to the mean, so the baseline is its target.
- Stop-loss is a tight ATR-based stop set
StopAtr × ATRbeyond the extreme (below the low for longs, above the high for shorts). This is the key defense: if the move turns out to be a real breakout rather than a fragile spike, the position is cut quickly. - One position at a time: The strategy holds only a single position per magic number and lets the stop-loss and take-profit manage the exit, rather than adding to or averaging into positions. A small safeguard also ensures the take-profit never sits on the wrong side of the entry.
Strategy Parameters
| Parameter | Default | Min | Max | Description |
|---|---|---|---|---|
| ReturnWindow | 24 | 8 | 60 | Number of close-to-close returns used to estimate the quartile-skew (fragility) reading. |
| EmaPeriod | 30 | 10 | 100 | Period of the EMA baseline that price reverts toward — also used as the take-profit level. |
| AtrPeriod | 14 | 5 | 30 | Period of the ATR volatility measure used for the stretch, slope normalization, and stop. |
| EntryStretch | 2.0 | 1.0 | 4.0 | ATR multiples price must be stretched from the baseline before a fade is considered. |
| SkewThreshold | 0.25 | 0.0 | 0.8 | Minimum absolute Bowley skew (fragility) required, in the same direction as the stretch. |
| SlopeGuard | 1.0 | 0.3 | 3.0 | Maximum absolute baseline slope (normalized by ATR) that still counts as a flat, fade-able regime. |
| SlopeLookback | 20 | 5 | 60 | Number of bars over which the baseline slope is measured. |
| StopAtr | 1.5 | 0.5 | 4.0 | Protective stop-loss distance beyond the entry extreme, in ATR multiples. |
| Lots | 0.10 | 0.01 | 1.0 | Position size in lots. |
Recommended Chart Settings
This strategy is a single-timeframe system and operates entirely on the chart's primary symbol and timeframe. Because it is a mean-reversion approach that thrives in range-bound conditions, it is generally most instructive on major forex pairs — instruments such as EUR/USD or GBP/USD that frequently oscillate within ranges — on intraday timeframes like the M15, M30, or H1 charts, where enough bars accumulate to make the quartile-skew estimate meaningful.
That said, the "best" chart is something you should study for yourself rather than assume. The default parameters were chosen as a balanced starting point, not an optimized configuration. Different symbols, timeframes, and volatility environments will produce very different behavior, and a setup that looks stable in one market condition may struggle in another. Treat any single chart setting as a hypothesis to test on a demo account, not a fixed rule.
How to Install on MetaTrader 5
- Download the .ex5 file from the link below
- Copy it to your MT5
MQL5\Expertsfolder - Restart MetaTrader 5 or refresh the Navigator panel
- Drag the EA onto a chart matching the recommended symbol and timeframe
- Configure the input parameters and enable Algo Trading
What to Consider Before Using This EA
Like every strategy, Quartile Skew Reversion has clear strengths and equally clear limitations, and understanding both is the point of studying it.
Strengths of this approach:
- Outlier-robust signal. Bowley skewness is built from quartiles, so a single monstrous spike bar cannot dominate the reading the way it would with a conventional moment-based skew. This makes the fragility filter more stable than many alternatives.
- Layered confirmation. Requiring three independent conditions — stretch, fragility, and a flat regime — reduces the number of low-quality signals compared with a naive "fade the extreme" rule.
- Defined risk. Every position ships with a predefined ATR stop and a baseline take-profit, so risk is bounded on each trade and the exit logic is fully mechanical.
Known limitations:
- Mean reversion fails in trends. The fundamental weakness of any fading system is a strong directional breakout. The flat-regime guard is designed to avoid this, but no filter is perfect, and a trend that begins inside the guard band can still run against a position.
- Regime misclassification. The slope-based flat-market check is an approximation. Markets can transition from range to trend faster than a lookback-based slope can register, occasionally letting a trade open just as conditions shift.
- Parameter sensitivity. With nine inputs, the strategy can be over-fit to historical data. Values that look ideal on past charts may not generalize, so robustness across settings matters more than any single "best" combination.
- Thin or erratic windows. If the return window is degenerate (for example, an interquartile range of zero during a dead market), the strategy correctly stands aside — but that also means it produces no signals during unusually quiet periods.
This is a tool for learning how distribution shape, volatility, and regime filtering interact — not a set-and-forget solution. Study its behavior, understand why each condition exists, and test it thoroughly before drawing any conclusions.
Risk Management Tips
Sound risk management matters far more than any single entry signal. Whatever strategy you study, keep these general principles in mind:
- Risk only a small fraction per trade. A widely cited guideline is to risk no more than 1–2% of your account on any single position. Size your lots so that the distance to your stop-loss represents that small fraction, not a round-number lot size chosen at random.
- Understand drawdown. Even a well-designed mean-reversion system will experience losing streaks. Know the maximum drawdown you are willing to tolerate before you trade, and stop if you approach it.
- Start on a demo account. Run any EA in a risk-free demo environment first, across a variety of market conditions, until you genuinely understand how it behaves — including how it handles breakouts and quiet markets.
- Diversify and avoid overexposure. Concentrating risk in a single symbol or a single strategy magnifies the impact of one bad regime. Spread risk thoughtfully.
- Keep expectations realistic. No strategy wins every trade. The goal of studying a system like this is to understand its logic and edges, not to expect a specific outcome.
Risk Warning
Trading foreign exchange, CFDs, and other leveraged financial instruments involves substantial risk of loss and is not suitable for all investors. The strategies and tools discussed on this page are provided for educational purposes only and do not constitute financial advice, investment recommendations, or solicitation to trade. Always consult a qualified financial adviser before making trading decisions. Past backtest performance is not indicative of future results.
Downloads
- Expert Advisor: QuartileSkewReversion.ex5 (44 downloads)
- Source Code: QuartileSkewReversion.mq5 (50 downloads)
- Documentation: QuartileSkewReversion.pdf (47 downloads)