Disclaimer: This article is for educational and informational purposes only. It does not constitute financial or investment advice. Trading forex and CFDs carries significant risk of loss. Past performance of any strategy — including backtests — does not guarantee future results. Never trade with money you cannot afford to lose.
What Is This Strategy?
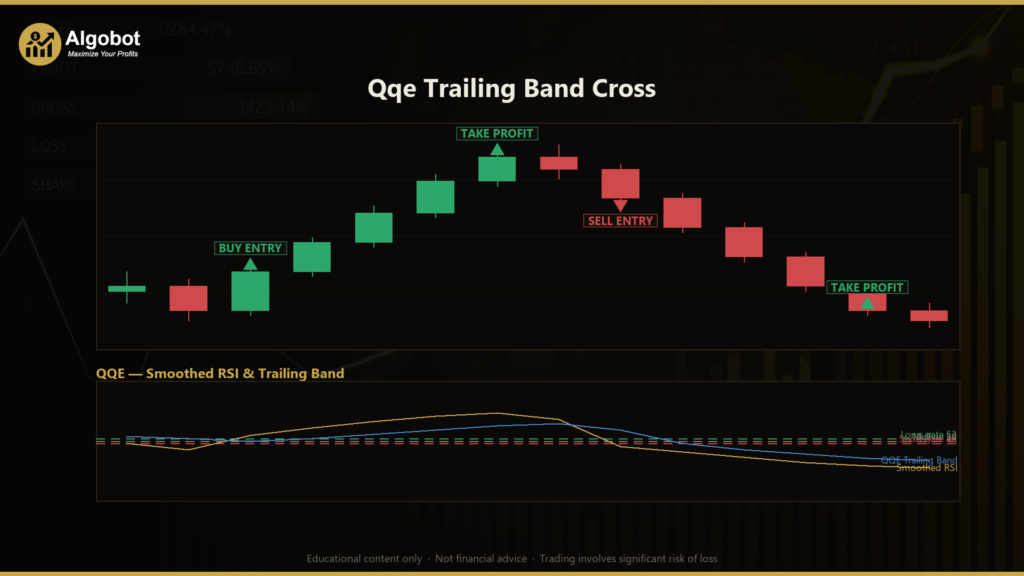
The Qqe Trailing Band Cross strategy is a momentum and trend-following approach built on the Quantitative Qualitative Estimation (QQE) method — a technique that applies "supertrend" logic not to price, but to a doubly-smoothed Relative Strength Index (RSI). RSI is a classic momentum oscillator that measures the speed and magnitude of recent price changes on a 0–100 scale. By wrapping a self-adjusting trailing band around a smoothed RSI line, the QQE method aims to filter out the small, noisy oscillations that often cause a raw RSI to whipsaw, while still reacting promptly when momentum genuinely shifts.
At its core, the strategy watches for the moment when the smoothed RSI crosses through its own trailing band — an event the strategy interprets as a change in momentum regime. The band's width "breathes" with each instrument's RSI volatility, because it is derived from a smoothed average of the RSI's own bar-to-bar movement (an "ATR of RSI"). This adaptive quality is what distinguishes QQE from a plain RSI threshold system: the trigger level adjusts itself to how choppy or how smooth momentum has recently been.
As a learning tool, the Qqe Trailing Band Cross is well suited to traders who want to study how oscillator smoothing, adaptive bands, and midline confirmation can be combined into a single, rules-based entry model. It is designed for trending market conditions, where momentum builds and sustains in one direction. It is best treated as an educational example of adaptive momentum logic rather than a turnkey solution, and it is most instructive for those who already understand basic RSI behavior and want to see a more sophisticated construction in action.
How It Works
The strategy processes each completed bar (candle) and maintains a recursive QQE state that carries forward from one bar to the next. Here is how the logic unfolds in plain English:
- Smoothed RSI foundation: A Wilder RSI is computed over the closing prices, then smoothed with an exponential moving average (EMA) to produce a cleaner "RsiMa" line. This is the primary signal line the strategy tracks.
- Adaptive band width: The absolute bar-to-bar change of the smoothed RSI is treated as an "ATR of RSI." This value is smoothed twice with EMAs and multiplied by the
QqeFactorto form a band half-width (called "Dar"). Because it is derived from recent RSI movement, the band automatically widens in volatile momentum and narrows in calm conditions. - Ratcheting trailing bands: An upper band and a lower band are placed around the smoothed RSI. Like a supertrend, each band only ratchets in the trend's favor — the lower band never moves down during an uptrend, and the upper band never moves up during a downtrend.
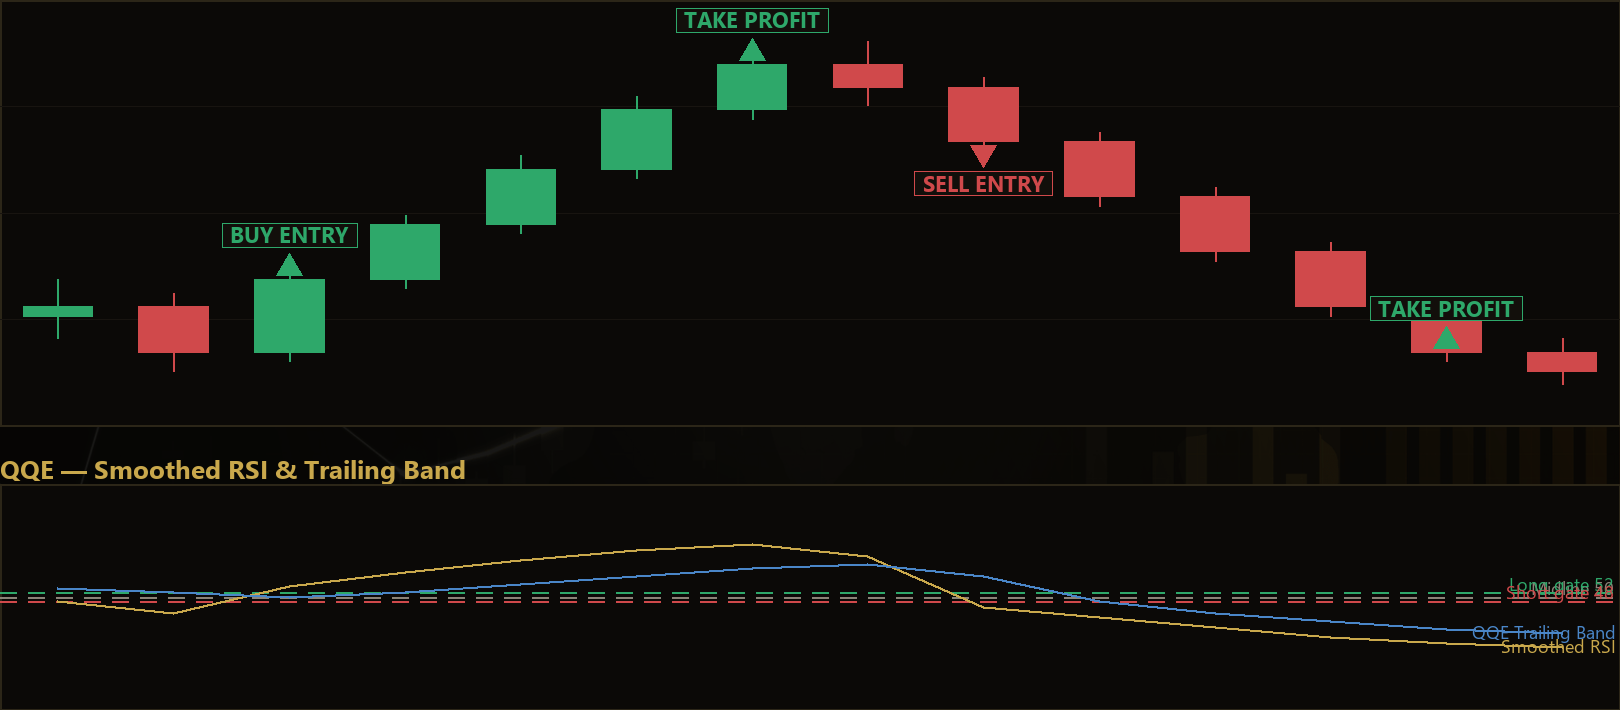
- Trend flip detection: The strategy signals a trend flip up when the smoothed RSI crosses decisively above the prior upper band, and a trend flip down when it crosses below the prior lower band.
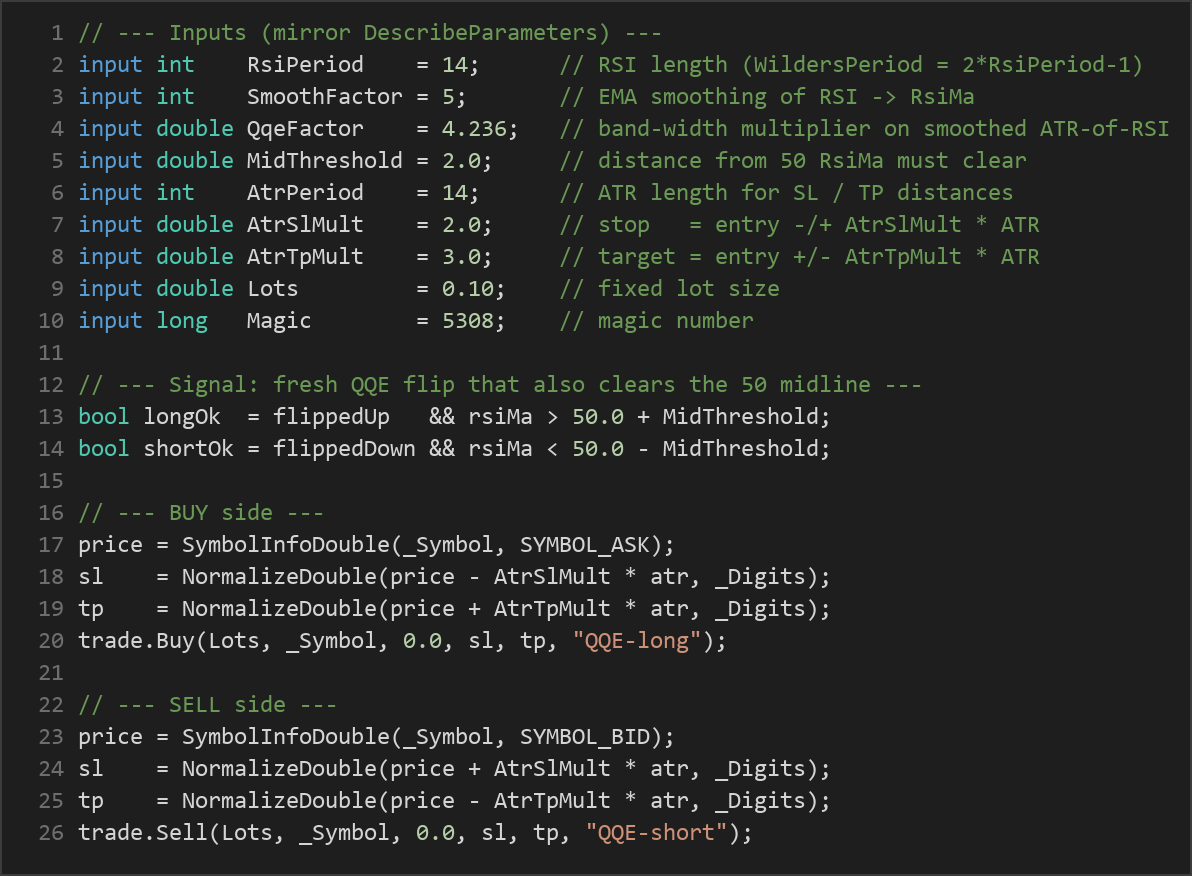
- Long entry: The strategy signals a long setup when the QQE trend flips up and the smoothed RSI is above 50 +
MidThreshold. The midline gate keeps entries on the momentum-confirming side of neutral. - Short entry: The strategy signals a short setup when the QQE trend flips down and the smoothed RSI is below 50 −
MidThreshold. - Midline confirmation: By requiring the smoothed RSI to clear a set distance from the neutral 50 level, the strategy trims low-conviction flips that occur while RSI hovers near the middle of its range.
- One position at a time: Only a single position per magic number is held at once. If a position is already open, no new entry is taken.
- Stop-loss logic: Once an entry triggers, the stop-loss is placed at a distance of
AtrSlMult× ATR away from the entry price. ATR (Average True Range) measures recent price volatility, so the stop adapts to current market conditions. - Take-profit logic: The take-profit is placed at a distance of
AtrTpMult× ATR from entry. With the default settings, the target sits farther from entry than the stop, reflecting a reward-to-risk skew greater than 1:1.
A warmup period is enforced before any signals are trusted, allowing the recursive smoothers to settle so that early, unstable readings do not generate premature entries.
Strategy Parameters
| Parameter | Default | Min | Max | Description |
|---|---|---|---|---|
| RsiPeriod | 14 | 5 | 30 | Length of the Wilder RSI. The internal band-smoothing period is derived as 2 × RsiPeriod − 1. |
| SmoothFactor | 5 | 2 | 12 | EMA smoothing factor applied to the raw RSI to form the smoothed RSI (RsiMa). Higher values yield a smoother, slower line. |
| QqeFactor | 4.236 | 2.0 | 6.0 | Band-width multiplier applied to the smoothed ATR-of-RSI. The classic QQE default is 4.236; larger values widen the band and reduce flip frequency. |
| MidThreshold | 2.0 | 0.0 | 15.0 | Distance from the 50 midline that the smoothed RSI must clear for a signal to count. Larger values demand stronger momentum confirmation. |
| AtrPeriod | 14 | 7 | 30 | ATR length used to size the stop-loss and take-profit distances. |
| AtrSlMult | 2.0 | 1.0 | 4.0 | Stop-loss distance as a multiple of ATR (entry −/+ AtrSlMult × ATR). |
| AtrTpMult | 3.0 | 1.0 | 6.0 | Take-profit distance as a multiple of ATR (entry +/− AtrTpMult × ATR). |
| Lots | 0.10 | 0.01 | 1.0 | Fixed lot size used for each position. |
Recommended Chart Settings
The Qqe Trailing Band Cross is a single-timeframe strategy — every calculation uses whichever timeframe the chart is set to, so the strategy runs on the timeframe you select at load time. Because it is built on momentum regime changes, it tends to be most coherent on intermediate timeframes such as the H1 (1-hour) or H4 (4-hour) charts, where trend flips are less frequent and less noisy than on very low timeframes.
For the instrument, major forex pairs with reasonable liquidity and clean trending behavior — for example EUR/USD — are a sensible starting point for study. That said, the adaptive band responds to each instrument's own RSI volatility, so behavior will differ from one symbol and timeframe to another. Always keep in mind that results will vary across different market conditions, and that a setting which looks appropriate in one regime may behave very differently in another. Treat the recommended settings as a starting point for your own testing, not a fixed prescription.
How to Install on MetaTrader 5
- Download the .ex5 file from the link below
- Copy it to your MT5
MQL5\Expertsfolder - Restart MetaTrader 5 or refresh the Navigator panel
- Drag the EA onto a chart matching the recommended symbol and timeframe
- Configure the input parameters and enable Algo Trading
What to Consider Before Using This EA
Every strategy has trade-offs, and understanding them is central to using this EA responsibly as a learning tool.
Strengths of this approach:
- The adaptive band adjusts to each instrument's RSI volatility, which can reduce the whipsaws that plague fixed-threshold RSI systems.
- The midline gate adds a second layer of confirmation, helping to filter out low-conviction flips near neutral momentum.
- ATR-based stops and targets scale risk with current volatility rather than using fixed pip distances.
Known limitations:
- Like most trend and momentum systems, the strategy is designed for trending conditions. In range-bound or sideways markets, momentum flips can occur frequently without follow-through, which historically tends to produce a series of small losses.
- The QQE construction is inherently lagging — smoothing the RSI twice and wrapping it in a smoothed band means signals arrive after momentum has already begun to turn. This is the price paid for noise reduction.
- Because only one position is held at a time, the strategy may sit out extended moves if it is already in a trade or waiting for a fresh flip.
- Parameter sensitivity is real: changing
QqeFactor,SmoothFactor, orMidThresholdcan meaningfully alter how often the strategy trades and how it behaves across regimes.
The most honest way to view this EA is as a structured example of adaptive momentum logic. It may indicate momentum regime changes with a degree of noise filtering, but it does not anticipate reversals and it cannot distinguish a genuine trend from a temporary burst that fades. No indicator can.
Risk Management Tips
Sound risk management matters more than any single entry rule. Consider these general principles as you study this strategy:
- Risk a small fraction per trade. A common guideline is to risk no more than 1–2% of account equity on any single position. Adjust the
Lotsparameter so that the ATR-based stop distance corresponds to that fraction of your account. - Use a demo account first. Test the EA on a demo or paper-trading account across many weeks and varied market conditions before considering any live use. This lets you observe its behavior without financial consequences.
- Understand drawdown. Even a well-constructed strategy can experience long strings of losing trades. Study how deep and how long the drawdowns get, and be honest with yourself about whether you could tolerate them.
- Diversify your study. Relying on a single strategy or a single instrument concentrates risk. Understanding correlation and diversification is part of a complete risk framework.
- Match position size to your account. Fixed-lot sizing means a lot that is reasonable for one account size may be far too large for another. Always scale to your own capital and risk tolerance.
- Keep expectations grounded. Backtests and historical behavior describe the past; live markets can and do behave differently. Treat every result as information for learning, not as a promise.
Risk Warning
Trading foreign exchange, CFDs, and other leveraged financial instruments involves substantial risk of loss and is not suitable for all investors. The strategies and tools discussed on this page are provided for educational purposes only and do not constitute financial advice, investment recommendations, or solicitation to trade. Always consult a qualified financial adviser before making trading decisions. Past backtest performance is not indicative of future results.
Downloads
- Expert Advisor: QqeTrailingBandCross.ex5 (37 downloads)
- Source Code: QqeTrailingBandCross.mq5 (34 downloads)
- Documentation: QqeTrailingBandCross.pdf (37 downloads)