
Disclaimer: This article is for educational and informational purposes only. It does not constitute financial or investment advice. Trading forex and CFDs carries significant risk of loss. Past performance of any strategy — including backtests — does not guarantee future results. Never trade with money you cannot afford to lose.
What Is This Strategy?
The Price Density Trend Breakout is an automated MetaTrader 5 strategy built around Kaufman's Price Density, a market-geometry indicator that measures how "packed" recent price action is inside its own high-low range. Price Density belongs to the family of trend-versus-chop filters, but instead of relying on close-to-close efficiency or moving-average slope, it compares the total distance price travelled against the net ground it actually covered. That makes this a breakout-from-consolidation strategy: it is designed to detect the exact moment a sideways, overlapping market stops churning and begins to travel in a straight line.
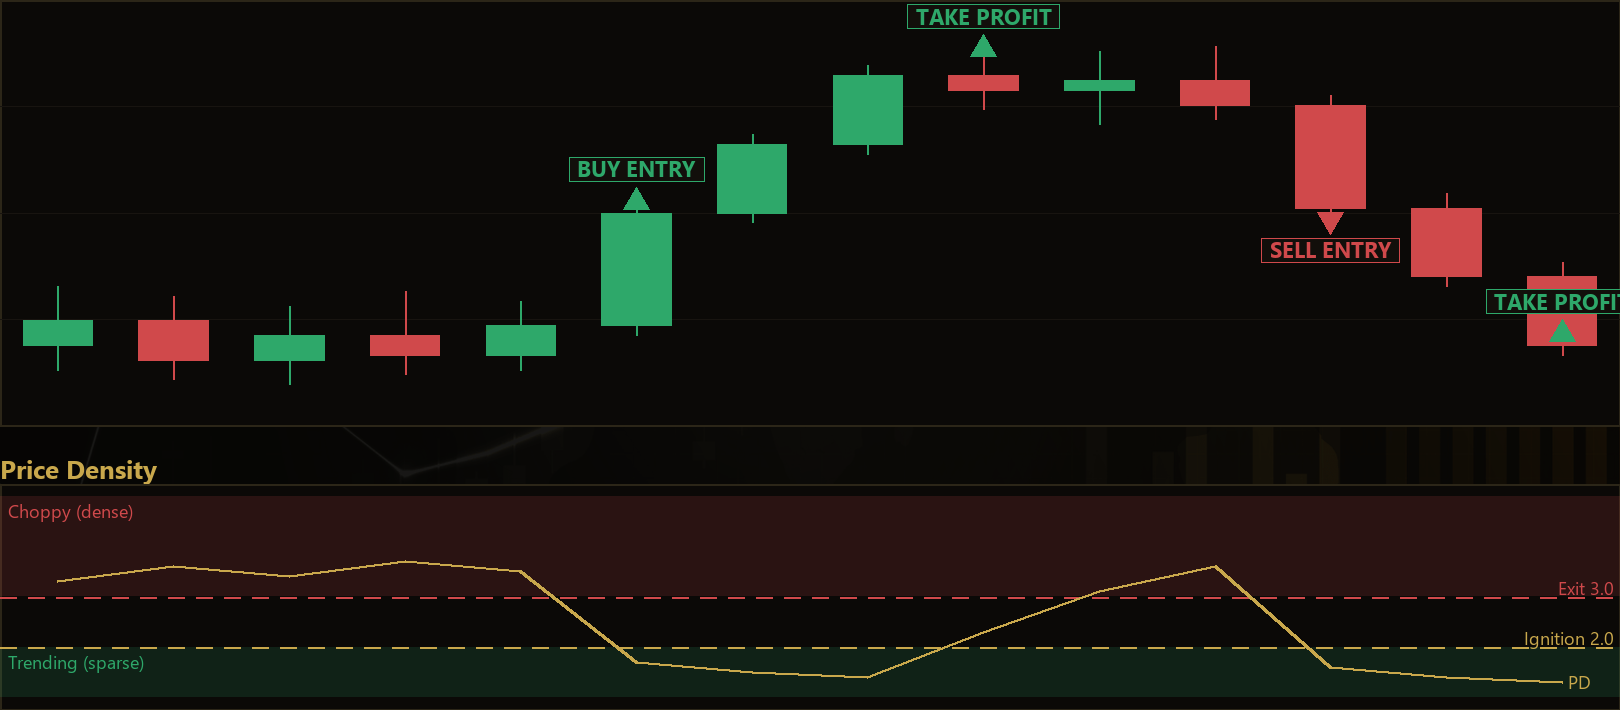
The core idea is intuitive. When a market is ranging, each bar retraces over the same zone, so the summed bar ranges pile up while the overall high-to-low span stays small — Price Density reads high (values of 2, 3, or more). When a clean trend emerges, each bar carries price onto fresh ground with little overlap, so the summed ranges roughly equal the net span — Price Density collapses toward 1. This strategy waits for that collapse and interprets it as a directional leg igniting out of consolidation.
As a learning tool, the Price Density Trend Breakout is well suited to traders who want to study regime detection — the art of distinguishing trending conditions from range-bound noise. It is a single-timeframe, one-position-at-a-time system with clearly defined entry, exit, stop, and target logic, which makes it easy to dissect, backtest, and reason about. It is not a "signal service" or a shortcut; it is a transparent example of how a classic Perry Kaufman concept can be translated into rule-based code.
How It Works
The strategy evaluates its logic once per newly closed bar on the chart timeframe. It computes Price Density (PD) over a rolling window and watches for that value to fall through a threshold. Here is the full flow in plain English:
- Density calculation: For the last
DensityPeriodbars, the strategy sums each bar's High−Low range and divides by the window's total (Highest High − Lowest Low). The result is the current Price Density reading. - Ignition trigger (the breakout signal): The strategy compares the previous bar's density (
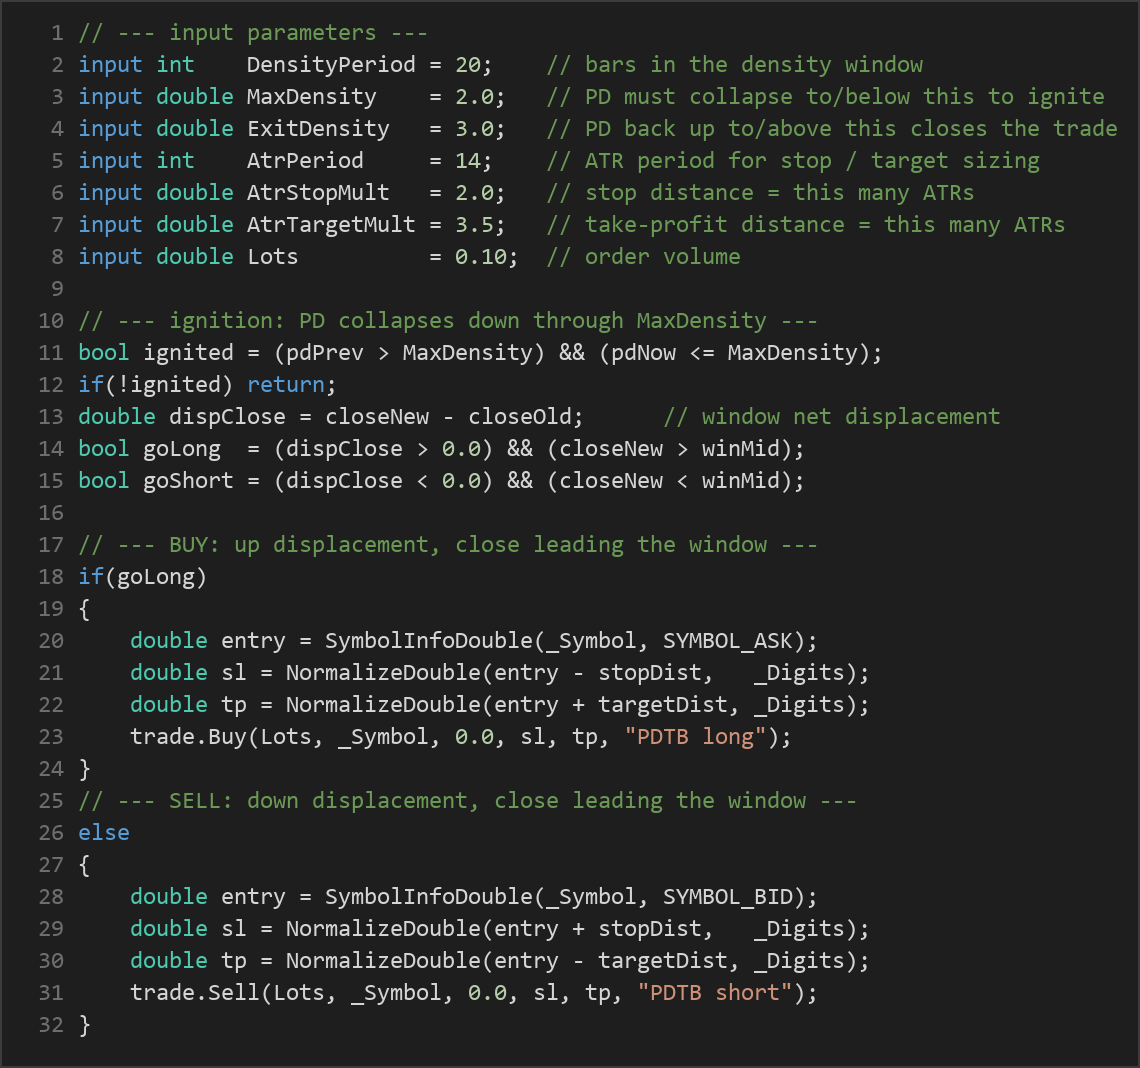
pdPrev) with the current bar's density (pdNow). A fresh collapse occurs whenpdPrevwas aboveMaxDensityandpdNowfalls to or below it. This downward cross is read as chop giving way to trend. - Direction selection: The strategy does not guess the side. It measures the window's net displacement (the newest close minus the oldest close in the window) and checks where the latest close sits relative to the window's mid-range (the average of the window high and low).
- The strategy signals a long when displacement is positive and the latest close is above the window mid-range — price is leading the range higher.
- The strategy signals a short when displacement is negative and the latest close is below the window mid-range — price is leading the range lower.
- If neither condition is cleanly met, no trade is taken. This filter helps avoid a "false collapse" where density drops but price is not actually pushing.
- Exit on density re-expansion: While a position is open, the strategy keeps recomputing Price Density. If PD climbs back to or above
ExitDensity, the clean leg is judged to have decayed back into chop, and the position is closed. This is the strategy's way of stepping aside once the trending phase dissipates. - Stop-loss logic: On entry, the strategy places a stop a distance of
AtrStopMult × ATRaway from the fill price. ATR (Average True Range) is a volatility measure, so the stop automatically widens in fast markets and tightens in quiet ones. - Take-profit logic: A take-profit is placed at
AtrTargetMult × ATRfrom entry. With the default multipliers (2.0 stop, 3.5 target), the design aims for a reward-to-risk ratio greater than one on each trade the market allows to run.
Only one position per magic number is held at a time. Once a trade is open, the ATR stop and target — plus the density-re-expansion rule — manage the exit; no new entries are stacked on top.
Strategy Parameters
| Parameter | Default | Min | Max | Description |
|---|---|---|---|---|
| DensityPeriod | 20 | 8 | 50 | Number of bars in the Price Density window. Shorter reacts faster but is noisier; longer is smoother and slower. |
| MaxDensity | 2.0 | 1.2 | 4.0 | The ignition threshold. Price Density must collapse to or below this value to signal a chop-to-trend transition. |
| ExitDensity | 3.0 | 1.5 | 6.0 | The dissipation threshold. If density re-expands to or above this level, the open position is closed. |
| AtrPeriod | 14 | 7 | 30 | Lookback period for the ATR used to size the stop and target. |
| AtrStopMult | 2.0 | 0.5 | 5.0 | Stop-loss distance expressed as this many ATRs from the entry price. |
| AtrTargetMult | 3.5 | 1.0 | 8.0 | Take-profit distance expressed as this many ATRs from the entry price. |
| Lots | 0.10 | 0.01 | 1.0 | Fixed order volume (position size) in lots. |
| Magic | 9207 | 0 | 9,999,999 | Unique identifier so the EA only manages its own trades. |
Recommended Chart Settings
The Price Density Trend Breakout was designed and reasoned about on a liquid FX major such as EURUSD or GBPUSD, using an intraday-to-swing timeframe in the M30–H1 range. The strategy runs entirely on the chart's own timeframe — every calculation uses the timeframe you attach it to — so the character of your results will change noticeably if you move it to a faster or slower chart.
Because Price Density is a geometry-based regime filter, it tends to behave most cleanly on instruments with steady tick flow and reasonable spreads. Thinly traded symbols, exotic pairs, or very low timeframes with erratic candles can produce noisy density readings. As with any strategy, results will vary across different market conditions, sessions, and brokers, and any timeframe or symbol you choose should be validated in a backtest and on a demo account first.
How to Install on MetaTrader 5
- Download the
.ex5file from the link below. - Copy it to your MT5
MQL5\Expertsfolder. - Restart MetaTrader 5 or refresh the Navigator panel.
- Drag the EA onto a chart matching the recommended symbol and timeframe.
- Configure the input parameters and enable Algo Trading.
What to Consider Before Using This EA
Every strategy is a set of trade-offs, and understanding them is more valuable than any single setting.
Strengths of this approach. Price Density captures something many trend filters miss: the overlap of price travel, not just its direction. By requiring a fresh downward cross of the density threshold, the strategy attempts to enter at the earliest confirmed sign of expansion rather than chasing a move that is already mature. The combination of a displacement check and a mid-range close filter adds a layer of confirmation so the system does not act on density collapses that lack real directional push. ATR-based stops and targets keep risk proportional to current volatility instead of using fixed pip distances.
Known limitations. Price Density is a regime indicator, not a timing indicator. A collapse in density confirms that a leg has begun, but it cannot tell you how far that leg will run. In choppy markets that briefly fake a breakout, the strategy may enter and then be stopped out or exited on density re-expansion — the classic "whipsaw" cost of any breakout system. The threshold values (MaxDensity and ExitDensity) are sensitive: set them too loose and you trade noise, too tight and you rarely trade at all. Because only one position is held at a time, the strategy can also miss simultaneous opportunities on the same symbol.
Where it may underperform. Prolonged, tight ranges with frequent false starts are the hardest environment for this design, as are gappy or news-driven sessions where ATR-based stops can be jumped. The strategy historically favors markets that transition from consolidation into sustained directional moves; markets that grind sideways or reverse quickly after each expansion are less friendly. None of this makes the approach good or bad — it simply defines the conditions it was built to study.
Risk Management Tips
Sound risk management matters far more than any individual entry rule. Consider the following general principles as you study this strategy:
- Risk a small, fixed fraction per trade. A common educational guideline is to risk no more than 1–2% of account equity on any single position. Adjust the
Lotsparameter so the ATR-based stop distance corresponds to that fraction, rather than trading a fixed lot size blindly. - Understand your drawdown tolerance. Even a well-behaved breakout system will experience losing streaks during ranging periods. Know in advance how much peak-to-trough decline you are willing to accept.
- Always start on a demo account. Run the EA on a demo or a small test account across different sessions and market conditions before considering any live use. This lets you observe the density behavior first-hand.
- Mind spreads, commissions, and slippage. ATR-scaled targets can be eroded by wide spreads on lower timeframes or during illiquid hours. Factor real trading costs into any evaluation.
- Keep position sizing consistent. Avoid increasing size after wins or losses in an attempt to recover; consistent, rules-based sizing is central to disciplined trading.
- Backtest and forward-test. Use MT5's Strategy Tester to study historical behavior, then confirm with forward testing on live-but-simulated conditions before drawing conclusions.
Risk Warning
Trading foreign exchange, CFDs, and other leveraged financial instruments involves substantial risk of loss and is not suitable for all investors. The strategies and tools discussed on this page are provided for educational purposes only and do not constitute financial advice, investment recommendations, or solicitation to trade. Always consult a qualified financial adviser before making trading decisions. Past backtest performance is not indicative of future results.
Downloads
- Expert Advisor: PriceDensityTrendBreakout.ex5 (51 downloads)
- Source Code: PriceDensityTrendBreakout.mq5 (51 downloads)
- Documentation: PriceDensityTrendBreakout.pdf (56 downloads)