Disclaimer: This article is for educational and informational purposes only. It does not constitute financial or investment advice. Trading forex and CFDs carries significant risk of loss. Past performance of any strategy — including backtests — does not guarantee future results. Never trade with money you cannot afford to lose.
What Is This Strategy?
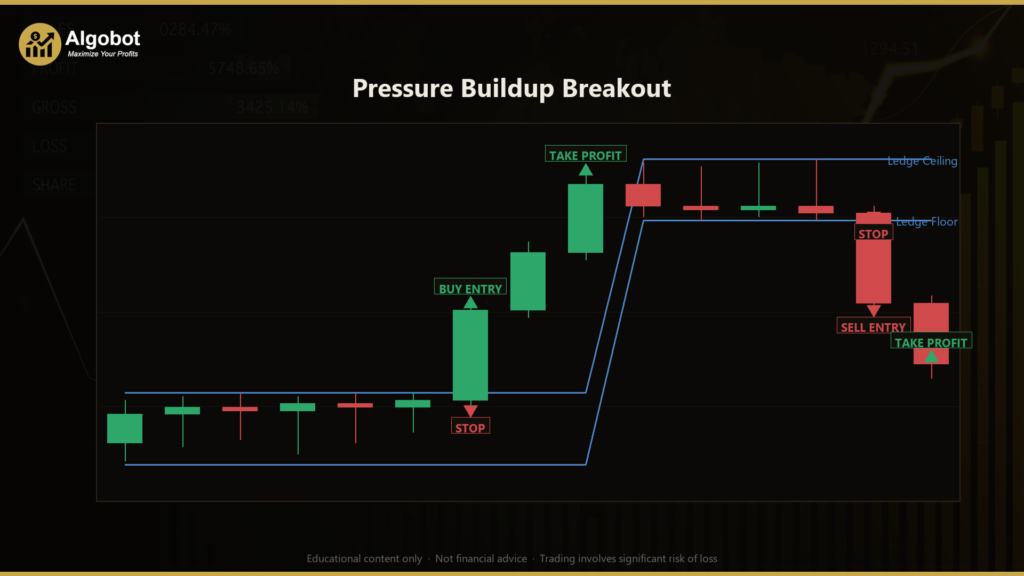
The Pressure Buildup Breakout is a pure price-action breakout strategy that uses no technical indicators at all. Instead of moving averages, oscillators, or volume tools, it reads raw OHLC (open, high, low, close) data directly to detect when price has been coiling inside a tight horizontal range — a "ledge" — and then releasing with conviction. The trading style here is classic breakout trading: the strategy waits for price to escape a period of consolidation rather than trying to predict reversals or ride established trends.
The core idea is that quiet, sideways consolidation often hides a directional imbalance in order flow. When a market trades flat but each candle keeps closing near the top of its own range, buyers are quietly absorbing supply even though price is not yet moving much. The Pressure Buildup Breakout attempts to measure that hidden pressure from where bars close inside their range, and only takes a breakout in the direction the pressure already favors. It is designed for liquid markets such as major forex pairs (for example GBPUSD) or index CFDs, where breakouts tend to be cleaner and consolidations more meaningful.
As a learning tool, this strategy is well suited to traders who want to understand breakout mechanics, range identification, and structure-based stop placement without the complexity of indicator tuning. Because every decision is derived from candle geometry, it is an excellent way to study how consolidation, expansion, and follow-through interact. Treat it as a framework for analysis and study — not as a profit opportunity.
How It Works
The strategy evaluates the market once per completed bar. On each new bar it inspects the most recent consolidation window and the single bar that just closed (the breakout candidate). Here is what the strategy checks before it signals a trade:
- Define the ledge. Over a lookback window of recent bars, the strategy records the highest high (the "ceiling") and the lowest low (the "floor"). This horizontal band is the consolidation ledge.
- Tightness gate. The ledge height must be small relative to the average bar range over that window. If the band is taller than
MaxLedgeRangetimes the average range, it is treated as a trend leg — not a true consolidation — and the strategy stands aside. - Measure directional pressure. For each bar inside the ledge, the strategy calculates where the bar closed within its own range. A close in the upper half counts as long (buyer) pressure; a close in the lower half counts as short (seller) pressure. This is the "buildup" the name refers to.
- Require a thrust. The breakout bar itself must show genuine range expansion — its high-to-low range must be at least
ExpansionMulttimes the window's average range. This filters out thin drifts through a level and favors bars with real participation. - Confirm the break with a buffer. The breakout bar must close beyond the ledge edge by a small buffer (
BreakoutBufferas a fraction of the ledge height), not merely touch it.
When these conditions align, the strategy signals an entry:
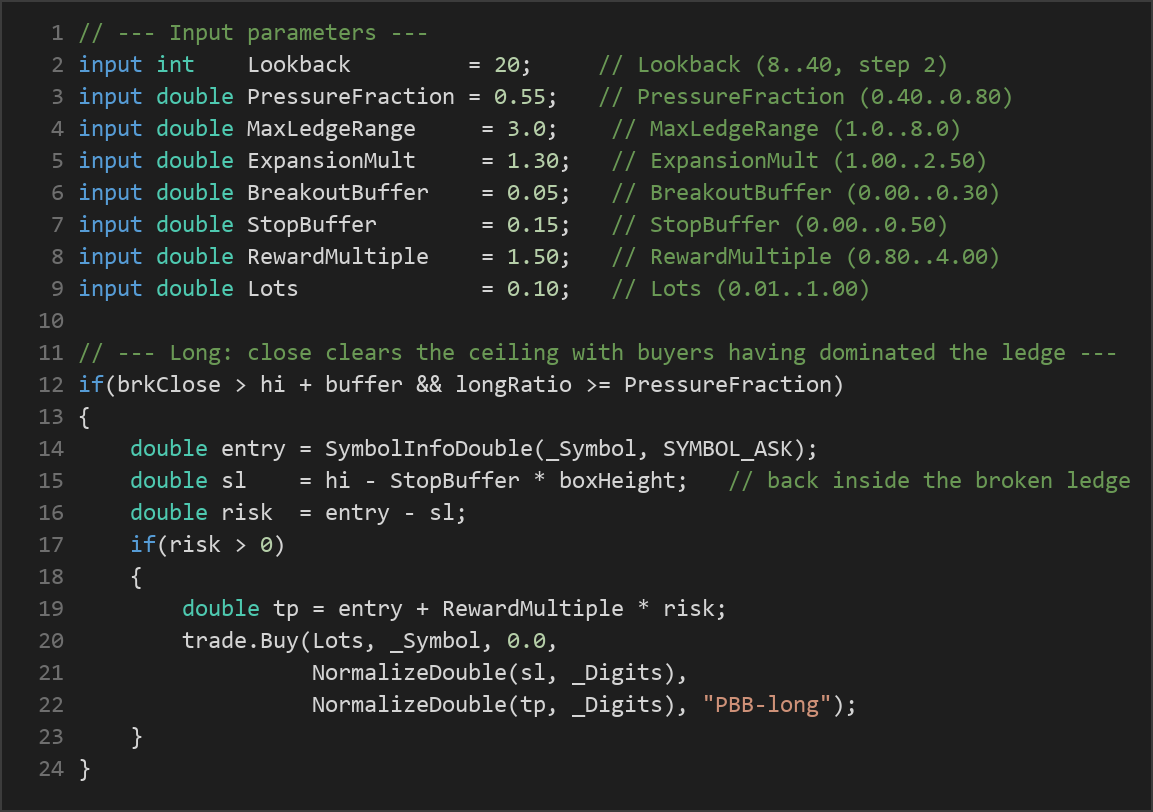
- Long signal: the bar closes above the ceiling plus the buffer, and the fraction of long-pressure bars is at least
PressureFraction. The strategy signals a buy. - Short signal: the bar closes below the floor minus the buffer, and the fraction of short-pressure bars is at least
PressureFraction. The strategy signals a sell.
Stop-loss logic. The stop is a structure stop placed back inside the broken ledge. For a long, it sits below the former ceiling by StopBuffer times the box height; for a short, it sits above the former floor by the same fraction. The logic is that if price falls back inside the range it just escaped, the breakout has likely failed.
Take-profit logic. The target is set as a reward-to-risk multiple of the stop distance. The distance from entry to stop is the risk; the take-profit is placed RewardMultiple times that distance in the direction of the trade. The strategy holds only one position per magic number at a time and lets the stop-loss and take-profit manage the open trade.
Strategy Parameters
| Parameter | Default | Min | Max | Description |
|---|---|---|---|---|
| Lookback | 20 | 8 | 40 | Number of bars forming the consolidation ledge that precedes the breakout bar. |
| PressureFraction | 0.55 | 0.40 | 0.80 | Minimum fraction of ledge bars that must close on the breakout side for the directional pressure to qualify. |
| MaxLedgeRange | 3.0 | 1.0 | 8.0 | Tightness gate — the ledge height must be no more than this many average bar ranges, rejecting tall trending "ledges". |
| ExpansionMult | 1.30 | 1.00 | 2.50 | Thrust gate — the breakout bar's range must be at least this multiple of the average bar range. |
| BreakoutBuffer | 0.05 | 0.00 | 0.30 | How far past the ledge edge the close must clear, as a fraction of the ledge height. |
| StopBuffer | 0.15 | 0.00 | 0.50 | How far inside the broken edge the stop sits, as a fraction of the ledge height. |
| RewardMultiple | 1.50 | 0.80 | 4.00 | Take-profit distance as a reward-to-risk multiple of the stop distance. |
| Lots | 0.10 | 0.01 | 1.00 | Fixed trade volume in lots. |
(Step values, where used: Lookback 2, PressureFraction 0.05, MaxLedgeRange 0.5, ExpansionMult 0.10, BreakoutBuffer 0.05, StopBuffer 0.05, RewardMultiple 0.10, Lots 0.05.)
Recommended Chart Settings
The Pressure Buildup Breakout was designed with liquid forex pairs and index CFDs in mind — for example GBPUSD or a major stock index — on intraday timeframes such as M15 to H1. These markets tend to produce cleaner consolidations and more reliable expansion bars than thin or illiquid instruments. That said, the strategy is timeframe-agnostic: every calculation uses the chart's selected timeframe, so it will run on whatever symbol and period you attach it to. Results will vary considerably across different symbols, timeframes, and market conditions, so any setting should be studied carefully on its own merits rather than assumed to transfer.
How to Install on MetaTrader 5
- Download the .ex5 file from the link below
- Copy it to your MT5
MQL5\Expertsfolder - Restart MetaTrader 5 or refresh the Navigator panel
- Drag the EA onto a chart matching the recommended symbol and timeframe
- Configure the input parameters and enable Algo Trading
What to Consider Before Using This EA
Every approach has strengths and limitations, and an honest assessment helps you study it well.
Strengths. Because the strategy relies only on price action, there are no indicator lag issues and no curve-fitting of indicator settings. The multiple gates — tightness, pressure, thrust, and a breakout buffer — work together to filter out weak, low-conviction breaks. The structure-based stop is logical: it invalidates the trade if price returns inside the range it escaped, which keeps risk tied to actual market structure rather than an arbitrary fixed distance.
Known limitations. Breakout strategies are vulnerable to false breakouts (also called "fakeouts"), where price clears a level only to reverse back inside the range. No filter eliminates these entirely. The strategy also trades relatively infrequently because it demands several conditions at once, which means signals can be sparse on quiet instruments. During strongly trending or news-driven markets, consolidations may be rare or the tightness gate may reject otherwise valid setups. Conversely, in choppy, range-bound conditions, repeated marginal breakouts can produce a cluster of losing trades. The fixed Lots sizing does not scale risk to account size, so position sizing should be reviewed independently. As with any breakout system, performance is sensitive to spread and slippage, especially on lower timeframes.
This is a tool for studying breakout behavior, not a shortcut. Test it thoroughly and understand why it acts before drawing any conclusions about it.
Risk Management Tips
Sound risk management matters far more than any single entry rule. Consider these general principles as you study this or any strategy:
- Risk a small, fixed percentage per trade. Many educational sources suggest risking no more than 1–2% of account equity on any single position, so that a string of losses does not threaten your account.
- Size positions deliberately. The default fixed lot size does not adjust to your balance or to the stop distance. Calculate the actual monetary risk of each trade before deploying it, and adjust volume to match your risk tolerance.
- Always use a demo account first. Run the EA on a demo or simulated account for an extended period across varied conditions before considering anything else. This lets you observe behavior without financial exposure.
- Understand drawdown. Even a sound strategy will experience losing streaks. Know the maximum drawdown you are willing to tolerate and how it would feel in real time, not just on a chart.
- Account for costs. Spread, commission, and slippage all erode breakout entries. Factor realistic costs into any study you perform.
Education and patience are the foundation. No parameter set removes risk — it only shapes how that risk is expressed.
Risk Warning
Trading foreign exchange, CFDs, and other leveraged financial instruments involves substantial risk of loss and is not suitable for all investors. The strategies and tools discussed on this page are provided for educational purposes only and do not constitute financial advice, investment recommendations, or solicitation to trade. Always consult a qualified financial adviser before making trading decisions. Past backtest performance is not indicative of future results.
Downloads
- Expert Advisor: PressureBuildupBreakout.ex5 (65 downloads)
- Source Code: PressureBuildupBreakout.mq5 (61 downloads)
- Documentation: PressureBuildupBreakout.pdf (69 downloads)