Disclaimer: This article is for educational and informational purposes only. It does not constitute financial or investment advice. Trading forex and CFDs carries significant risk of loss. Past performance of any strategy — including backtests — does not guarantee future results. Never trade with money you cannot afford to lose.
What Is This Strategy?
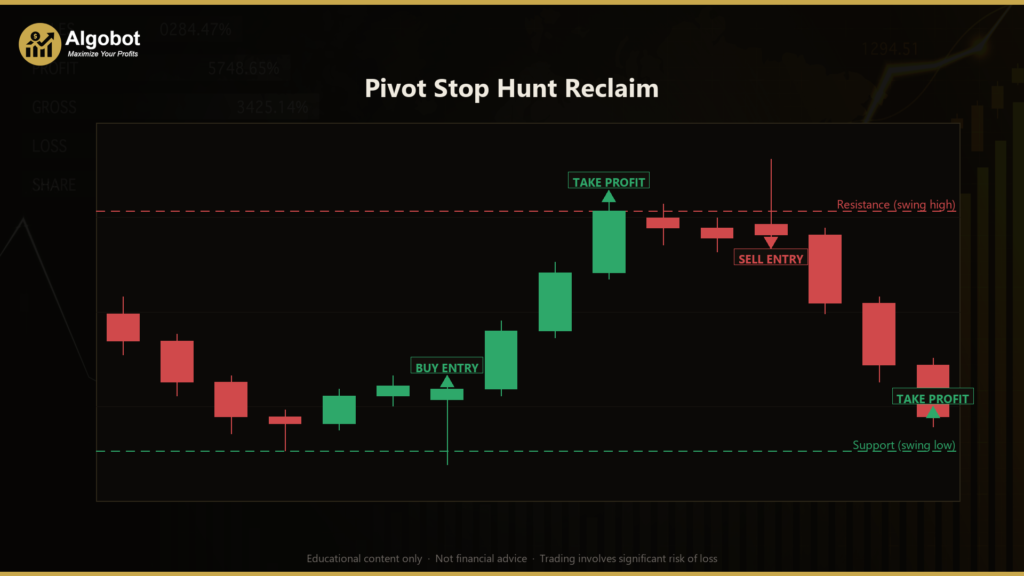
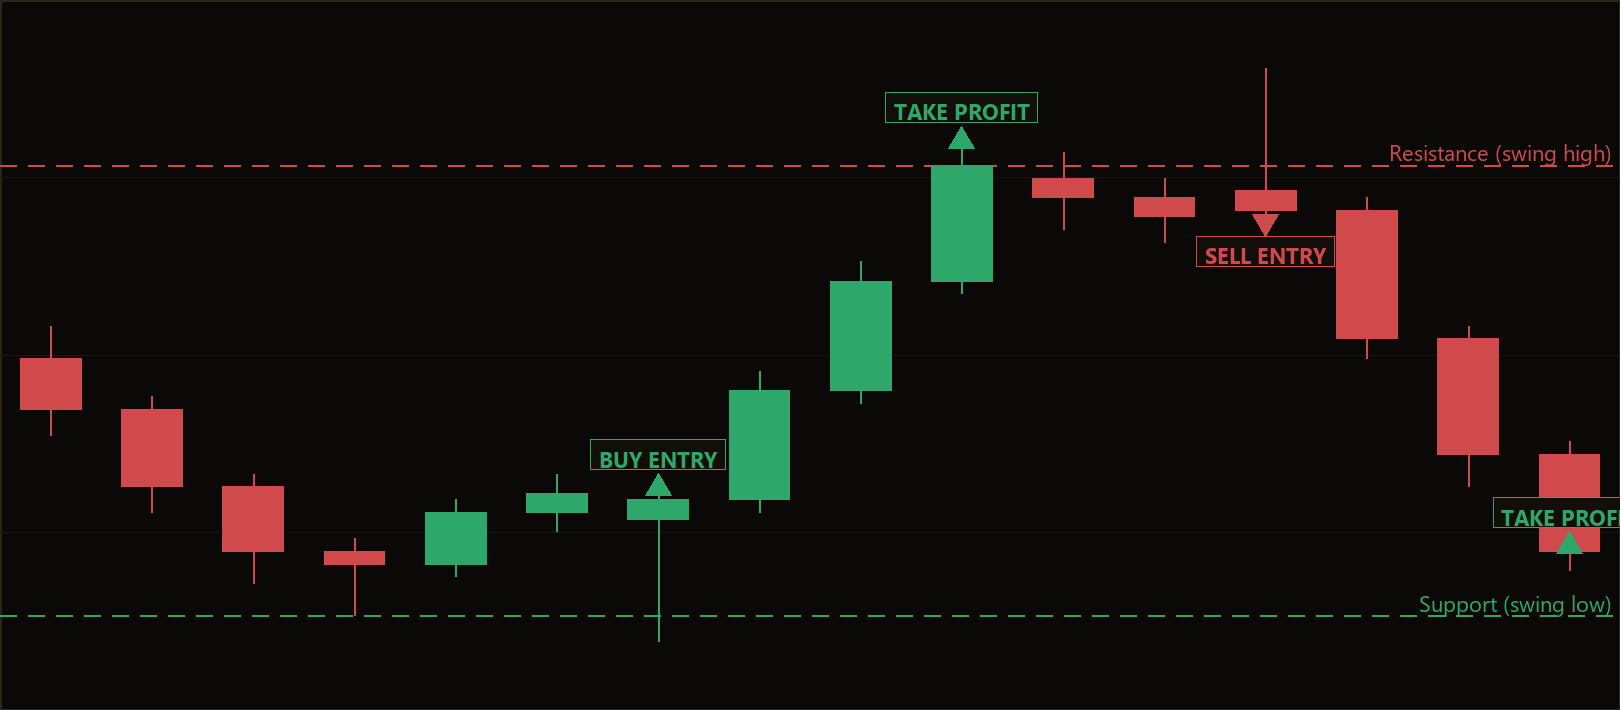
The Pivot Stop Hunt Reclaim strategy is a pure price-action support and resistance reversal system that trades false breakouts around recent swing pivots — without using a single technical indicator. A swing pivot is simply a candle whose high (or low) is the most extreme point compared with a fixed number of bars on either side of it, marking a level that other traders can clearly see on the chart. Because those obvious levels attract clusters of stop-loss orders, price often spikes just beyond them, trips those stops, and then snaps back inside the range. This "stop hunt" followed by a "reclaim" is the false-break pattern the strategy is built to detect.
In trading terms, the strategy is a mean-reversion approach designed for ranging or rotational market conditions, where price respects horizontal structure rather than trending strongly in one direction. It looks for a candle that pierces a support or resistance level with its wick but closes back on the correct side of that level — a sign that the breakout failed and liquidity above or below the level has been absorbed.
As a learning tool, this strategy is well suited to traders who want to study liquidity, candle geometry, and structure-based risk without the lag or clutter of moving averages, oscillators, or other indicators. Momentum here is read directly from the shape of the candle — where it closes within its own range and how large that range is relative to recent bars. If you are learning how false breakouts and stop hunts behave, the Pivot Stop Hunt Reclaim model offers a clean, rules-based framework to examine.
How It Works
The Pivot Stop Hunt Reclaim strategy evaluates one closed candle at a time (acting only once per bar) and checks a strict set of conditions before it signals a trade. It tracks the most recent confirmed swing high (resistance) and swing low (support), then waits for a candle that hunts stops beyond one of those levels and reclaims it.
Structure tracking:
- The strategy continuously identifies the most recent confirmed fractal swing pivots. A high is confirmed as resistance only when it is the highest point across
PivotLookbackbars to its left and right; a low is confirmed as support under the mirror-image rule. - Because confirmation requires bars on both sides, the pivot is only locked in after enough candles have formed to its right — this avoids reacting to an unconfirmed extreme.
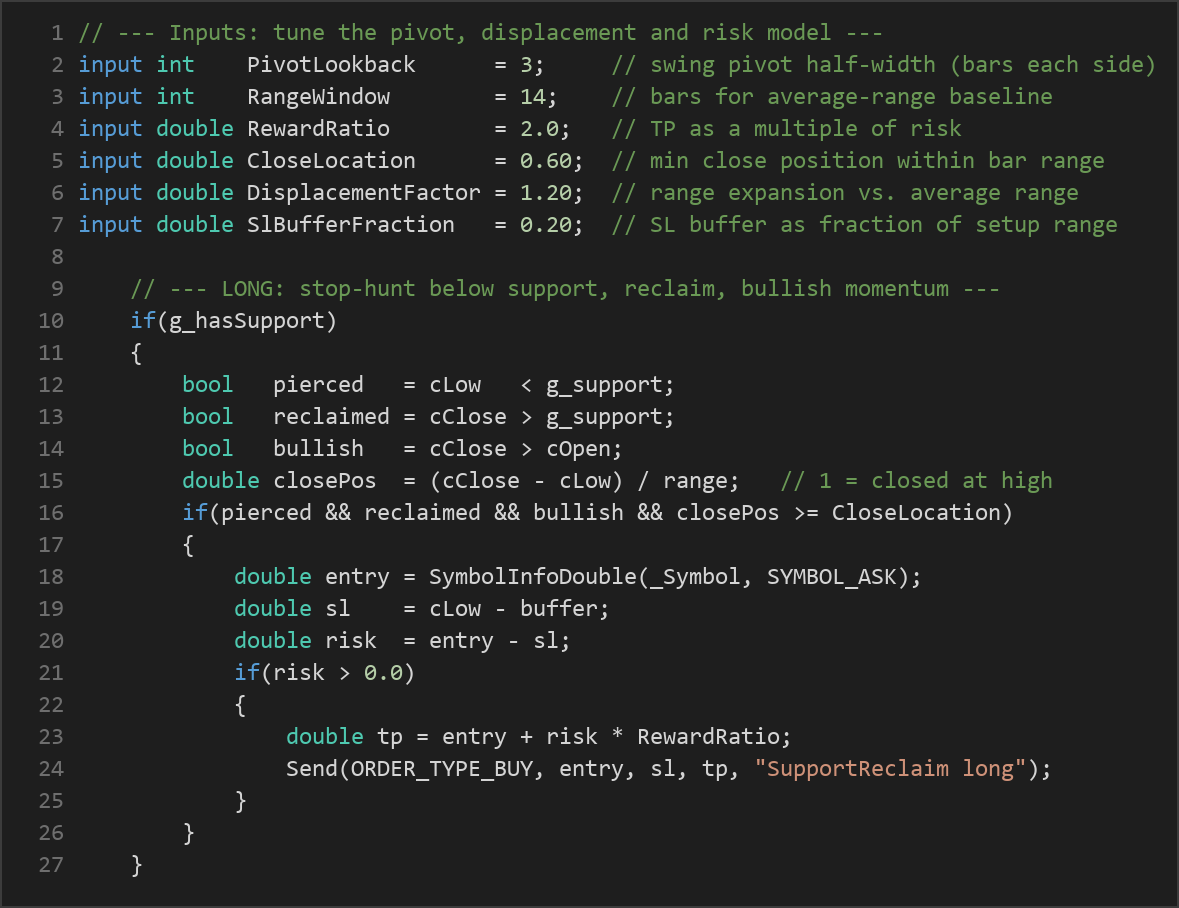
Long entry — the strategy signals a buy when all of the following are true:
- The closed candle's low pierces below support (a stop hunt below the level).
- The candle closes back above support (the breakout is reclaimed).
- The candle is bullish (close above open).
- The close sits in the upper part of the candle's range, at or above the
CloseLocationthreshold, indicating buyers regained control. - The candle is an expansion (displacement) bar — its range is at least
DisplacementFactortimes the recent average range, signalling genuine momentum rather than a quiet drift.
Short entry — the strategy signals a sell under the symmetric conditions:
- The candle's high pierces above resistance, then closes back below it.
- The candle is bearish (close below open).
- The close sits in the lower part of the range, at or above the
CloseLocationthreshold measured from the high. - The same displacement filter applies.
Stop-loss logic:
- For a long, the stop-loss is placed just below the stop-hunt wick (the candle's low), minus a small buffer equal to
SlBufferFractionof the candle's range. - For a short, the stop-loss sits just above the wick (the candle's high), plus the same buffer.
- This anchors risk to actual market structure rather than to a fixed pip distance or an indicator like ATR.
Take-profit logic:
- The take-profit is set as a fixed reward multiple of the measured risk. The distance from entry to stop-loss is multiplied by
RewardRatioand projected in the direction of the trade. - Only one position per magic number is allowed at a time, so the strategy will not stack multiple trades on the same setup.
Strategy Parameters
| Parameter | Default | Min | Max | Description |
|---|---|---|---|---|
| PivotLookback | 3 | 2 | 8 | Number of bars on each side of a candle required to confirm it as a swing high/low pivot. Larger values produce fewer, more significant levels. |
| RangeWindow | 14 | 5 | 30 | How many prior bars are averaged to form the baseline range used by the displacement (range-expansion) filter. |
| RewardRatio | 2.0 | 1.0 | 4.0 | Take-profit distance expressed as a multiple of the trade's risk (entry-to-stop distance). |
| CloseLocation | 0.60 | 0.50 | 0.90 | Minimum required close position within the candle's range (1.0 = closed at the extreme), confirming momentum in the trade direction. |
| DisplacementFactor | 1.20 | 0.80 | 2.50 | How much larger the setup candle's range must be versus the recent average range to count as an expansion bar. |
| SlBufferFraction | 0.20 | 0.00 | 1.00 | Extra stop-loss buffer beyond the stop-hunt wick, expressed as a fraction of the setup candle's range. |
| Lots | 0.10 | 0.01 | 1.00 | Fixed order volume (position size) used for each trade. |
Recommended Chart Settings
This strategy was designed as a single-symbol, single-timeframe price-action model, and it reads structure directly from the chart it is attached to. Because it relies on clearly defined swing pivots and clean candle geometry, it is generally studied on liquid major forex pairs (such as EUR/USD or GBP/USD) where spreads are tight and price respects horizontal levels.
For the timeframe, intraday charts such as the M15 to H1 range are common starting points for examining false-break behaviour, while the H1 to H4 range tends to produce fewer but structurally cleaner setups. The PivotLookback and RangeWindow settings interact with your chosen timeframe, so it is worth testing different combinations. Remember that results will vary significantly across different symbols, sessions, and market conditions, and no single chart setting is optimal everywhere.
How to Install on MetaTrader 5
- Download the .ex5 file from the link below
- Copy it to your MT5
MQL5\Expertsfolder - Restart MetaTrader 5 or refresh the Navigator panel
- Drag the EA onto a chart matching the recommended symbol and timeframe
- Configure the input parameters and enable Algo Trading
What to Consider Before Using This EA
The Pivot Stop Hunt Reclaim approach has some genuine strengths as a study model. It is fully rules-based and transparent — every condition can be inspected on the chart, since there are no hidden indicator calculations. Its risk is anchored to real structure (the wick of the stop-hunt candle), and the displacement filter helps screen out low-conviction setups that occur during quiet, choppy periods. The fixed reward-to-risk targeting also makes it straightforward to study expectancy.
There are equally important limitations to understand. False-break and mean-reversion strategies tend to struggle in strong, sustained trends, where a level that gets pierced simply keeps going rather than reclaiming — these are the conditions in which this type of pattern historically underperforms. The strategy also depends heavily on how swing pivots are defined: a small PivotLookback reacts quickly but marks many minor levels, while a large value waits longer and may miss faster setups. Because the strategy acts on a single closed candle, gaps, spread widening, and slippage around news events can affect the actual fill versus the intended entry, stop, and target. Finally, requiring a displacement bar means the strategy stays out of low-volatility ranges entirely, which may feel like long periods of inactivity. Treat it as one lens for studying liquidity and false breaks — not as a complete trading system on its own.
Risk Management Tips
Sound risk management matters far more than any single entry rule. Consider these general principles as you study any strategy:
- Risk a small, fixed fraction per trade. Many educational sources suggest risking no more than 1–2% of account equity on any single position, so that a string of losses does not threaten your capital.
- Size positions to your stop, not the other way around. Because this strategy's stop distance is structure-based and varies by setup, the fixed
Lotsvalue means your monetary risk changes from trade to trade. Adjust volume so the worst-case loss stays within your chosen percentage. - Test on a demo account first. Run the strategy on a demo or simulated account across different symbols and market conditions before risking real capital, and study how it behaves in both trending and ranging environments.
- Understand drawdown. Every strategy experiences losing streaks. Knowing the depth and duration of historical drawdown helps you set realistic expectations and decide whether you can stay disciplined through difficult periods.
- Keep records and review. Logging each trade and reviewing why it won or lost is one of the most valuable habits for learning how a pattern actually performs.
Risk Warning
Trading foreign exchange, CFDs, and other leveraged financial instruments involves substantial risk of loss and is not suitable for all investors. The strategies and tools discussed on this page are provided for educational purposes only and do not constitute financial advice, investment recommendations, or solicitation to trade. Always consult a qualified financial adviser before making trading decisions. Past backtest performance is not indicative of future results.
Downloads
- Expert Advisor: PivotStopHuntReclaim.ex5 (59 downloads)
- Source Code: PivotStopHuntReclaim.mq5 (61 downloads)
- Documentation: PivotStopHuntReclaim.pdf (65 downloads)