Disclaimer: This article is for educational and informational purposes only. It does not constitute financial or investment advice. Trading forex and CFDs carries significant risk of loss. Past performance of any strategy — including backtests — does not guarantee future results. Never trade with money you cannot afford to lose.
What Is This Strategy?
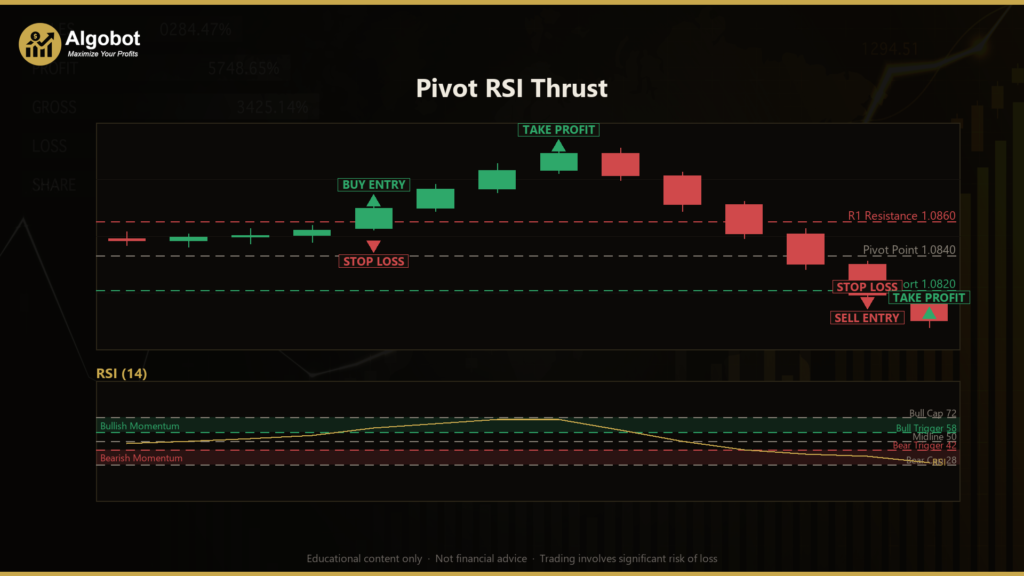
The Pivot RSI Thrust is a momentum-continuation breakout strategy that combines Pivot Points (a classic support-and-resistance tool) with the Relative Strength Index (RSI), a momentum oscillator that measures the speed and strength of recent price moves. The idea is straightforward to describe: the strategy watches a rolling pivot level built from recent price action, and it acts only when price breaks through that level and momentum confirms the move is genuine rather than a stalled false break.
Pivot Points are reference prices derived from the high, low, and close of a recent window. The central pivot (PP) sits in the middle, with R1 acting as a resistance level above it and S1 acting as a support level below it. Many traders treat a close beyond R1 or S1 as a sign that price is attempting to leave its recent range. On its own, though, a breakout can easily fail. The Pivot RSI Thrust adds an RSI filter so that breakouts are only taken when momentum is leaning clearly in the breakout's direction — but not so far that the move already looks exhausted.
This strategy is designed for trending or thrusting market conditions, where price is genuinely escaping a consolidation rather than chopping sideways. As a learning tool, it is well suited to traders who want to study how a price-level signal (pivots) can be combined with a momentum filter (RSI) to reduce noisy entries. It is best viewed as a framework for understanding breakout confirmation logic, not as a finished, drop-in solution for live capital.
How It Works
The strategy evaluates its logic once per completed bar on the primary chart timeframe. It looks at the most recently closed bar (the potential breakout bar) and the bar immediately before it, then checks several conditions in sequence.
- Build the rolling pivot: Over the most recent
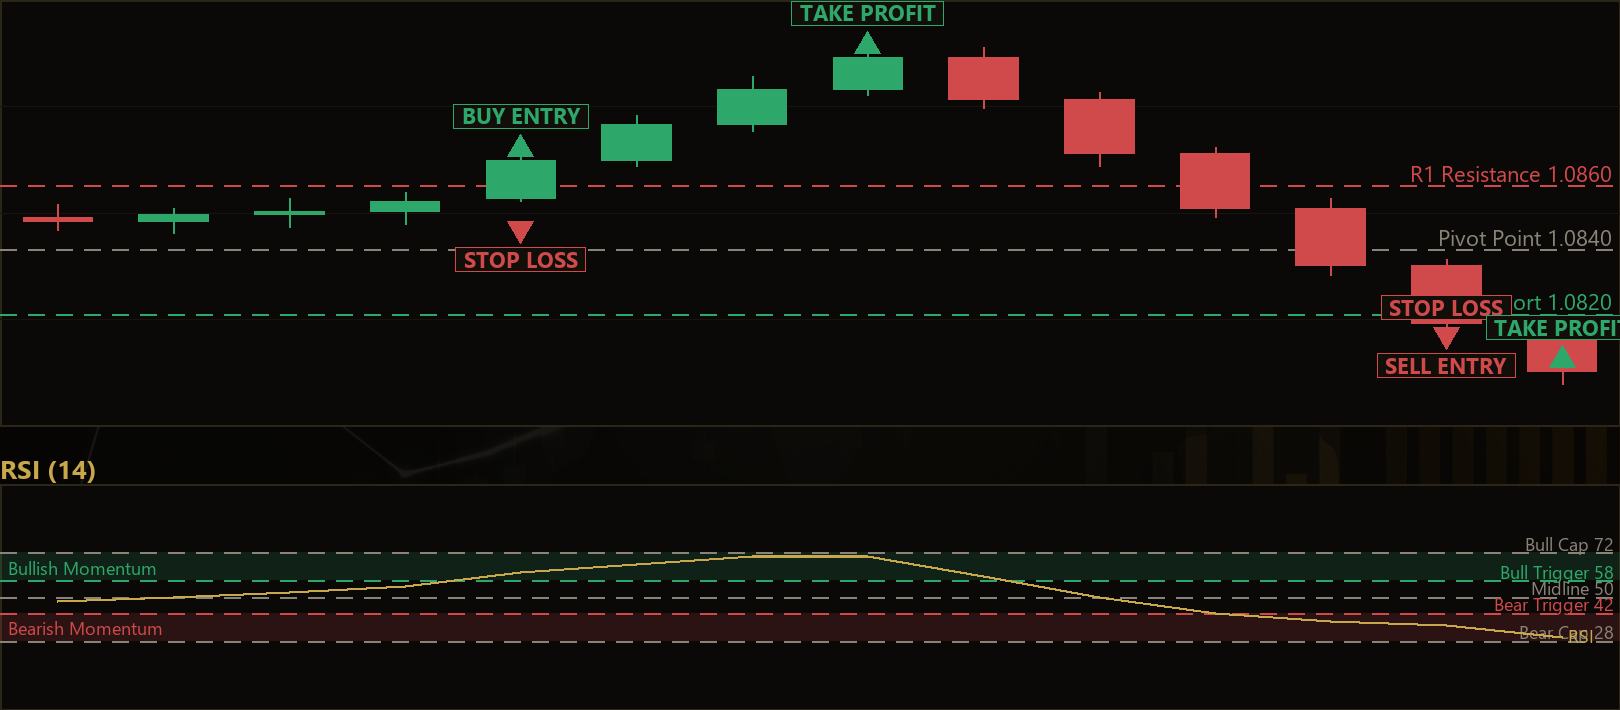
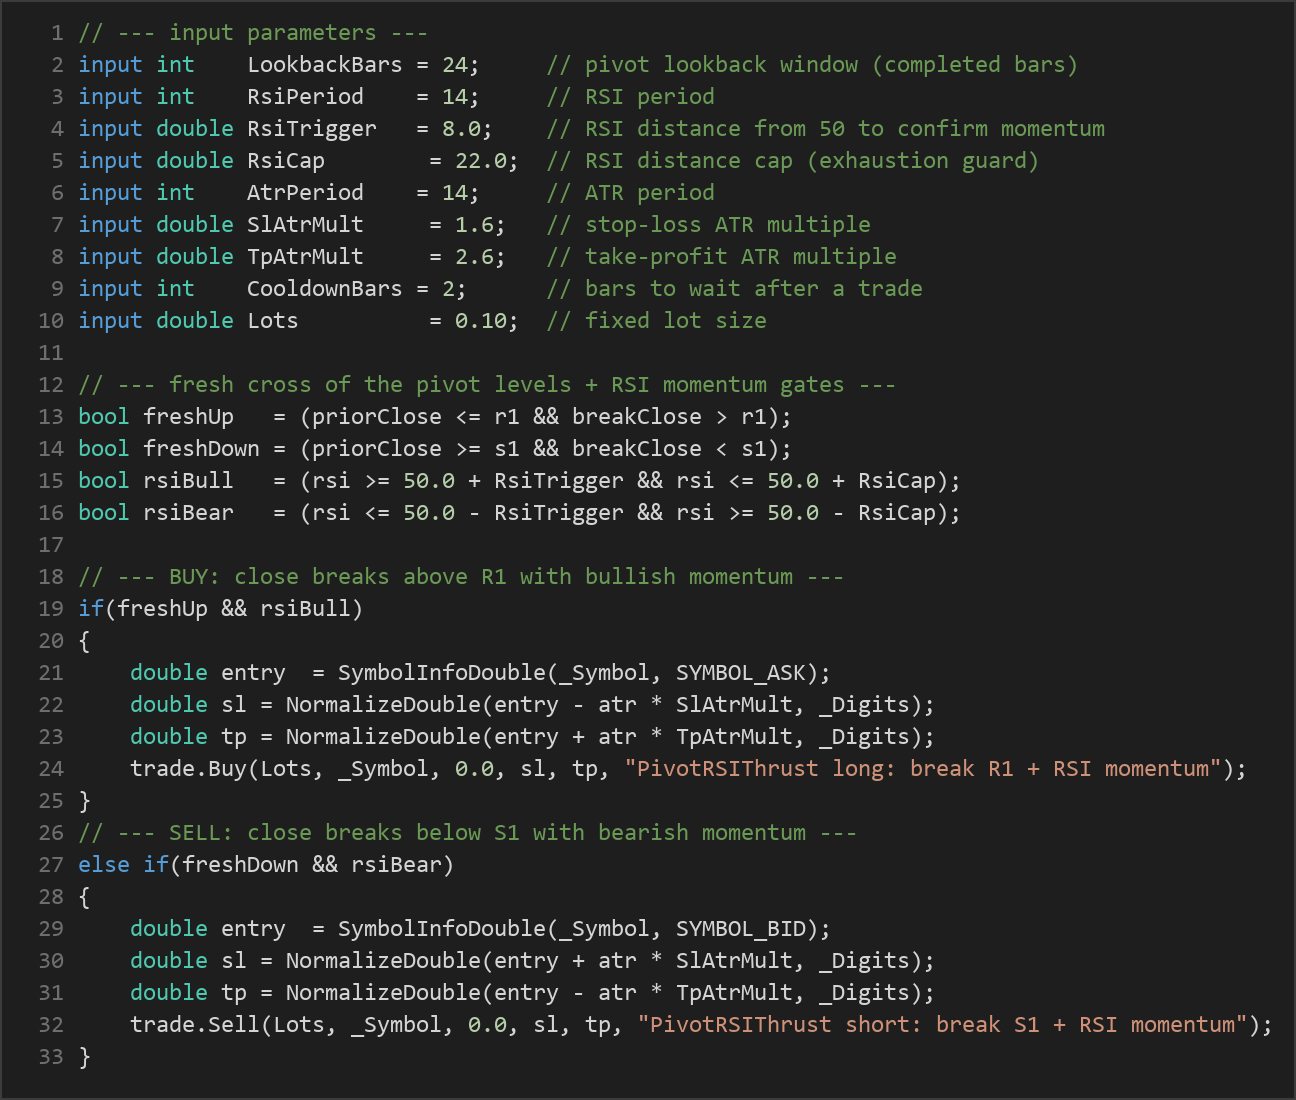
LookbackBarscompleted bars (excluding the breakout bar itself), the strategy finds the highest high and lowest low. It combines these with the prior bar's close to compute the central pivotPP = (High + Low + Close) / 3. From there it derivesR1 = 2 × PP − Low(resistance) andS1 = 2 × PP − High(support). - Detect a fresh upward cross (long setup): The strategy signals a possible long when the prior bar closed at or below R1 and the breakout bar closed above R1. This "fresh cross" rule ensures the strategy reacts to the first close beyond resistance rather than re-entering a level price has already cleared.
- Detect a fresh downward cross (short setup): The mirror image applies for shorts. The prior bar must have closed at or above S1, and the breakout bar must close below S1.
- Confirm momentum with RSI: For a long, RSI must sit above
50 + RsiTrigger(momentum is meaningfully bullish) but at or below50 + RsiCap(momentum is not already overstretched). For a short, RSI must be below50 − RsiTriggeryet at or above50 − RsiCap. With the default settings, this means a long requires RSI roughly between 58 and 72 — confirmed strength that is not yet exhausted. - Respect one-position and cooldown rules: The strategy holds only one position at a time per magic number. After any trade closes or opens, it waits
CooldownBarscompleted bars before considering a new entry, which helps avoid rapid-fire re-entries on the same swing.
When all conditions align, the strategy submits a market order:
- Stop-loss logic: The stop is placed at a distance of
ATR × SlAtrMultfrom entry. ATR (Average True Range) measures recent volatility, so the stop automatically widens in volatile conditions and tightens in calm ones. A minimum-distance guard keeps the stop from being placed too close given the symbol's spread. - Take-profit logic: The target is placed at
ATR × TpAtrMultfrom entry. With the default 1.6 stop multiple and 2.6 target multiple, the strategy aims for a reward-to-risk profile greater than 1:1 on each trade.
Strategy Parameters
| Parameter | Default | Min | Max | Description |
|---|---|---|---|---|
| LookbackBars | 24 | 8 | 80 | Number of completed bars used to build the rolling pivot window (sets how recent the support/resistance reference is). |
| RsiPeriod | 14 | 5 | 30 | Number of bars used to calculate the RSI momentum oscillator. |
| RsiTrigger | 8.0 | 2.0 | 25.0 | Minimum distance of RSI above/below the 50 midline required to confirm momentum. |
| RsiCap | 22.0 | 8.0 | 40.0 | Maximum distance of RSI above/below 50 allowed (an exhaustion guard to avoid chasing overextended moves). |
| AtrPeriod | 14 | 5 | 40 | Number of bars used to calculate ATR, which sizes the stop-loss and take-profit. |
| SlAtrMult | 1.6 | 0.5 | 5.0 | Stop-loss distance expressed as a multiple of ATR. |
| TpAtrMult | 2.6 | 0.6 | 8.0 | Take-profit distance expressed as a multiple of ATR. |
| CooldownBars | 2 | 0 | 20 | Number of completed bars to wait after a trade before allowing a new entry. |
| Lots | 0.10 | 0.01 | 1.0 | Fixed trade volume (lot size) used for each position. |
Recommended Chart Settings
The Pivot RSI Thrust operates entirely on the primary chart timeframe — every pivot, RSI, and ATR calculation is taken from the chart the Expert Advisor (EA) is attached to. Because it is a breakout-continuation approach, it tends to be studied on liquid instruments where ranges and breakouts are reasonably clean, such as major forex pairs (for example EUR/USD or GBP/USD) on intraday timeframes like M15, M30, or H1.
There is no single "correct" symbol or timeframe. The default LookbackBars of 24 means the pivot window covers roughly a day of M15 bars or a full session on H1, so the timeframe you choose changes the character of the levels. Always remember that breakout behavior differs significantly across instruments and across calm versus volatile periods, so results will vary. Test any combination thoroughly before drawing conclusions.
How to Install on MetaTrader 5
- Download the .ex5 file from the link below
- Copy it to your MT5
MQL5\Expertsfolder - Restart MetaTrader 5 or refresh the Navigator panel
- Drag the EA onto a chart matching the recommended symbol and timeframe
- Configure the input parameters and enable Algo Trading
What to Consider Before Using This EA
Strengths of this approach. The combination of a price-level signal and a momentum filter is a logical way to reduce false breakouts. Requiring a fresh cross of R1 or S1 means the strategy reacts to new breakouts rather than levels price has already digested. The RSI cap is a thoughtful detail: by refusing entries when momentum is already extreme, the strategy historically tries to avoid buying the very top of a thrust. ATR-based stops and targets adapt to volatility instead of using fixed pip distances, which is generally more robust across changing conditions.
Known limitations. Breakout strategies are vulnerable to false breakouts and whipsaws, especially in ranging or choppy markets where price pokes through a pivot and immediately reverses. The rolling pivot is sensitive to the LookbackBars setting — too short and levels become noisy, too long and they lag real structure. The RSI gates are distances from 50, so an overly wide window between RsiTrigger and RsiCap may admit weak signals, while a narrow one may filter out most trades. Because the strategy trades a single position at a time with a cooldown, it may also miss follow-through moves after exiting.
Conditions where it may underperform. Tight, sideways ranges and low-volatility sessions can generate repeated fresh crosses that fail to follow through. News-driven spikes can trigger entries near exhaustion despite the RSI cap. As with any breakout system, the strategy may experience clusters of losses during range-bound regimes followed by stronger stretches during trends.
Risk Management Tips
Sound risk management matters more than any single entry rule. Consider these general principles as part of your education:
- Risk a small, fixed fraction per trade. Many educational sources suggest risking no more than 1–2% of account equity on any single position. Size your lots so that the ATR-based stop distance corresponds to that fraction, rather than trading a fixed lot size blindly.
- Test on a demo account first. Run the strategy in a risk-free simulated environment until you understand how it behaves across different market conditions and timeframes.
- Understand drawdown. Every strategy experiences losing streaks. Study the historical drawdown so you know the depth of decline you might have to sit through, and decide in advance whether that is tolerable for you.
- Account for spread and slippage. Breakout entries can occur during fast moves where spreads widen. Factor realistic trading costs into any evaluation.
- Diversify and avoid over-leverage. Concentrating risk in one instrument or using excessive leverage can amplify losses well beyond expectations.
Risk Warning
Trading foreign exchange, CFDs, and other leveraged financial instruments involves substantial risk of loss and is not suitable for all investors. The strategies and tools discussed on this page are provided for educational purposes only and do not constitute financial advice, investment recommendations, or solicitation to trade. Always consult a qualified financial adviser before making trading decisions. Past backtest performance is not indicative of future results.
Downloads
- Expert Advisor: PivotRSIThrust.ex5 (55 downloads)
- Source Code: PivotRSIThrust.mq5 (57 downloads)
- Documentation: PivotRSIThrust.pdf (60 downloads)