
Disclaimer: This article is for educational and informational purposes only. It does not constitute financial or investment advice. Trading forex and CFDs carries significant risk of loss. Past performance of any strategy — including backtests — does not guarantee future results. Never trade with money you cannot afford to lose.
What Is This Strategy?
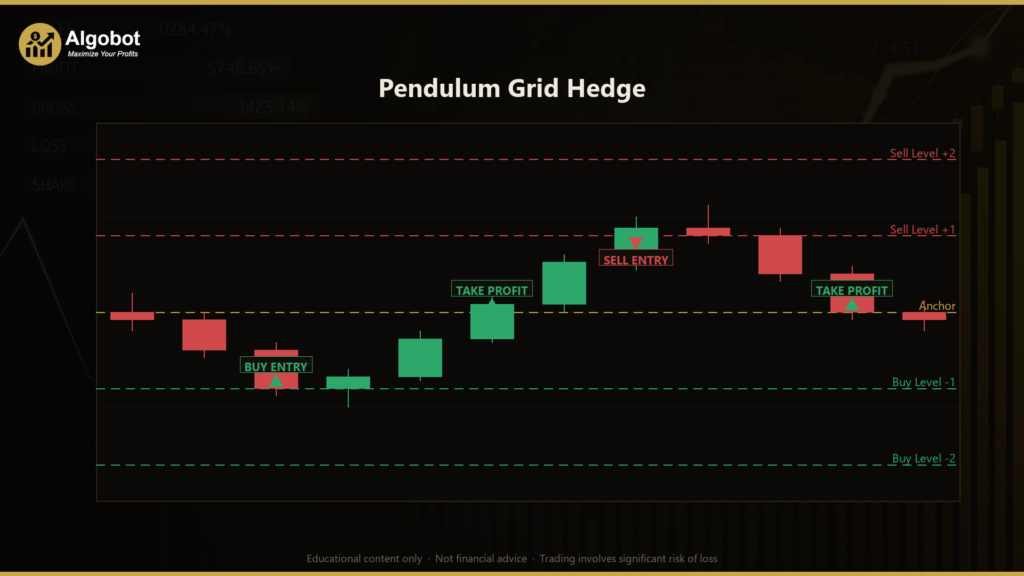
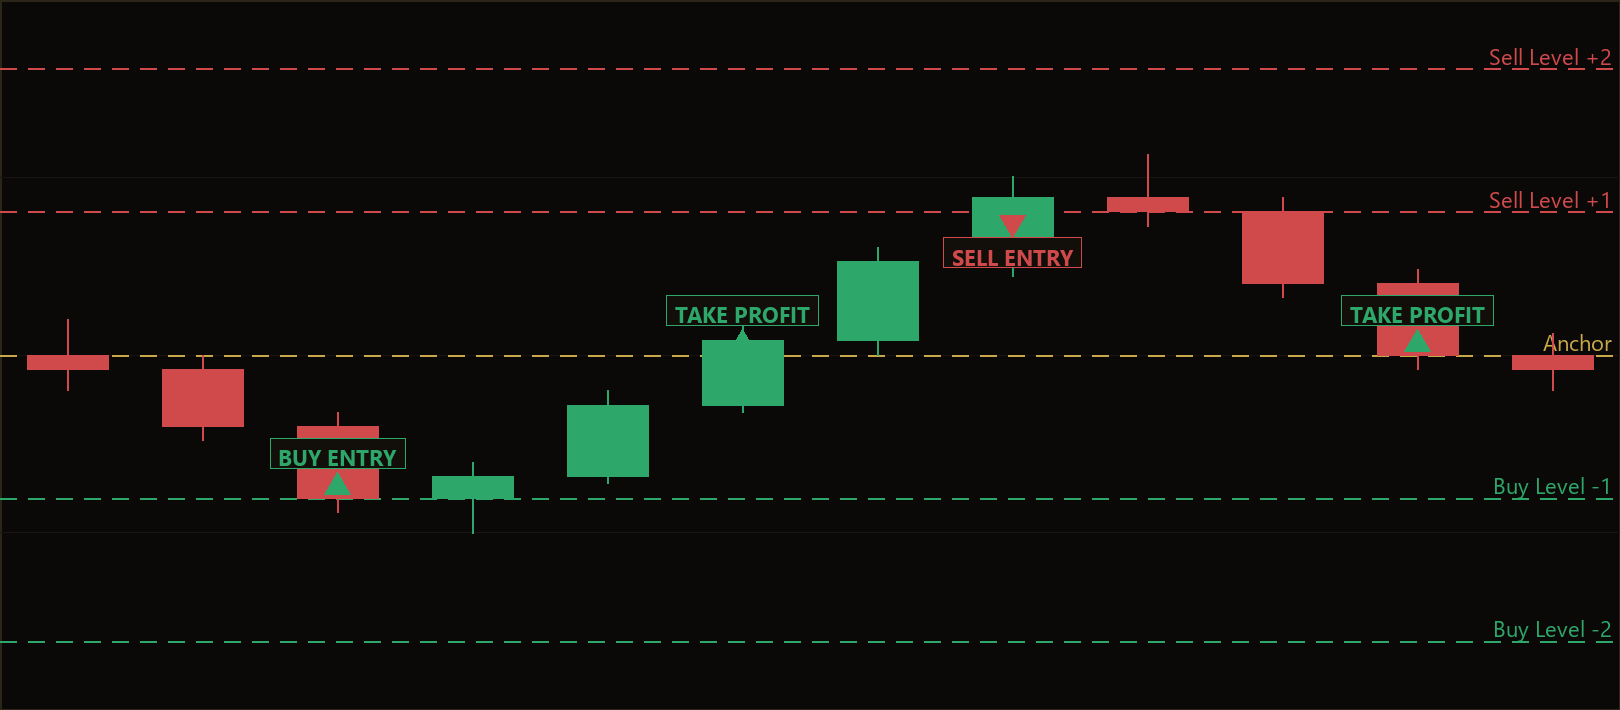
The Pendulum Grid Hedge is a pure grid-hedging Expert Advisor (EA) for MetaTrader 5 that uses no indicators of any kind — no moving average, RSI, ATR, pivots, or chart patterns. Instead, every decision is driven purely by price relative to a fixed horizontal grid of price levels. In trading terminology, a "grid" is a ladder of evenly spaced price lines, and "hedging" means simultaneously holding both long (buy) and short (sell) positions so that opposing exposure cancels out a large part of the directional risk. This combination makes the Pendulum Grid Hedge a classic mean-reversion, range-trading system.
The core idea is captured in the name. A pendulum swings back and forth around a centre point, and this strategy assumes price will oscillate around a fixed anchor — the centre of the grid set whenever the account is flat for this EA's Magic number. When price drifts below the anchor, the strategy buys the dip; when price rallies above the anchor, it sells the rally. Both sides expect price to "swing back" toward the anchor, where small per-leg profits are harvested as the market ranges.
As a learning tool, the Pendulum Grid Hedge is best suited to traders who want to understand how grid and hedging logic behave in range-bound, mean-reverting markets such as a liquid forex major. It is not a trend-following system, and grids are known to struggle in strong one-way moves. Treat this EA as a study of recovery-grid mechanics and basket money management rather than as a profit opportunity. Throughout this article, the goal is to explain how the strategy signals and manages risk — not to suggest any outcome.
How It Works
The Pendulum Grid Hedge lays out a symmetric ladder of price levels around the anchor, spaced GridStepPoints apart, then reacts to price crossing those levels. Here is the logic in plain English:
- Setting the anchor: Whenever the account is flat (no open positions for this Magic number), the strategy sets the anchor at the current mid-price. This becomes the centre of the grid.
- Building the ladder: Around the anchor, levels are placed at
anchor − k × step(the buy zone below) andanchor + k × step(the sell zone above), where k runs from 1 up toMaxLevels. - Long entries (buy the dip): When price crosses down through a level below the anchor, the strategy signals a BUY, expecting a bounce back toward the anchor.
- Short entries (sell the rally): When price crosses up through a level above the anchor, the strategy signals a SELL, expecting a drop back toward the anchor.
- Why it is a hedge: In a range, buys accumulate below the anchor while sells accumulate above it at the same time. The basket therefore holds opposing long and short exposure simultaneously — a genuine hedge that nets out much of the directional risk while the individual legs scalp the oscillation between grid lines.
- Per-leg take-profit: Every leg is given a fixed take-profit
TpStepsgrid-steps toward the anchor (a buy targets one step up, a sell one step down), so legs cash out as price pendulums back and forth. - Per-leg stop-loss: Every leg also carries a fixed catastrophic stop-loss
StopGridStepssteps the wrong way, so a single runaway leg can never live forever. - Basket take-profit: If the whole basket's floating profit reaches
BasketTpMoney(in account currency), the strategy closes everything and re-anchors — banking the net result after a deep excursion reverts. - Basket stop-loss: If the basket's floating loss reaches
BasketSlMoney, the strategy flattens the entire basket. This is the hard ceiling on grid risk, designed to cap the damage when a grid is caught in a strong trend. - Spread guard: New legs are skipped while the spread is wider than
MaxSpreadPoints, helping avoid entries during illiquid or volatile conditions. Existing legs are unaffected. - Re-arming levels: When a leg closes on its own take-profit or stop-loss, that grid level is "re-armed" so it can trigger again on the next crossing.
Strategy Parameters
| Parameter | Default | Min | Max | Description |
|---|---|---|---|---|
| GridStepPoints | 200 | 20 | 3000 | Spacing between adjacent grid lines, in points (price = points × Point). |
| MaxLevels | 6 | 1 | 20 | Maximum number of open legs per side; caps total grid exposure. |
| TpSteps | 1 | 1 | 5 | Per-leg take-profit distance toward the anchor, measured in grid steps. |
| StopGridSteps | 12 | 2 | 50 | Per-leg catastrophic stop-loss distance the wrong way, in grid steps. |
| LotMultiplier | 1.00 | 1.00 | 2.00 | Volume multiplier applied per extra level of depth (1.0 = flat, non-martingale grid). |
| BasketTpMoney | 30.0 | 5.0 | 2000.0 | Close the whole basket once floating profit reaches this (account currency). |
| BasketSlMoney | 500.0 | 50.0 | 100000.0 | Flatten the whole basket once floating loss reaches this (account currency). |
| MaxSpreadPoints | 50 | 0 | 500 | Skip new legs while the spread (points) is wider than this (0 = off). |
| Lots | 0.01 | 0.01 | 1.00 | Base trade volume per leg, in lots. |
| Magic | 5201 | 0 | 9,999,999 | Magic number that identifies and isolates this EA's positions. |
A note on LotMultiplier: leaving it at 1.00 keeps every leg the same size — a flat grid. Values above 1.00 size deeper levels up, which is a martingale-style behaviour that increases risk substantially. Beginners studying this strategy should generally keep it at 1.00.
Recommended Chart Settings
The Pendulum Grid Hedge was designed for a liquid, range-prone forex major such as EURUSD on the M15 (15-minute) timeframe — the natural habitat of a mean-reversion hedged grid. Lower-volatility majors with tight spreads tend to respect horizontal ranges more often than exotic or highly volatile pairs.
Keep in mind that grid behaviour is highly sensitive to the chosen symbol, timeframe, and grid spacing. Results will vary considerably across different market conditions, brokers, and account currencies. Always re-test the parameters on the exact symbol and broker feed you intend to use before drawing any conclusions.
Historical Backtest Results
Note: The figures below are from a historical backtest simulation. Backtests have inherent limitations — they do not account for slippage, requotes, spread widening, or psychological factors. These results should not be interpreted as a prediction of future performance.
No backtest data is available for the Pendulum Grid Hedge at the time of writing. When you run your own backtest in the MetaTrader 5 Strategy Tester, you can evaluate metrics such as net profit, profit factor, Sharpe ratio, win rate, maximum drawdown percentage, and total trades. Because this EA hedges and uses basket-level exits, pay particular attention to maximum drawdown and the depth of floating loss the basket reaches before recovering — these reveal the true risk profile of a grid far better than the headline net profit figure.
How to Install on MetaTrader 5
- Download the
PendulumGridHedge.ex5file from the link below. - Copy it to your MT5
MQL5\Expertsfolder. - Restart MetaTrader 5 or refresh the Navigator panel.
- Drag the EA onto a chart matching the recommended symbol and timeframe (for example, EURUSD M15).
- Configure the input parameters and enable Algo Trading.
What to Consider Before Using This EA
The Pendulum Grid Hedge has clear strengths and equally clear limitations, and an honest assessment matters more than any sales pitch.
Strengths. In genuinely range-bound markets, the simultaneous long-and-short structure means much of the directional risk nets out, and the per-leg take-profits can harvest the back-and-forth oscillation between grid lines. Because there are no indicators, there is no lag and no curve-fit signal logic — the behaviour is transparent and easy to reason about. Every leg has a fixed stop-loss, and the basket has a hard money stop, so risk is bounded by design rather than left open-ended.
Limitations. Grids are fundamentally counter-trend, and their best-known weakness is a strong, sustained one-way move. In a trending market, losing legs accumulate on one side while the favourable side keeps re-anchoring small wins — the classic grid failure mode the BasketSlMoney ceiling exists to contain. If LotMultiplier is raised above 1.00, the strategy takes on martingale characteristics, where deeper levels are sized larger; this can deepen drawdowns sharply. Wide spreads, swap costs on positions held overnight, and broker hedging rules can also materially affect results. This EA is best understood as an educational study of grid and hedging mechanics, not as a hands-off solution.
Risk Management Tips
Sound risk management is the most important skill any trader can study. Whether or not you ever run this EA, the following principles apply broadly:
- Start on a demo account. Run the strategy on a demo or paper-trading account first so you can observe how the grid builds, hedges, and exits without risking capital.
- Size positions conservatively. A common guideline is to risk no more than 1–2% of account equity on any single idea. With a grid, remember that "one idea" is the entire basket, not a single leg — size the whole grid accordingly.
- Respect the basket stop. The
BasketSlMoneyvalue is your hard ceiling on loss for this EA. Set it to an amount you are genuinely prepared to lose, and do not disable it. - Understand drawdown. Grids can show a long run of small wins followed by a single large loss. Study the maximum drawdown your settings produce, and ask whether you could tolerate it emotionally as well as financially.
- Keep leverage modest. Lower leverage gives the basket more room to breathe before margin becomes a problem.
- Review regularly. Markets change. A range that suited the grid can become a trend without warning, so monitor performance and be ready to intervene.
Risk Warning
Trading foreign exchange, CFDs, and other leveraged financial instruments involves substantial risk of loss and is not suitable for all investors. The strategies and tools discussed on this page are provided for educational purposes only and do not constitute financial advice, investment recommendations, or solicitation to trade. Always consult a qualified financial adviser before making trading decisions. Past backtest performance is not indicative of future results.
Downloads
- Expert Advisor: PendulumGridHedge.ex5 (0 downloads)
- Source Code: PendulumGridHedge.mq5 (1 downloads)
- Documentation: PendulumGridHedge.pdf (1 downloads)