Disclaimer: This article is for educational and informational purposes only. It does not constitute financial or investment advice. Trading forex and CFDs carries significant risk of loss. Past performance of any strategy — including backtests — does not guarantee future results. Never trade with money you cannot afford to lose.
What Is This Strategy?
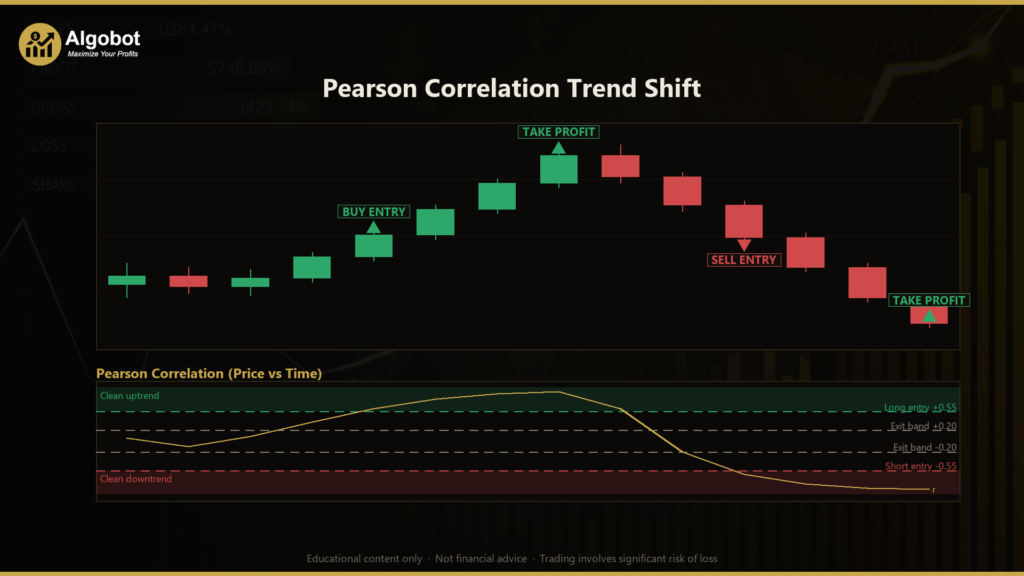
Pearson Correlation Trend Shift is a trend-emergence trading strategy built on the Pearson correlation coefficient measured between price and time — the same idea behind John Ehlers' well-known Correlation Trend Indicator (CTI). Instead of asking "how fast is price moving?", this indicator asks a subtly different question: "how consistently is price moving in a straight line?" The strategy uses this reading to detect the moment a clean, orderly trend begins to emerge from choppy, directionless price action, and it trades that shift in both directions — long and short.
The core mechanic is straightforward. Over a lookback window of N bars, the strategy calculates the correlation r between the closing prices and a rising time ramp (0, 1, 2, … N-1). Because correlation is covariance divided by the product of the two standard deviations, r is always bounded between −1 and +1 and is completely scale-free. A reading near +1 means price is climbing along a near-perfect straight line (a clean uptrend), a reading near −1 means it is falling along a straight line (a clean downtrend), and a reading near 0 means price is wandering with no linear direction (range, chop, or cycle). Crucially, this behaves the same across every symbol and timeframe without any per-market tuning, because it measures linearity rather than magnitude.
As a learning tool, this strategy is well suited to traders who want to understand the difference between momentum and trend quality. A regression slope tells you how quickly price is moving and grows with volatility; correlation tells you how orderly the move is regardless of how big it is. A slow, tidy drift and a fast, tidy run both read near ±1, while a violent but erratic market reads near 0. Studying how the strategy responds to those situations is a useful way to build intuition about when a trend is genuinely "real" versus merely fast and noisy.
How It Works
The strategy acts only once per completed bar. On each new bar it recomputes the price-vs-time correlation r, compares it to the previous reading to detect a fresh threshold cross, and then applies its entry, exit, and reversal logic. Using a fresh cross (rather than simply "r is above a level") fires discrete, one-time entries instead of re-triggering every tick, which filters out low-correlation chop and produces fewer, cleaner signals.
Entry conditions:
- The strategy signals a long when
rfreshly crosses up through the positive entry threshold (+EntryThreshold). This indicates an orderly uptrend is establishing itself out of prior noise. - The strategy signals a short when
rfreshly crosses down through the negative entry threshold (−EntryThreshold), indicating an orderly downtrend is forming.
Exit and reversal conditions:
- Exit-and-reverse: If the strategy is long and a fresh short signal appears (or vice versa), it closes the current position and opens one in the opposite direction. The trend structure has flipped.
- Consistency-decay exit: While long, the strategy exits if
rfalls back below the positive exit threshold (+ExitThreshold); while short, it exits ifrrises back above the negative exit threshold (−ExitThreshold). The reasoning is that the linear structure that justified the trade has broken down, even if price has not yet hit a stop. The exit band is always kept strictly inside the entry band so a position cannot open and immediately fail its own decay test.
Stop-loss and take-profit logic:
- Every position is protected by an ATR-based stop-loss and take-profit. The Average True Range (ATR) is a volatility measure that estimates the typical price movement per bar.
- The stop-loss is placed
SlAtrMult × ATRaway from the entry price, and the take-profit is placedTpAtrMult × ATRaway. With the default 2.0 stop and 3.0 target multipliers, the strategy aims for roughly a 1.5-to-1 reward-to-risk geometry, though the actual distance in price terms adapts automatically to current volatility.
While a position is open and neither a reversal nor a decay exit is triggered, the trade is simply left to be managed by its ATR stop and target.

Strategy Parameters
| Parameter | Default | Min | Max | Description |
|---|---|---|---|---|
| CorrPeriod | 20 | 8 | 60 | Number of bars in the Pearson correlation window. Shorter values react faster to emerging trends but are noisier; longer values are smoother and slower. |
| EntryThreshold | 0.55 | 0.30 | 0.90 | The correlation level a fresh cross must reach to signal a trade. Higher values demand a cleaner, more linear trend before entering. |
| ExitThreshold | 0.20 | 0.00 | 0.60 | The consistency-decay level. When correlation falls back toward this band, the strategy exits because the linear structure has weakened. |
| AtrPeriod | 14 | 7 | 30 | Lookback period for the ATR volatility measure used to size the stop-loss and take-profit. |
| SlAtrMult | 2.0 | 1.0 | 4.0 | Stop-loss distance as a multiple of ATR. Larger values give trades more room but risk more per trade. |
| TpAtrMult | 3.0 | 1.0 | 6.0 | Take-profit distance as a multiple of ATR. Sets the profit target relative to volatility. |
| Lots | 0.10 | 0.01 | 1.0 | Fixed trade volume in lots. Should be adjusted to match your account size and risk tolerance. |

Recommended Chart Settings
Because the correlation coefficient is inherently scale-free, this strategy is designed to behave consistently across a wide range of symbols and timeframes without re-tuning. A sensible starting point for study is a major forex pair such as EUR/USD on the H1 (1-hour) timeframe, which offers a balance between signal frequency and noise. Traders exploring the strategy may also examine it on H4 or daily charts for slower, more deliberate signals, or on lower timeframes for more frequent activity.
Keep in mind that results will vary meaningfully across different market conditions. A window and threshold combination that produces clean signals during a trending period may generate frequent whipsaws during a prolonged range. Always test any settings on historical data and a demo account before considering live use.
How to Install on MetaTrader 5
- Download the .ex5 file from the link below
- Copy it to your MT5
MQL5\Expertsfolder - Restart MetaTrader 5 or refresh the Navigator panel
- Drag the EA onto a chart matching the recommended symbol and timeframe
- Configure the input parameters and enable Algo Trading
What to Consider Before Using This EA
Strengths of this approach. The Pearson correlation is an elegant, robust way to distinguish orderly trends from noise, and its scale-free nature means it does not need to be re-calibrated for each instrument's price level or volatility. The fresh-cross entry logic keeps the strategy from over-trading in flat markets, and the dual exit system — reversal plus consistency decay — gives it a principled reason to leave a trade before the stop is hit when a trend loses its linear character. The always-on ATR stop and target impose disciplined, volatility-adaptive risk control on every position.
Known limitations. Correlation measures linearity, not profitability. A market can climb along a beautifully straight line and then reverse the moment the strategy enters, and correlation reacts to price rather than predicting it. Like all trend-following logic, this approach is prone to whipsaws in choppy, range-bound conditions, where r can flicker across the threshold and generate a cluster of losing entries. The exit-and-reverse behaviour can compound losses during a sideways market that repeatedly fakes trend emergence in alternating directions. The fixed lot size does not scale risk to account equity, and the strategy holds only one position at a time, so it will sit out further moves while managing an existing trade.
Where it may underperform. Tight, low-volatility ranges and news-driven spike environments are the hardest conditions for this indicator. Because it acts once per completed bar, it can also be slow to react to sudden reversals that unfold within a single bar. Treat it as a framework for studying trend-quality measurement, not as a finished, all-weather system.
Risk Management Tips
Sound risk management matters far more than any single indicator. Consider the following general principles as you study this strategy:
- Risk a small, fixed fraction per trade. A common educational guideline is to risk no more than 1–2% of account equity on any one position. Set your lot size so that the ATR-based stop distance corresponds to that fraction, rather than using an arbitrary fixed lot.
- Always trade a demo account first. Run the strategy on a demo or paper account across many market conditions before ever committing real capital, so you understand how it behaves in trends, ranges, and volatile news periods.
- Understand drawdown. Every strategy experiences losing streaks. Know the maximum peak-to-trough equity decline you are willing to tolerate, and how many consecutive losses that implies at your chosen risk level.
- Diversify and avoid over-leverage. Concentrating all risk in a single symbol or using excessive leverage can turn a normal drawdown into an account-ending event.
- Review and adjust periodically. Markets evolve. Periodically re-examine whether your parameter choices still make sense, and never assume that historical behaviour will repeat.
Risk Warning
Trading foreign exchange, CFDs, and other leveraged financial instruments involves substantial risk of loss and is not suitable for all investors. The strategies and tools discussed on this page are provided for educational purposes only and do not constitute financial advice, investment recommendations, or solicitation to trade. Always consult a qualified financial adviser before making trading decisions. Past backtest performance is not indicative of future results.
Downloads
- Expert Advisor: PearsonCorrelationTrendShift.ex5 (47 downloads)
- Source Code: PearsonCorrelationTrendShift.mq5 (48 downloads)
- Documentation: PearsonCorrelationTrendShift.pdf (63 downloads)