Disclaimer: This article is for educational and informational purposes only. It does not constitute financial or investment advice. Trading forex and CFDs carries significant risk of loss. Past performance of any strategy — including backtests — does not guarantee future results. Never trade with money you cannot afford to lose.
What Is This Strategy?
The Parabolic Stall Reversal is a pure price-action exhaustion-reversal strategy for MetaTrader 5 that uses no technical indicators at all — every decision is derived directly from raw candlestick OHLC (open, high, low, close) data. Instead of leaning on moving averages or oscillators, it reads the shape of recent price movement: a run of strong, same-coloured candles that accelerates into a fresh extreme and then suddenly "runs out of fuel." This kind of climactic move-and-stall pattern is what traders often call exhaustion.
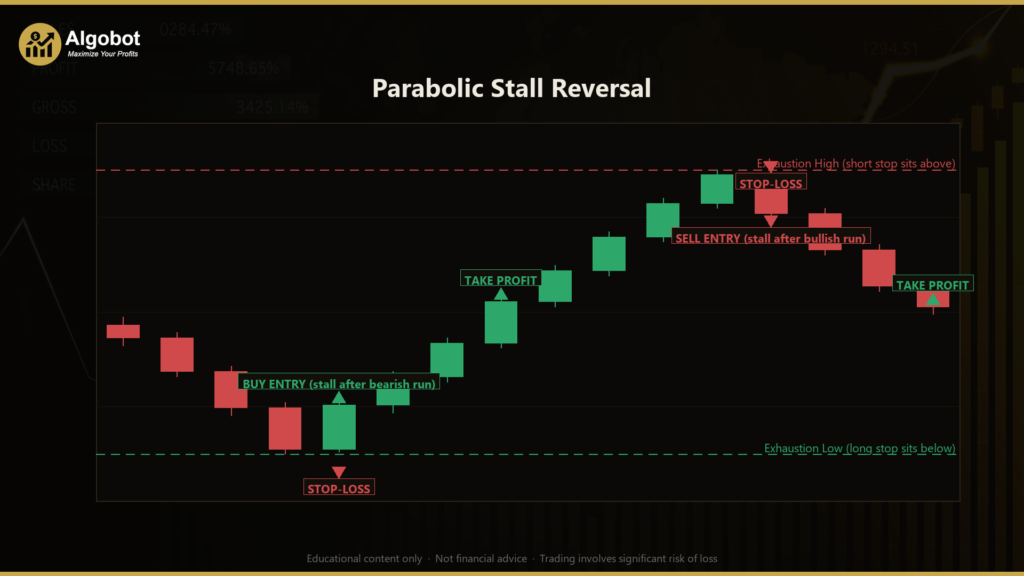
The strategy is built for trending, momentum-driven markets where price occasionally over-extends in one direction. A "parabolic thrust" — a rapid, accelerating advance — frequently ends not with a gentle roll-over but with a sharp rejection candle as late buyers (or sellers) are exhausted. The Parabolic Stall Reversal is designed to wait patiently for that specific moment: the bar immediately after the extreme that decisively reverses colour and closes back through the prior bar. It then trades against the exhausted move — short after a bullish peak, long after a bearish trough.
This makes it a useful learning tool for traders who want to study counter-trend and reversal logic, candlestick rejection patterns, and structural (price-derived) stop placement. Because the entire approach is mechanical and indicator-free, it is also a clean example of how a complete trading rule set can be expressed purely through OHLC relationships. As with any reversal system, it is best treated as an educational study of how exhaustion conditions can be defined and tested — not as a shortcut to results.
How It Works
The strategy evaluates the chart once per newly closed candle, never on every tick, so signals are stable and do not repaint mid-bar. It also holds only one position at a time for its magic number and lets the stop-loss and take-profit manage every exit.
Before any signal can form, the strategy measures the average bar range over the most recent RangePeriod candles (high minus low). This average becomes the yardstick for both the "thrust" requirement and the stop buffer — a simple, indicator-free way to adapt to current volatility.
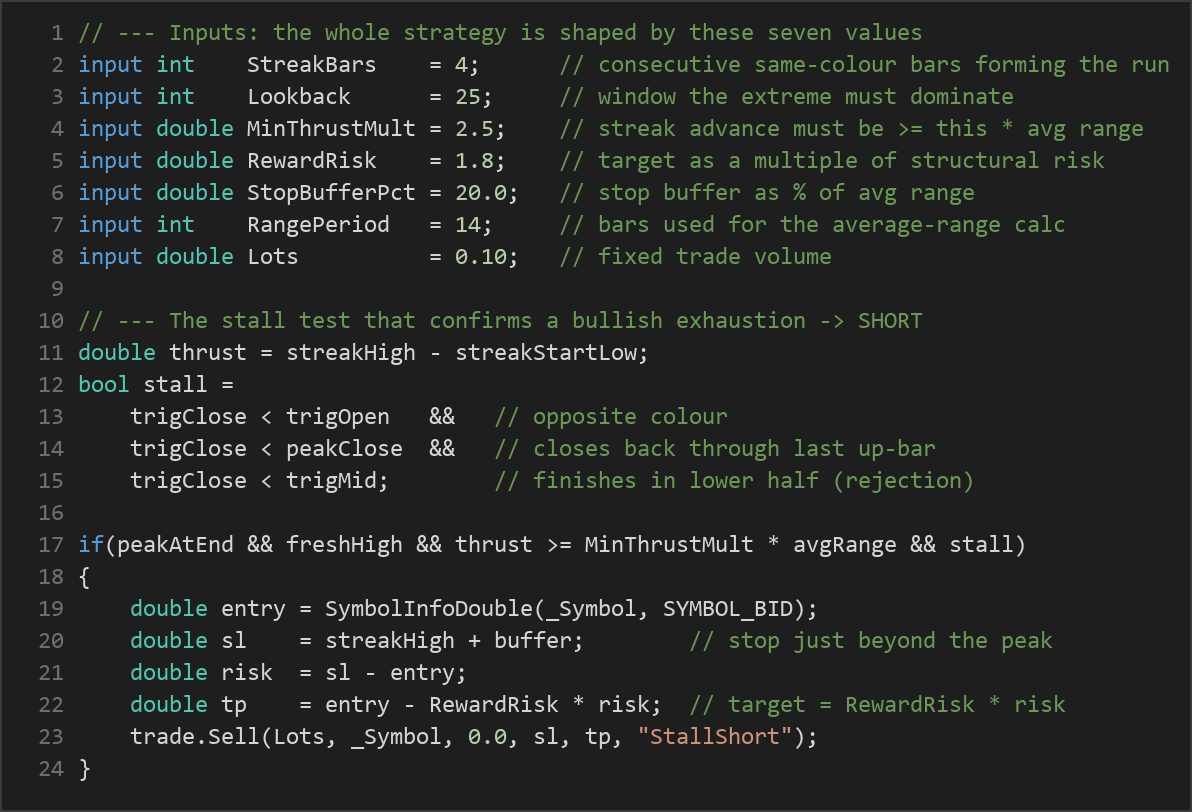
The strategy signals a SHORT (after a bullish exhaustion peak) when all of the following are true:
- A streak of
StreakBarsconsecutive bullish candles (close above open) has just completed. - The most recent streak bar prints the highest high of the streak — price was still advancing into the peak (an accelerating, "parabolic" run).
- That peak is a fresh extreme: no candle in the
Lookbackwindow beyond the streak reached as high. This confirms the move pushed into genuinely new territory. - The thrust (peak high minus the streak's starting low) is at least
MinThrustMulttimes the average bar range — i.e. the run was meaningfully large, not a quiet drift. - The very next closed candle stalls the run: it is the opposite colour (bearish), it closes back below the previous up-bar's close, and it finishes in the lower half of its own range — a decisive rejection of higher prices.
The strategy signals a LONG (after a bearish exhaustion trough) under the mirror-image conditions: a streak of StreakBars bearish candles into a fresh Lookback low, a thrust of at least MinThrustMult × average range, and a stall candle that is bullish, closes back above the prior down-bar's close, and finishes in the upper half of its own range.
Stop-loss logic (structural):
- For shorts, the stop sits just above the exhaustion peak (the streak's highest high) plus a buffer.
- For longs, the stop sits just below the exhaustion trough (the streak's lowest low) minus a buffer.
- The buffer equals
StopBufferPctpercent of the average bar range, so the stop is placed beyond the structural extreme rather than at an arbitrary fixed distance.
Take-profit logic:
- The risk (distance from entry to stop) is measured, and the target is placed at
RewardRisk× that risk on the opposite side of entry. ARewardRiskof 1.8, for example, sets a target 1.8 times larger than the distance to the stop.
If the calculated risk is not positive (for example, if entry sits beyond the stop after spread), the trade is skipped.
Strategy Parameters
| Parameter | Default | Min | Max | Description |
|---|---|---|---|---|
| StreakBars | 4 | 3 | 8 | Number of consecutive same-colour candles required to form the exhaustion run. |
| Lookback | 25 | 10 | 60 | How many bars beyond the streak the extreme must dominate to count as a fresh high/low. |
| MinThrustMult | 2.5 | 1.0 | 6.0 | The streak's net advance must be at least this multiple of the average bar range. |
| RewardRisk | 1.8 | 0.5 | 5.0 | Take-profit distance as a multiple of the structural stop distance (risk). |
| StopBufferPct | 20.0 | 0.0 | 100.0 | Extra stop padding beyond the extreme, as a percentage of average bar range. |
| RangePeriod | 14 | 5 | 30 | Number of bars used to compute the average bar range for thrust and buffer sizing. |
| Lots | 0.10 | 0.01 | 1.0 | Fixed trade volume in lots. |
Recommended Chart Settings
The Parabolic Stall Reversal was designed as a general-purpose price-action study and is not hard-coded to a single market. A sensible starting point for experimentation is a major forex pair (such as EUR/USD) on an intraday-to-swing timeframe like H1 or H4, where momentum runs and exhaustion candles tend to be well-defined and spreads are relatively low.
Because the thrust and buffer calculations scale to each instrument's own average range, the logic can be tested across other symbols and timeframes as well. Keep in mind that results will vary considerably across different market conditions, instruments, and broker data feeds. Always study the behaviour on a demo account and over multiple market regimes before drawing any conclusions.
How to Install on MetaTrader 5
- Download the .ex5 file from the link below
- Copy it to your MT5
MQL5\Expertsfolder - Restart MetaTrader 5 or refresh the Navigator panel
- Drag the EA onto a chart matching the recommended symbol and timeframe
- Configure the input parameters and enable Algo Trading
What to Consider Before Using This EA
Strengths. The approach is transparent and fully mechanical — there are no hidden indicator buffers or repainting concerns, since every condition comes from closed-candle OHLC. The stop placement is structural (anchored to the real exhaustion extreme rather than a fixed pip count), and the multi-condition filter — streak, fresh extreme, thrust multiple, and a decisive stall candle — is deliberately strict, which historically helps reduce low-quality signals.
Limitations. Counter-trend and reversal systems face a well-known challenge: a strong trend can keep extending well past what looks like exhaustion, turning an apparent "stall" into a brief pause before the trend resumes. In persistently trending or news-driven markets, the strategy may signal early and be stopped out beyond the extreme. The strict entry filter also means signals can be infrequent, so patience and a long evaluation window are required to judge it fairly. In choppy, low-momentum conditions, the thrust requirement may rarely be met at all.
This EA is best understood as an educational framework for studying exhaustion and rejection behaviour — not as a finished, ready-to-deploy income tool. Treat every parameter as something to test and understand, not as a setting to trust blindly.
Risk Management Tips
- Position sizing matters more than entries. Consider risking no more than 1–2% of account equity per trade, and size your lots so that the distance to the structural stop fits within that limit rather than using a fixed lot blindly.
- Demo first. Run the strategy on a demo account across varied market conditions before considering any live use, so you understand its signal frequency and drawdown behaviour.
- Understand drawdown. Even a well-defined reversal system will experience losing streaks. Know the maximum drawdown you are emotionally and financially prepared to tolerate before you begin.
- One position at a time. This EA intentionally holds a single position per magic number; avoid stacking multiple EAs on the same account without accounting for combined exposure.
- Account for costs. Spread, slippage, and swap can meaningfully affect a reversal entry placed right at an extreme — factor these into any evaluation.
Risk Warning
Trading foreign exchange, CFDs, and other leveraged financial instruments involves substantial risk of loss and is not suitable for all investors. The strategies and tools discussed on this page are provided for educational purposes only and do not constitute financial advice, investment recommendations, or solicitation to trade. Always consult a qualified financial adviser before making trading decisions. Past backtest performance is not indicative of future results.
Downloads
- Expert Advisor: ParabolicStallReversal.ex5 (42 downloads)
- Source Code: ParabolicStallReversal.mq5 (45 downloads)
- Documentation: ParabolicStallReversal.pdf (43 downloads)