Disclaimer: This article is for educational and informational purposes only. It does not constitute financial or investment advice. Trading forex and CFDs carries significant risk of loss. Past performance of any strategy — including backtests — does not guarantee future results. Never trade with money you cannot afford to lose.
What Is This Strategy?
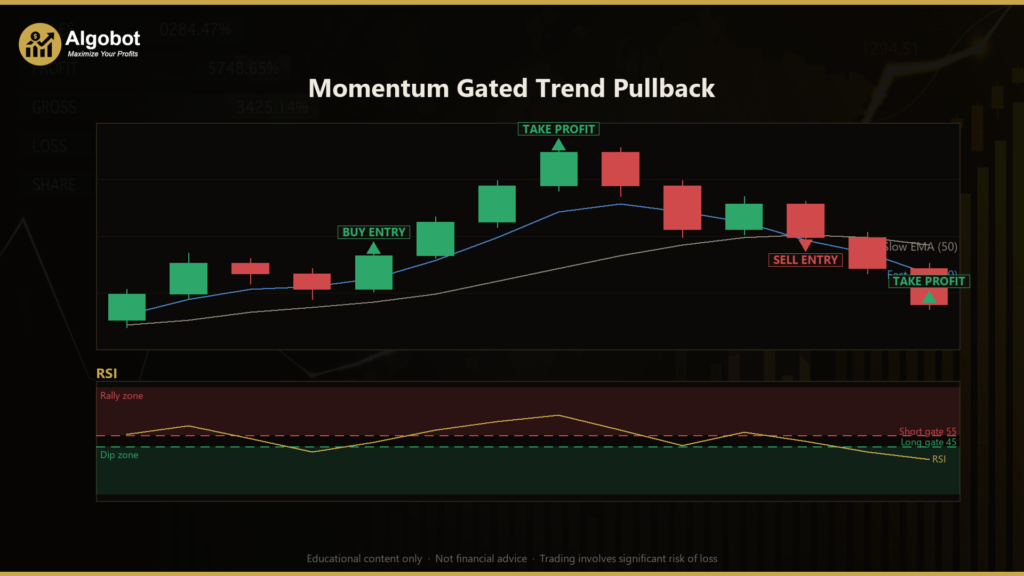
The Momentum Gated Trend Pullback strategy is a trend-following pullback system that combines an Exponential Moving Average (EMA) stack — a pair of moving averages that smooth price to reveal direction — with the Relative Strength Index (RSI), a momentum oscillator that measures the speed of recent price changes. Rather than chasing breakouts, it is designed to identify moments when a market pulls back briefly against an established trend and then resumes in the trend's direction, offering what is often considered a higher-quality entry point.
At its core, the strategy tries to answer two questions before it acts. First, is there a genuine trend? It requires a fast EMA to sit above (or below) a slow EMA, and it insists the slow EMA is actually sloping the right way over a lookback window — a filter meant to separate real trends from flat, choppy conditions. Second, has momentum reset and resumed? It waits for RSI to dip into a pullback zone and then cross back through a gate in the trend's favour. Only when both conditions align does the strategy signal an entry.
As a learning tool, this approach suits traders who want to study how multiple confirmation filters can be layered to reduce false signals, and how Average True Range (ATR) — a volatility measure — can be used to scale stop-losses and position sizes to current market conditions. It is a structured example of "buy the dip in an uptrend, sell the rally in a downtrend," expressed in code you can inspect, test, and modify on a demo account.
How It Works
The strategy evaluates its logic once per completed bar, using closed-bar data so that signals do not repaint mid-candle. Here is what happens on each new bar:
- Trend classification (the gate): The strategy calculates a fast EMA and a slow EMA. It also checks the slope of the slow EMA over a configurable lookback period. An uptrend is recognised when the fast EMA is above the slow EMA, the slow EMA is rising, and the closing price is above the slow EMA. A downtrend is the mirror image: fast below slow, slow EMA falling, and price below the slow EMA.
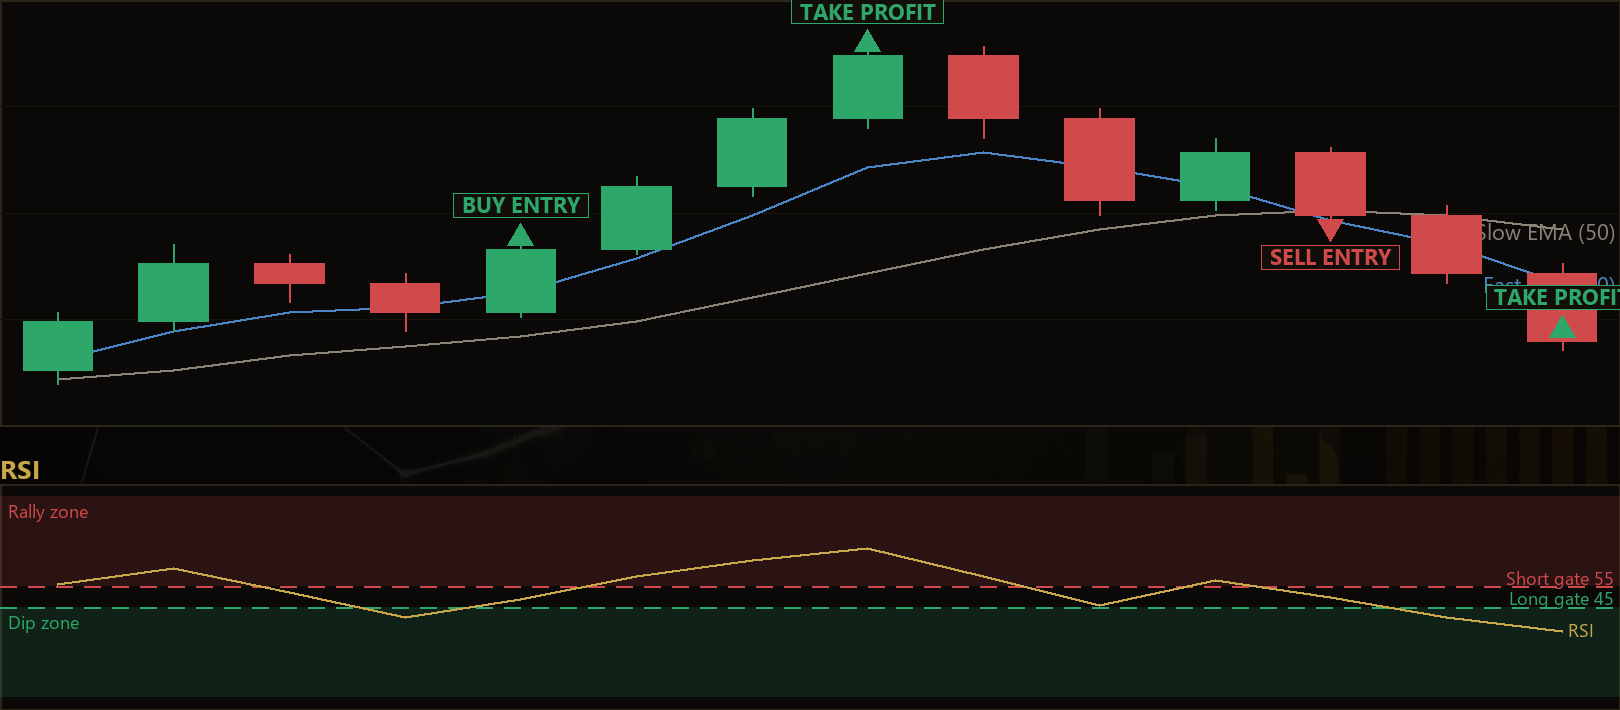
- Momentum reset and resume (the trigger): Within an uptrend, the strategy watches RSI. It looks for RSI to first dip below the pullback gate (for example, below 45) and then cross back up through it on the current bar. This two-step "reset then resume" is the signal that a pullback has ended and momentum is turning back with the trend.
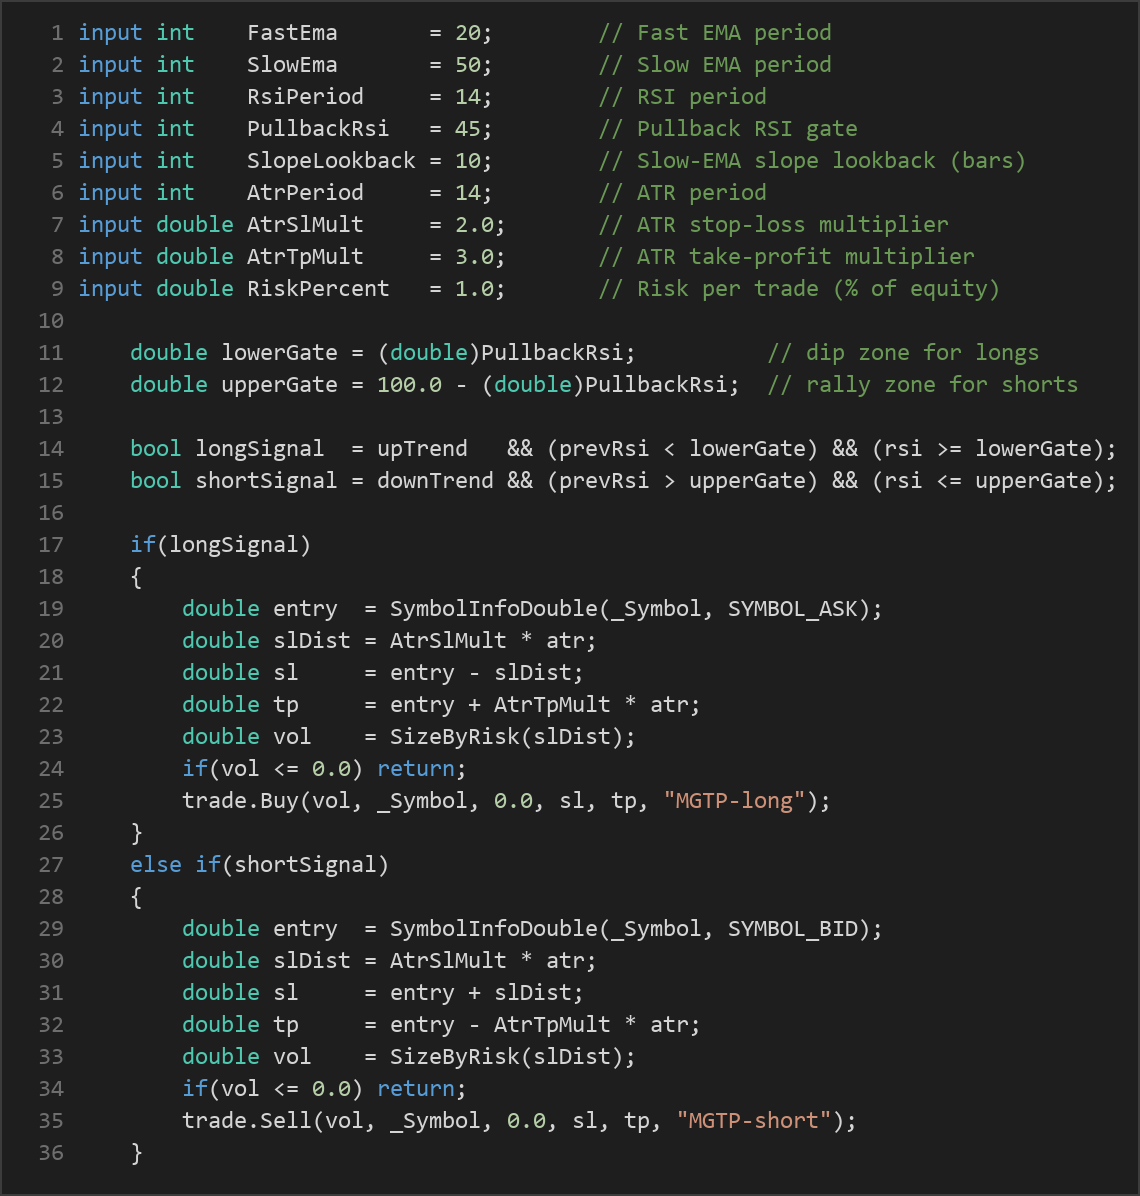
- Long entry signal: The strategy signals a buy when an uptrend is active, the previous bar's RSI was below the lower gate, and the current bar's RSI has crossed back to or above it.
- Short entry signal: The strategy signals a sell when a downtrend is active, the previous bar's RSI was above the upper gate (calculated as 100 minus the pullback value), and the current bar's RSI has crossed back down to or below it.
- Stop-loss logic: When an entry is triggered, the stop is placed at a distance of the ATR stop multiplier times the current ATR away from entry. Because ATR expands in volatile markets and contracts in quiet ones, the stop automatically adapts to conditions rather than using a fixed pip value.
- Take-profit logic: The target is placed at the ATR take-profit multiplier times ATR from entry. With the default settings, the target distance is larger than the stop distance, producing a reward-to-risk profile greater than one to one.
- Trend-flip protective exit: If a position is open and the EMA stack rolls over against it — the fast EMA crossing back below the slow for a long, or above it for a short — the strategy closes the trade early. This is intended to protect an open position when the trend that justified the entry appears to have ended before the stop or target is reached.
- Position sizing: Volume is derived from account risk. The strategy risks a fixed percentage of equity across the stop distance, then rounds and clamps the result to a tradable lot range. This means every trade is designed to risk a similar fraction of the account regardless of the instrument's volatility.
Only one position per magic number is held at a time, and no new entry is taken while a position or pending order already exists.
Strategy Parameters
| Parameter | Default | Min | Max | Description |
|---|---|---|---|---|
| FastEma | 20 | 8 | 40 | Period of the fast EMA that defines the near-term trend direction. |
| SlowEma | 50 | 30 | 120 | Period of the slow EMA; the trend anchor whose slope must confirm direction. |
| RsiPeriod | 14 | 7 | 21 | Lookback period for the RSI momentum oscillator. |
| PullbackRsi | 45 | 30 | 50 | The RSI gate level defining the pullback zone for longs; the short gate is 100 minus this value. |
| SlopeLookback | 10 | 3 | 25 | Number of bars used to measure whether the slow EMA is genuinely rising or falling. |
| AtrPeriod | 14 | 7 | 28 | Lookback period for the ATR volatility measure used to size stops and targets. |
| AtrSlMult | 2.0 | 1.0 | 4.0 | Multiplier applied to ATR to set the stop-loss distance. |
| AtrTpMult | 3.0 | 1.0 | 6.0 | Multiplier applied to ATR to set the take-profit distance. |
| RiskPercent | 1.0 | 0.25 | 3.0 | Percentage of account equity risked per trade, used to derive position size. |
Recommended Chart Settings
This strategy is built as a general trend-pullback framework and is not hard-coded to a single symbol. The default parameters — a 20/50 EMA stack with a 14-period RSI and ATR — are commonly associated with intraday to swing timeframes such as the H1 (1-hour) or H4 (4-hour) charts on major forex pairs. A trending instrument with reasonable liquidity tends to suit the design better than a range-bound, low-volatility one.
Because the EMA slope and RSI gate filters are sensitive to how a given market moves, results will vary considerably across different symbols, timeframes, and market conditions. Always test the specific combination you intend to use on historical data and on a demo account before drawing any conclusions.
How to Install on MetaTrader 5
- Download the .ex5 file from the link below
- Copy it to your MT5
MQL5\Expertsfolder - Restart MetaTrader 5 or refresh the Navigator panel
- Drag the EA onto a chart matching the recommended symbol and timeframe
- Configure the input parameters and enable Algo Trading
What to Consider Before Using This EA
Every strategy involves trade-offs, and understanding them is part of trading responsibly.
Strengths of this approach. By requiring both a sloped EMA stack and an RSI reset-and-resume, the strategy applies multiple filters before committing to a trade, which historically tends to reduce the number of low-quality signals compared with a single-indicator system. ATR-scaled stops adapt to changing volatility, and the risk-based position sizing is designed to keep the money at stake per trade roughly constant — a disciplined mechanism for bounding drawdown.
Known limitations. Trend-following pullback systems are, by nature, dependent on the presence of trends. In sideways or "chopping" markets, the EMA slope filter may still occasionally register a shallow trend, producing entries that get stopped out as price reverses. Moving averages and RSI are both lagging in different ways, so entries may arrive after a meaningful portion of a move has already occurred. The trend-flip exit can also close a position during a brief EMA whipsaw, only for the original trend to resume.
Where it may underperform. Expect heightened difficulty during low-volatility ranges, around major news events that cause sudden gaps, and in markets that grind sideways for extended periods. No parameter set performs equally well across all instruments and regimes, so ongoing testing and review are essential.
Risk Management Tips
Sound risk management matters more than any single entry signal. Consider these general principles as you study this strategy:
- Risk a small, fixed fraction per trade. Many educational sources suggest never risking more than 1–2% of account equity on a single position. The RiskPercent parameter lets you control this directly.
- Understand drawdown. Even a well-designed strategy will experience losing streaks. Study how consecutive losses would affect your account balance before committing real capital.
- Start on a demo account. Run the strategy in a simulated environment first to observe how it behaves across different market conditions without financial exposure.
- Size positions deliberately. Confirm that the contract size and lot limits match your broker and instrument so the calculated volume reflects your true intended risk.
- Review regularly. Markets evolve. Periodically re-evaluate whether the parameters and instrument still behave as expected, and be prepared to pause or adjust.
Risk Warning
Trading foreign exchange, CFDs, and other leveraged financial instruments involves substantial risk of loss and is not suitable for all investors. The strategies and tools discussed on this page are provided for educational purposes only and do not constitute financial advice, investment recommendations, or solicitation to trade. Always consult a qualified financial adviser before making trading decisions. Past backtest performance is not indicative of future results.
Downloads
- Expert Advisor: MomentumGatedTrendPullback.ex5 (58 downloads)
- Source Code: MomentumGatedTrendPullback.mq5 (60 downloads)
- Documentation: MomentumGatedTrendPullback.pdf (66 downloads)