
Disclaimer: This article is for educational and informational purposes only. It does not constitute financial or investment advice. Trading forex and CFDs carries significant risk of loss. Past performance of any strategy — including backtests — does not guarantee future results. Never trade with money you cannot afford to lose.
What Is This Strategy?
Modal Price Reversion is a volatility-normalised mean-reversion strategy built around one of the least-used but most intuitive statistics in trading: the mode. In statistics, the mode is simply the value that occurs most often in a data set. Applied to price, the modal price is the single level the market has visited and lingered at more than any other during a recent window — the price traders have most actively accepted. This strategy uses a volatility-scaled histogram of closing prices to find that level and then fades stretched moves back toward it.
Most "fair value" tools — the moving average (mean), the median, or VWAP (volume-weighted average price) — get dragged around by outliers and drift with every new bar. A single spike bar can pull a mean noticeably away from where the market has actually been trading. The mode ignores that. Because it counts how often price has been at each level rather than averaging the levels together, it points to a genuine acceptance zone — a "point of control" that behaves like a magnet. When price is stretched a long way from that zone and begins to snap back, the odds historically favour a return to the crowded level.
As a learning tool, Modal Price Reversion is well suited to traders who want to understand range-based mean reversion and how to build objective, self-scaling entry filters. It is deliberately designed for balanced, range-prone conditions on liquid instruments, and it includes an explicit "regime gate" that keeps it out of trends — the exact environment where fading is most dangerous. It is not a trend-following system, and it is not intended to trade continuously.
How It Works
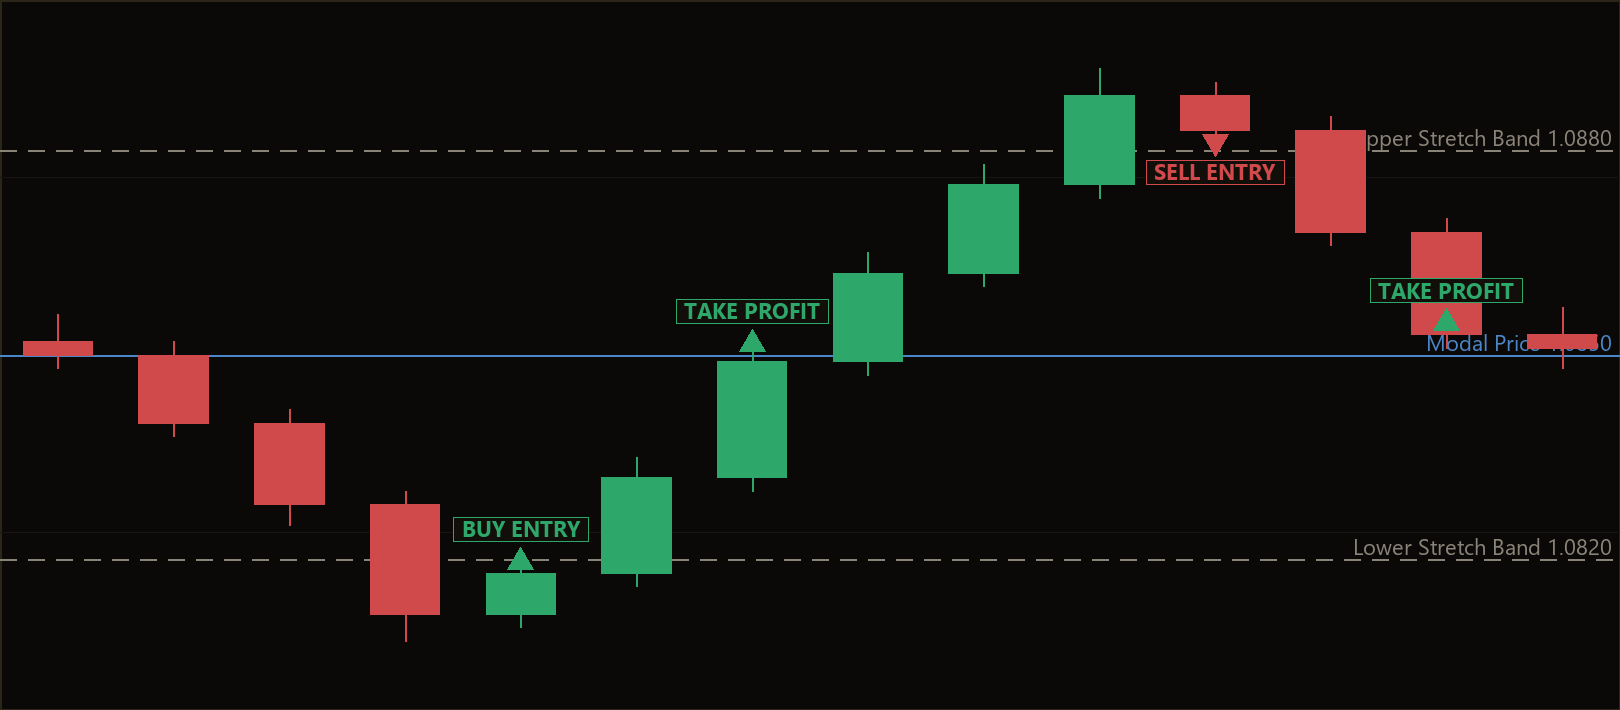
The Expert Advisor (EA) evaluates its logic once per completed bar. On each freshly closed candle, the strategy signals as follows:
- Measure volatility (ATR). The strategy first computes the Average True Range (ATR) — a measure of how far price typically moves per bar. Every distance in the system is expressed in multiples of ATR, so the same settings adapt automatically to a quiet pair or a volatile one, with no per-symbol point math.
- Build the price histogram. It takes the last
Lookbackclosed closing prices and sorts them into bins whose width isBinAtrFraction × ATR. The bin holding the most closes is the modal cluster. The modal price is the average of the closes inside that fullest bin — a de-noised "point of control". - Density gate (regime filter). The modal bin must contain at least
MinClusterFractionof all the closes in the window. A dense mode means the market is genuinely balanced and ranging around that level — a real acceptance zone. A thin, scattered mode usually means price is trending, so the strategy stands aside and does not fade. This is the single most important safeguard against fading a strong trend. - Stretch requirement. The just-closed candle's close must sit at least
StretchAtr × ATRaway from the modal price. This demands a statistically unusual deviation before any trade is considered — it will not react to small, normal wiggles around fair value. - Snap-back confirmation. Rather than catch a falling knife, the strategy waits for the reversal to actually begin. The signal candle must print a reversal body pointing back toward the mode: a bullish (up-closing) candle when price is stretched below, or a bearish (down-closing) candle when stretched above.
When all conditions align:
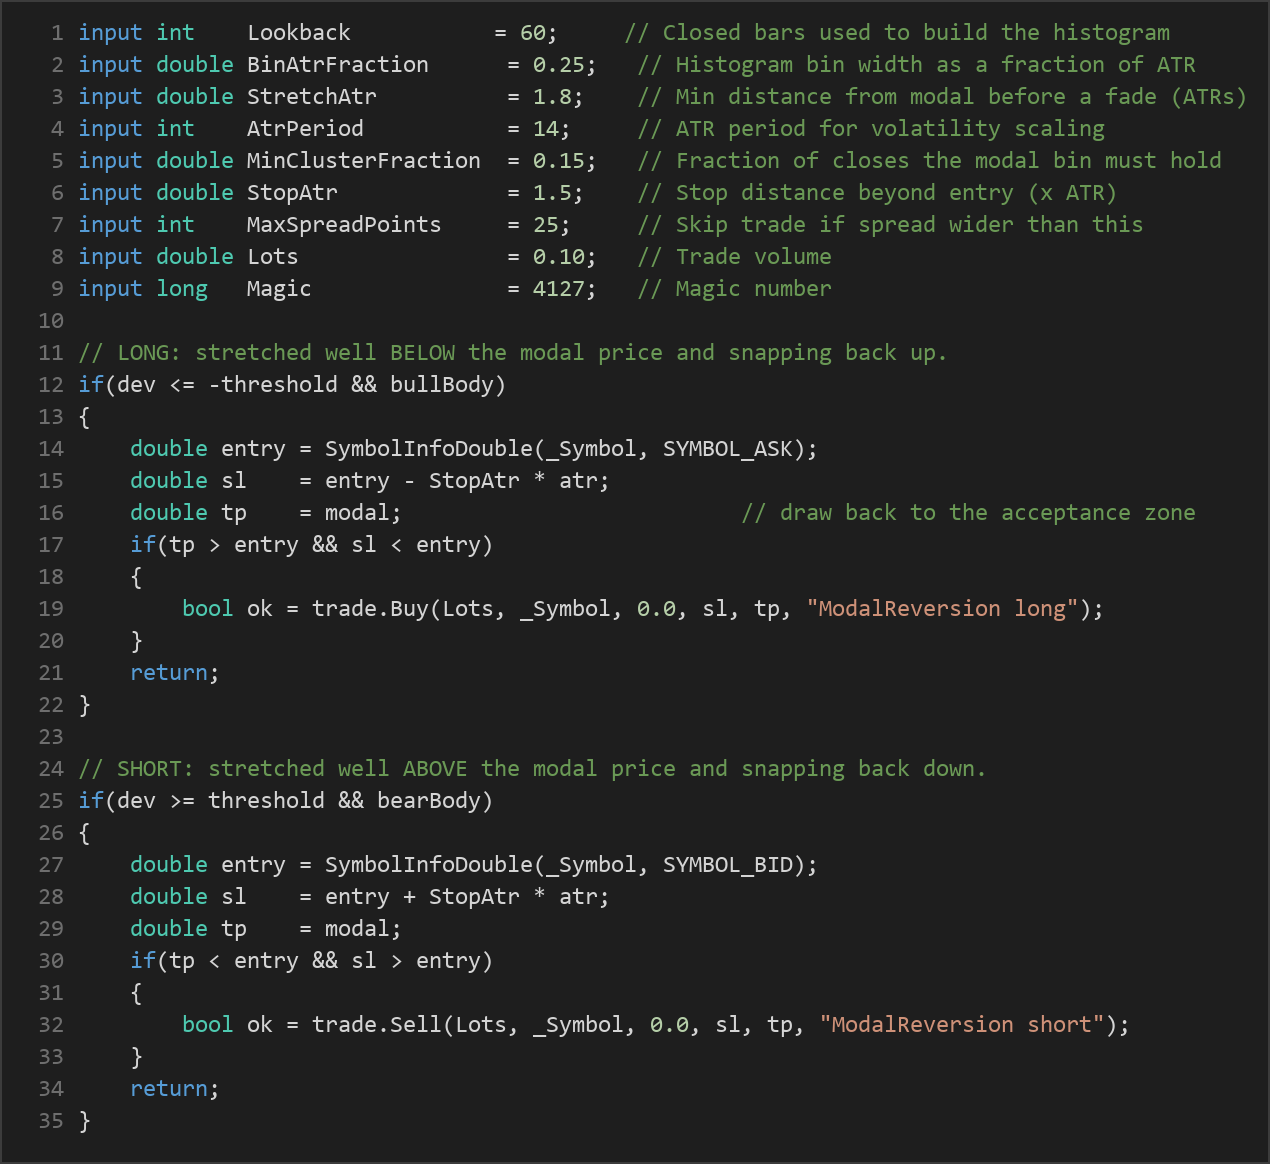
- Long signal: the close is at least
StretchAtr × ATRbelow the modal price and the candle closed up → the strategy buys, targeting the modal price. - Short signal: the close is at least
StretchAtr × ATRabove the modal price and the candle closed down → the strategy sells, targeting the modal price.
Exit logic is symmetric and fully bracketed on entry:
- Take-profit is placed at the modal price itself — the acceptance zone the move is expected to be drawn back toward.
- Stop-loss is set
StopAtr × ATRbeyond the entry, out past the extension where the reversion thesis would be proven wrong. - A spread gate skips the trade if the current spread (in points) is wider than
MaxSpreadPoints, keeping fills realistic. - Only one position at a time per magic number is allowed; the ATR stop and modal target manage the trade to completion.
Strategy Parameters
| Parameter | Default | Min | Max | Description |
|---|---|---|---|---|
| Lookback | 60 | 20 | 150 | Number of closed bars used to build the price histogram (the acceptance window). |
| BinAtrFraction | 0.25 | 0.10 | 0.60 | Histogram bin width as a fraction of ATR. Finer bins produce a sharper, more precise mode. |
| StretchAtr | 1.8 | 1.0 | 3.5 | Minimum distance from the modal price, in ATRs, before a fade is allowed. |
| AtrPeriod | 14 | 7 | 30 | ATR period used for volatility scaling of every distance in the system. |
| MinClusterFraction | 0.15 | 0.05 | 0.40 | Fraction of the window's closes the modal bin must hold to count as a dense, ranging acceptance zone (the regime gate). |
| StopAtr | 1.5 | 0.8 | 3.0 | Stop-loss distance beyond the entry, as a multiple of ATR. |
| MaxSpreadPoints | 25 | 1 | 200 | Skip the trade if the current spread (in points) is wider than this. |
| Lots | 0.10 | 0.01 | 1.00 | Trade volume in lots. |
| Magic | 4127 | 0 | 9,999,999 | Unique identifier so the EA manages only its own positions. |
Recommended Chart Settings
Modal Price Reversion was designed for balanced, range-prone conditions on liquid FX pairs or metals — for example EUR/USD, USD/JPY, or XAU/USD (gold). Because every threshold is expressed in ATR rather than fixed points, the strategy is single-timeframe and runs on whatever timeframe you apply it to. Intraday charts such as M15 to H1 are a natural starting point for studying range behaviour, but you should treat the timeframe as a variable to test rather than a fixed rule.
Keep in mind that results will vary considerably across different market conditions. A pair that ranges cleanly in one month may trend strongly the next, and the density gate will (by design) keep the strategy inactive during those trending stretches. Always study behaviour across a range of symbols and periods before drawing conclusions.
How to Install on MetaTrader 5
- Download the .ex5 file from the link below.
- Copy it to your MT5
MQL5\Expertsfolder. - Restart MetaTrader 5 or refresh the Navigator panel.
- Drag the EA onto a chart matching the recommended symbol and timeframe.
- Configure the input parameters and enable Algo Trading.
What to Consider Before Using This EA
Strengths. The mode is a robust equilibrium anchor: because it counts visited levels rather than averaging them, it largely ignores spikes and outliers that distort a mean or VWAP. The density gate is a genuine attempt to solve the classic problem with fading strategies — they blow up in trends — by only trading when a dense acceptance cluster confirms a ranging regime. The ATR scaling means the same settings behave consistently across instruments with very different price scales, and the snap-back body condition avoids entering while price is still extending.
Limitations. No regime filter is perfect. A sufficiently strong or news-driven trend can still slip past the density gate at the moment it begins, and mean-reversion systems characteristically take many small, satisfying wins punctuated by occasional larger losses when a "range" resolves into a breakout. Because the take-profit is the modal price and the stop is a fixed ATR distance, the reward-to-risk on any single trade is not fixed — it depends on how far price has stretched. Fading also underperforms during sustained directional markets, low-liquidity sessions, and around scheduled high-impact news, when acceptance zones break down quickly.
The strategy is best understood as an educational study in statistical fair value and regime filtering — a framework for learning why and when mean reversion can work — rather than a finished, hands-off system.
Risk Management Tips
- Size positions conservatively. A widely taught guideline is to risk no more than 1–2% of account equity per trade. Because the stop distance here scales with ATR, your lot size should be adjusted per symbol so that the ATR-based stop still equals that small percentage of your account.
- Test on a demo account first. Run the EA on a demo or historical tester across multiple symbols and market conditions before ever considering live capital.
- Understand drawdown. Even a well-behaved mean-reversion approach will experience losing streaks. Know the maximum drawdown you are willing to tolerate and how it maps to your account size.
- Respect the regime gate. Do not "force" trades by loosening
MinClusterFractiontoo far — that filter is what keeps the strategy out of trends. Study how changing it alters both trade frequency and the type of market you end up trading. - Never over-leverage. Leverage magnifies losses as readily as gains. Trade with money you can afford to lose, and treat every parameter as something to validate, not to trust blindly.
Risk Warning
Trading foreign exchange, CFDs, and other leveraged financial instruments involves substantial risk of loss and is not suitable for all investors. The strategies and tools discussed on this page are provided for educational purposes only and do not constitute financial advice, investment recommendations, or solicitation to trade. Always consult a qualified financial adviser before making trading decisions. Past backtest performance is not indicative of future results.
Downloads
- Expert Advisor: ModalPriceReversion.ex5 (38 downloads)
- Source Code: ModalPriceReversion.mq5 (35 downloads)
- Documentation: ModalPriceReversion.pdf (43 downloads)