
Disclaimer: This article is for educational and informational purposes only. It does not constitute financial or investment advice. Trading forex and CFDs carries significant risk of loss. Past performance of any strategy — including backtests — does not guarantee future results. Never trade with money you cannot afford to lose.
What Is This Strategy?
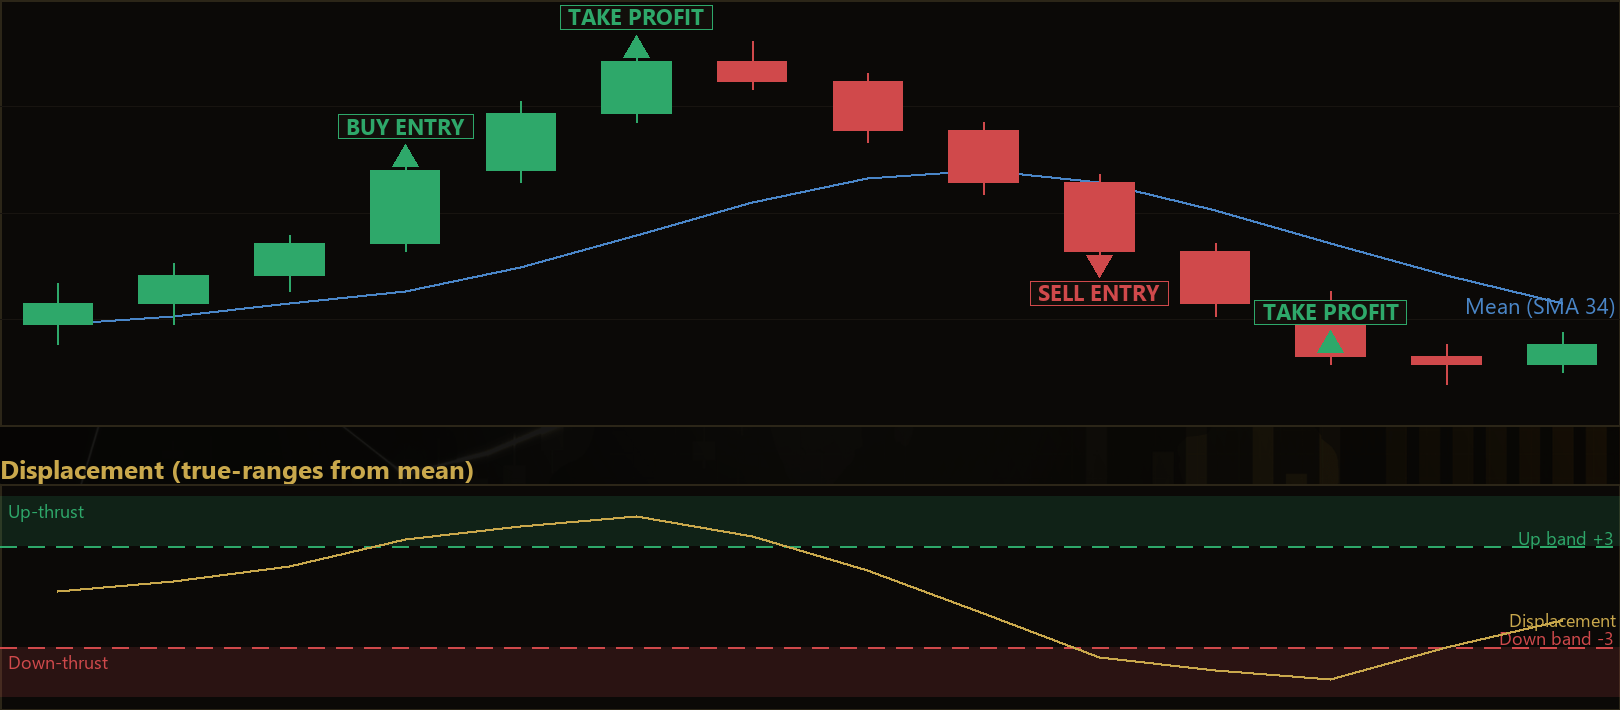
Mean Distance Trend Expansion is a trend-momentum breakout strategy built around a range-normalized displacement oscillator — a reading inspired by Mark Johnson's "Pretty Good Oscillator" that measures how far price has stretched away from its own moving-average baseline, expressed in units of volatility rather than raw price. In plain terms, the strategy is not interested in where price is trading, but in how far it has travelled from fair value once you account for the market's own normal swing size.
The central idea is captured in a single formula: displacement equals the distance between the current close and a Simple Moving Average (SMA — a rolling average of closing prices), divided by the Exponential Moving Average (EMA — a weighted average that reacts faster to recent data) of the True Range. True Range captures a candle's full high-to-low travel including gaps, so the oscillator effectively answers the question, "How many average candles' worth of range has price moved away from its mean?" Because the reading is scaled by the market's own volatility, it stays comparable across different symbols and market regimes, and it behaves differently from a simple z-score: a market can look far from its mean in price terms yet register only a modest, unremarkable stretch once volatility is factored in.
This strategy is designed for trending, momentum-driven market conditions where a genuine volatility-adjusted stretch away from the mean can signal the start of a directional expansion. As a learning tool, it suits intermediate traders who want to study how normalization by volatility changes the meaning of "distance from the mean," and how a slope-based trend filter can screen out countertrend spikes. It is best understood as a framework for analysis and study — not a shortcut to a particular outcome.
How It Works
The strategy evaluates one freshly closed bar at a time on the primary chart timeframe, recalculates its oscillator, and then checks a small set of conditions before acting.
- Building the oscillator: On each newly closed candle, the strategy computes the SMA of closing prices over the
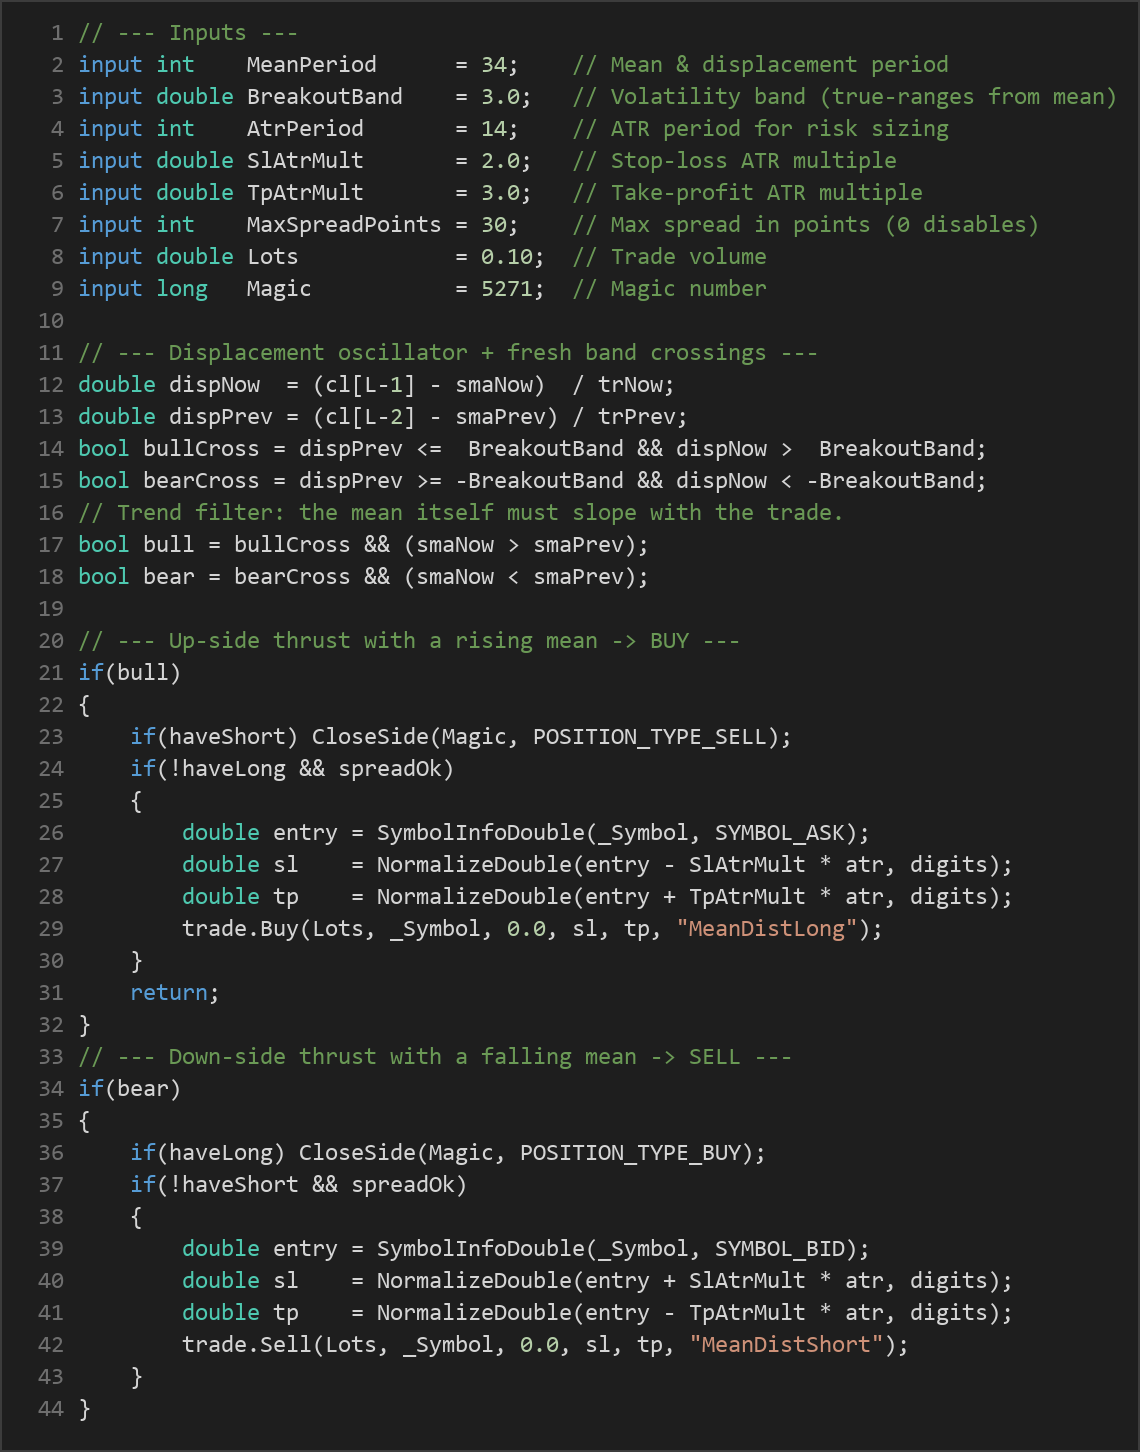
MeanPeriod, and the EMA of True Range over the same period. The displacement is the gap between the latest close and the SMA, divided by that smoothed True Range. - Long entry signal: The strategy signals a potential buy when the displacement makes a fresh upward crossing through the +
BreakoutBandlevel — meaning the prior bar's reading was at or below the band and the current bar's reading is above it. This "ignite once" logic is intentional: it fires on the moment the stretch becomes significant rather than chasing a move that is already extended. - Short entry signal: Symmetrically, the strategy signals a potential sell when the displacement makes a fresh downward crossing through the −
BreakoutBandlevel. - Trend filter: A single, additive filter must agree with the trade. For longs, the SMA itself must be rising (its current value above its previous value); for shorts, the SMA must be falling. This rejects countertrend volatility spikes — a sharp stretch above a mean that is still sloping downward — which historically cause raw "distance from mean" systems to bleed.
- Position reversal: The system is fully symmetric and reverses. If a fresh opposite crossing occurs while a position is open, the strategy closes the existing position and opens one in the new direction.
- Stop-loss logic: Risk is anchored to the Average True Range (ATR — a measure of typical candle volatility). The stop-loss is placed
SlAtrMultATR values away from entry — below entry for longs, above for shorts — so the protective distance automatically widens in volatile markets and tightens in calm ones. - Take-profit logic: The target is set
TpAtrMultATR values away from entry in the trade's direction, giving a volatility-scaled reward objective. With the defaults, the target distance is larger than the stop distance. - Spread filter: Before any new position opens, the strategy checks that the current spread is at or below
MaxSpreadPoints, helping keep simulated and live fills realistic. Setting this to zero disables the check.
Strategy Parameters
| Parameter | Default | Min | Max | Description |
|---|---|---|---|---|
| MeanPeriod | 34 | 10 | 100 | Lookback for the SMA baseline and the EMA of True Range that together form the displacement oscillator. Larger values create a slower, smoother mean. |
| BreakoutBand | 3.0 | 1.0 | 6.0 | The volatility band, in true-ranges from the mean, that displacement must cross to trigger a signal. Higher values demand a larger stretch before igniting. |
| AtrPeriod | 14 | 7 | 40 | Lookback period for the ATR used to size the stop-loss and take-profit distances. |
| SlAtrMult | 2.0 | 0.5 | 5.0 | Stop-loss distance as a multiple of ATR. Larger values give trades more room but increase risk per trade. |
| TpAtrMult | 3.0 | 0.5 | 8.0 | Take-profit distance as a multiple of ATR. Sets the reward objective relative to volatility. |
| MaxSpreadPoints | 30 | 0 | 200 | Maximum allowable spread (in points) for a new entry. Set to 0 to disable the spread filter. |
| Lots | 0.10 | 0.01 | 1.0 | Fixed trade volume in lots for each new position. |
Recommended Chart Settings
The Mean Distance Trend Expansion EA operates on the primary chart timeframe only, so the timeframe you attach it to is the timeframe it trades. As a volatility-normalized breakout approach, it is commonly studied on major forex pairs — such as EUR/USD or GBP/USD — where spreads are tight and volatility is well-behaved, using an intermediate timeframe such as H1 or H4 as a reasonable starting point for exploration. The default MeanPeriod of 34 and BreakoutBand of 3.0 are tuned for those conditions.
Because the oscillator is normalized by each market's own True Range, the strategy is designed to be broadly comparable across symbols. That said, results will vary considerably across different instruments, timeframes, and market conditions. Always test any configuration on your specific broker's data before drawing conclusions.
How to Install on MetaTrader 5
- Download the
MeanDistanceTrendExpansion.ex5file from the link below - Copy it to your MT5
MQL5\Expertsfolder - Restart MetaTrader 5 or refresh the Navigator panel
- Drag the EA onto a chart matching the recommended symbol and timeframe
- Configure the input parameters and enable Algo Trading
What to Consider Before Using This EA
Strengths of the approach. The defining feature here is volatility normalization. By dividing distance-from-mean by the EMA of True Range, the strategy produces a reading that is scale-invariant and comparable across symbols and regimes — a genuine improvement over raw "distance from mean" systems. The "fresh crossing" logic avoids chasing already-extended moves, and the mean-slope trend filter is a thoughtful, minimal addition that historically screens out the countertrend spikes that hurt naive stretch systems. ATR-based stops and targets adapt to changing volatility instead of using fixed pip distances.
Known limitations. Every breakout-momentum strategy faces the same core challenge: markets spend long stretches ranging rather than trending. During choppy, sideways conditions, displacement can cross the band and then immediately reverse, producing whipsaw entries that hit their stops. The trend filter reduces but does not eliminate this. The strategy also acts only on closed bars, so it never anticipates a move — it confirms one, which means giving up some of the initial thrust. Finally, a fixed Lots size does not scale risk to account equity, and the reversal logic can generate frequent turnover in indecisive markets.
Where it may underperform. Tight ranges, low-volatility drift, and news-driven spikes that briefly pierce the band before snapping back are the conditions most likely to challenge this approach. No single indicator or filter anticipates every regime, and this one is no exception.
Risk Management Tips
Sound risk management matters far more than any single parameter setting. Consider these general principles as part of your education:
- Risk a small, fixed fraction per trade. Many educational sources suggest risking no more than 1–2% of account equity on any single position. Because this EA uses a fixed lot size, you may need to adjust
Lotsso the ATR-based stop distance corresponds to that fraction of your account. - Understand drawdown. Even a well-constructed strategy will experience losing streaks. Study the historical drawdown of any configuration so you know what a normal losing sequence looks like before committing capital.
- Always start on a demo account. Test the EA on a demo or simulation account across varied market conditions before considering any live deployment. This lets you observe behavior without financial consequences.
- Mind your position sizing and leverage. Higher leverage magnifies both gains and losses. Keep total exposure conservative, especially when running multiple strategies at once.
- Review the spread filter. Ensure
MaxSpreadPointsreflects your broker's typical spreads so entries are not skipped or filled at unrealistic prices.
Treat this strategy as a structured way to learn about volatility-normalized breakouts and trend filtering — not as a substitute for disciplined, informed decision-making.
Risk Warning
Trading foreign exchange, CFDs, and other leveraged financial instruments involves substantial risk of loss and is not suitable for all investors. The strategies and tools discussed on this page are provided for educational purposes only and do not constitute financial advice, investment recommendations, or solicitation to trade. Always consult a qualified financial adviser before making trading decisions. Past backtest performance is not indicative of future results.
Downloads
- Expert Advisor: MeanDistanceTrendExpansion.ex5 (51 downloads)
- Source Code: MeanDistanceTrendExpansion.mq5 (47 downloads)
- Documentation: MeanDistanceTrendExpansion.pdf (58 downloads)