Disclaimer: This article is for educational and informational purposes only. It does not constitute financial or investment advice. Trading forex and CFDs carries significant risk of loss. Past performance of any strategy — including backtests — does not guarantee future results. Never trade with money you cannot afford to lose.
What Is This Strategy?
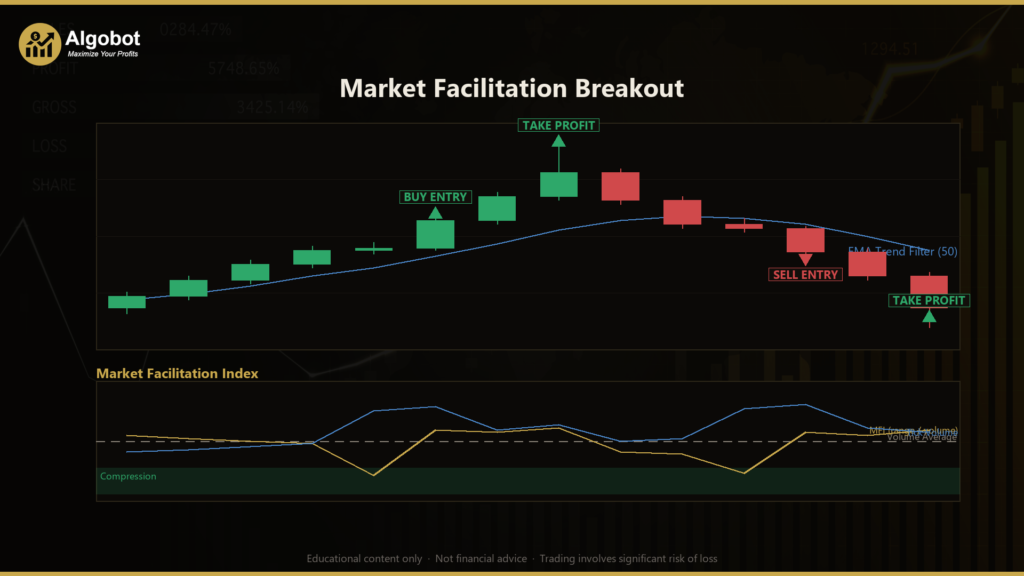
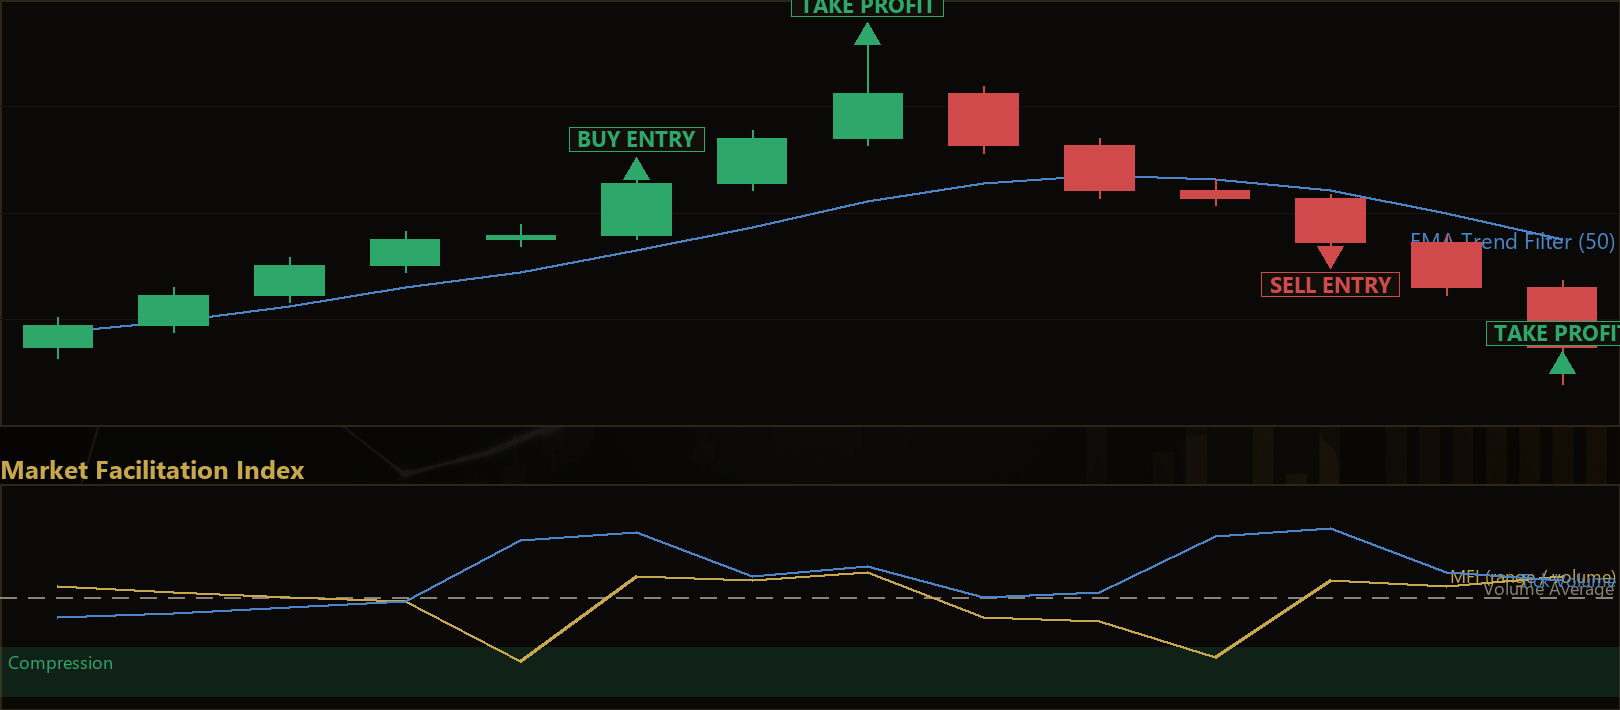
The Market Facilitation Breakout is a participation-compression breakout system built around Bill Williams' Market Facilitation Index (BW-MFI) — a classic indicator that measures how much price movement each unit of volume actually "buys." Rather than reading compression from shrinking Bollinger Bands or a contracting Average True Range (ATR), this strategy reads it from the relationship between range and volume: when a candle prints far more volume yet delivers less range per unit of that volume than the candle before it, participation has surged while price has barely moved. Bill Williams called this a "Squat" bar — a moment where large players absorb order flow and coil the market before it releases.
The strategy is designed for markets that alternate between quiet absorption and directional expansion. It waits for a Squat bar to appear, confirms that the broader drift agrees (using a sloping Exponential Moving Average, or EMA), and then arms a breakout of that coil bar's range. When a later candle closes beyond the level in the direction of the trend, the strategy signals an entry. In effect, it is trying to catch the ignition that historically can follow a period of hidden accumulation or distribution.
As a learning tool, this EA is well suited to traders who want to understand volume-based compression and how it differs from price-based volatility squeezes. It is not a "set and forget" money machine — it is a structured, rules-based framework for studying how volume, range, and trend alignment interact. Treat it as a study of market microstructure concepts rather than a shortcut to returns.
How It Works
The strategy operates on completed bars only (it evaluates the candle that just closed) and trades a single symbol and timeframe. Here is the logic broken down:
- Market Facilitation Index (MFI) calculation: For each bar,
MFI = (High − Low) / TickVolume. A low MFI means a lot of volume produced very little range — inefficient, absorbed movement. - Squat detection: The just-completed bar is compared to the one before it. A Squat is flagged when all three conditions hold: (1) MFI fell versus the prior bar, (2) tick volume rose versus the prior bar, and (3) tick volume also cleared its own recent average (over the
VolMaPeriodwindow). The third test ensures the strategy only arms on genuine participation spikes, not quiet noise. - Directional bias: A bias filter uses an EMA of closing prices and its slope. The strategy signals a long bias only when price closes above a rising EMA, and a short bias only when price closes below a falling EMA. This keeps every setup aligned with the prevailing drift and produces symmetric, mirror-image long and short rules.
- Arming the breakout: When a Squat appears and a clear directional bias exists, the strategy arms a breakout of the Squat bar's high (for longs) or low (for shorts). The arm stays live for a limited window defined by
ArmBars. - Entry trigger: While the setup is armed and the bias still agrees, a later bar that closes beyond the armed level (above the high for longs, below the low for shorts) signals a market entry.
- Discarding stale setups: If the arm window lapses without a breakout, or if the directional bias flips, the setup is discarded. No stale arms are allowed to fire.
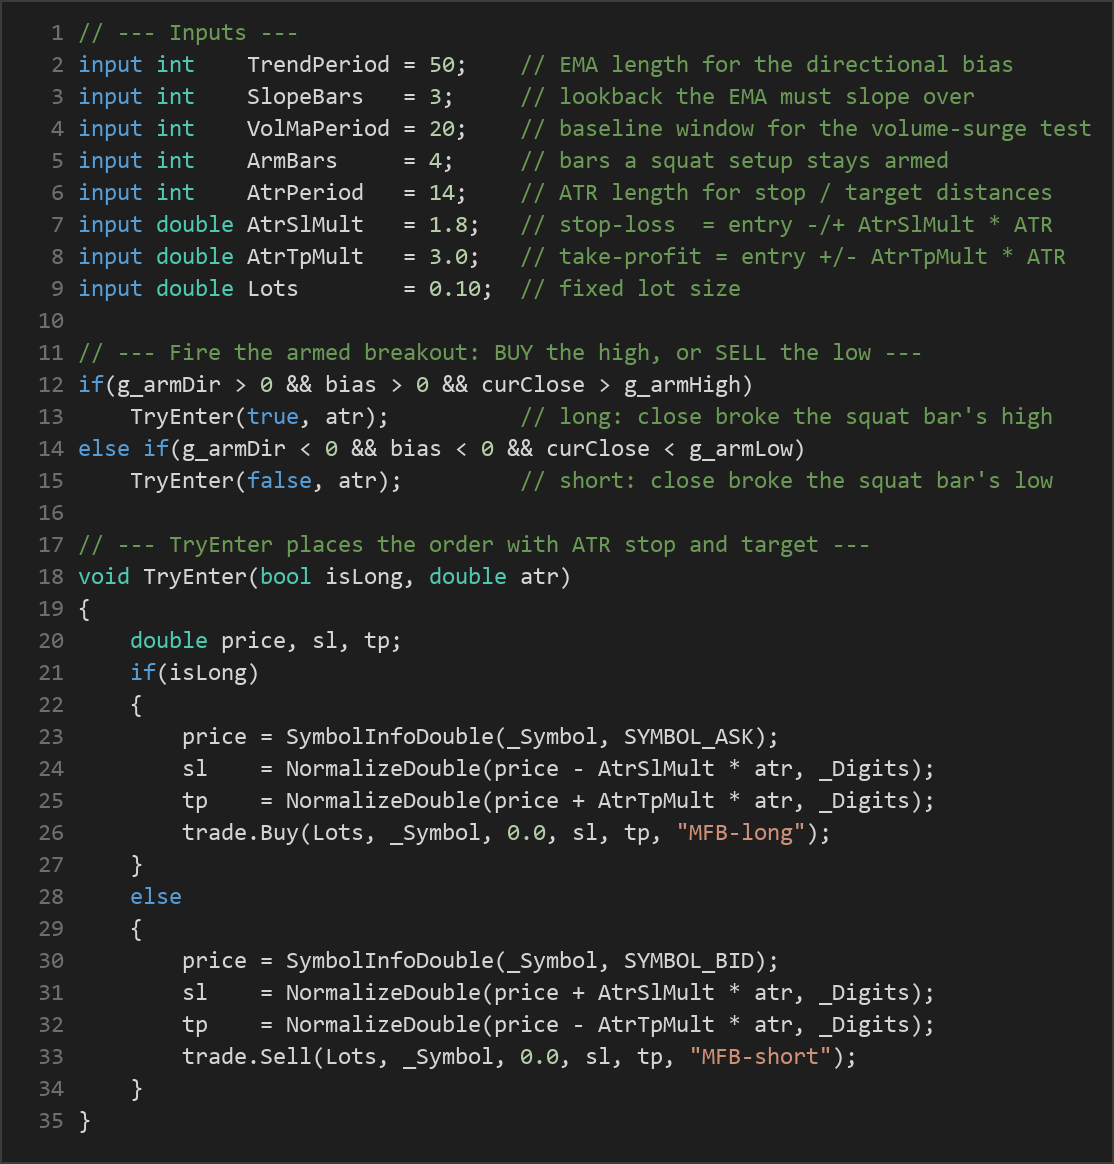
- Stop-loss logic: On entry, the stop is placed at
entry − AtrSlMult × ATRfor longs (and the mirror for shorts). This ties risk to current volatility rather than a fixed pip distance. - Take-profit logic: The target is placed at
entry + AtrTpMult × ATRfor longs (and the mirror for shorts). With the default multipliers, the target is set wider than the stop, reflecting a trend-continuation objective. - Position management: Only one position per magic number is held at a time. While a trade is open, new signals are ignored and the arm state resets, so each setup starts fresh once the position closes. Sizing is a fixed lot.
Strategy Parameters
| Parameter | Default | Min | Max | Description |
|---|---|---|---|---|
| TrendPeriod | 50 | 20 | 150 | EMA length used for the directional bias / trend filter. Larger values track a slower, longer-term drift. |
| SlopeBars | 3 | 1 | 12 | Lookback over which the trend EMA must be sloping in the trade direction to confirm the bias. |
| VolMaPeriod | 20 | 5 | 60 | Baseline window for the "volume must beat its own average" surge test that qualifies a Squat. |
| ArmBars | 4 | 1 | 12 | How many bars a Squat setup stays armed before it expires without a breakout. |
| AtrPeriod | 14 | 7 | 30 | ATR length used to size the stop-loss and take-profit distances. |
| AtrSlMult | 1.8 | 1.0 | 4.0 | Stop-loss distance as a multiple of ATR (entry −/+ AtrSlMult × ATR). |
| AtrTpMult | 3.0 | 1.0 | 6.0 | Take-profit distance as a multiple of ATR (entry +/− AtrTpMult × ATR). |
| Lots | 0.10 | 0.01 | 1.0 | Fixed lot size used for each position. |
Recommended Chart Settings
The strategy is single-timeframe by design: every calculation uses whatever timeframe the chart is set to at run time, so you can study it across different horizons. Because it relies on tick volume, it is most naturally applied to liquid forex majors (such as EUR/USD or GBP/USD) where tick volume is a reasonable proxy for participation. Intraday timeframes like M15 or H1 are a sensible starting point for observing Squat behavior, as they generate enough bars to study the pattern without excessive noise.
Keep in mind that the same parameters can behave very differently across symbols, timeframes, and market conditions. Volume characteristics vary between instruments and brokers, so what looks clean on one chart may look erratic on another. Always test on the specific symbol and timeframe you intend to study before drawing conclusions.
How to Install on MetaTrader 5
- Download the .ex5 file from the link below
- Copy it to your MT5
MQL5\Expertsfolder - Restart MetaTrader 5 or refresh the Navigator panel
- Drag the EA onto a chart matching the recommended symbol and timeframe
- Configure the input parameters and enable Algo Trading
What to Consider Before Using This EA
Strengths of the approach. The Market Facilitation Breakout looks at a dimension many breakout systems ignore: the efficiency of volume, not just its size or price range. By requiring a genuine volume surge alongside a drop in range-per-volume, it tries to distinguish true absorption from ordinary quiet bars. The sloping-EMA bias filter keeps entries aligned with the prevailing drift, and the ATR-based stops and targets adapt to current volatility rather than using rigid distances. The parameter set is deliberately small and broadly ranged, which historically helps reduce the temptation to over-optimize.
Known limitations. The BW-MFI depends on tick volume, which is a proxy for real traded volume in decentralized forex — it counts price updates, not contracts. This means the signal quality is only as reliable as the broker's tick feed, and it can differ meaningfully between brokers. The "Squat" concept is also somewhat interpretive; not every absorption bar leads to a clean release, and false arms that expire without triggering are a normal part of the logic.
Where it may underperform. Like most breakout systems, this approach may struggle in choppy, range-bound conditions where price repeatedly pokes beyond a coil bar and reverses, producing whipsaws. Very low-volatility sessions can generate weak Squats that lack follow-through, while extremely news-driven spikes can trigger entries just before a sharp reversal. Because only one position is held at a time, the strategy may also sit out extended moves after taking an early exit. None of these traits are flaws to be "fixed" — they are characteristics to understand so you can judge when the market environment suits the logic and when it does not.
Risk Management Tips
Sound risk management matters far more than any single indicator. As you study this strategy, keep these general principles in mind:
- Risk a small, fixed fraction per trade. Many educators suggest risking no more than 1–2% of account equity on any single position. The fixed
Lotsinput here does not scale to your balance, so calculate what that lot size actually risks given the ATR-based stop, and adjust accordingly. - Understand your drawdown tolerance. Even a well-designed strategy will have losing streaks. Know in advance how much peak-to-trough decline you are willing to sit through, and what you will do if it is exceeded.
- Start on a demo account. Run the EA on a demo or paper account first to observe how Squats form, how often arms expire, and how the stops and targets behave on your specific symbol and broker feed.
- Mind position sizing and correlation. Avoid stacking multiple correlated instruments that could all move against you at once, and never size a position so large that a normal losing streak threatens your account.
- Review, don't just deploy. Treat any results as data for learning, not as a promise. Markets change, and a configuration that behaved one way in the past may behave differently in the future.
Risk Warning
Trading foreign exchange, CFDs, and other leveraged financial instruments involves substantial risk of loss and is not suitable for all investors. The strategies and tools discussed on this page are provided for educational purposes only and do not constitute financial advice, investment recommendations, or solicitation to trade. Always consult a qualified financial adviser before making trading decisions. Past backtest performance is not indicative of future results.
Downloads
- Expert Advisor: MarketFacilitationBreakout.ex5 (31 downloads)
- Source Code: MarketFacilitationBreakout.mq5 (29 downloads)
- Documentation: MarketFacilitationBreakout.pdf (36 downloads)