Disclaimer: This article is for educational and informational purposes only. It does not constitute financial or investment advice. Trading forex and CFDs carries significant risk of loss. Past performance of any strategy — including backtests — does not guarantee future results. Never trade with money you cannot afford to lose.
What Is This Strategy?
The Macd Histogram Trend Rider is a momentum-trend continuation strategy built around the MACD histogram (Moving Average Convergence Divergence — a momentum oscillator derived from the difference between two exponential moving averages) combined with a long-period EMA trend filter (Exponential Moving Average — a moving average that weights recent prices more heavily). Its trading style is trend-following with a pullback-resumption bias: it waits for momentum to flip back in the direction of the dominant trend and treats that flip as a signal to re-join the move.
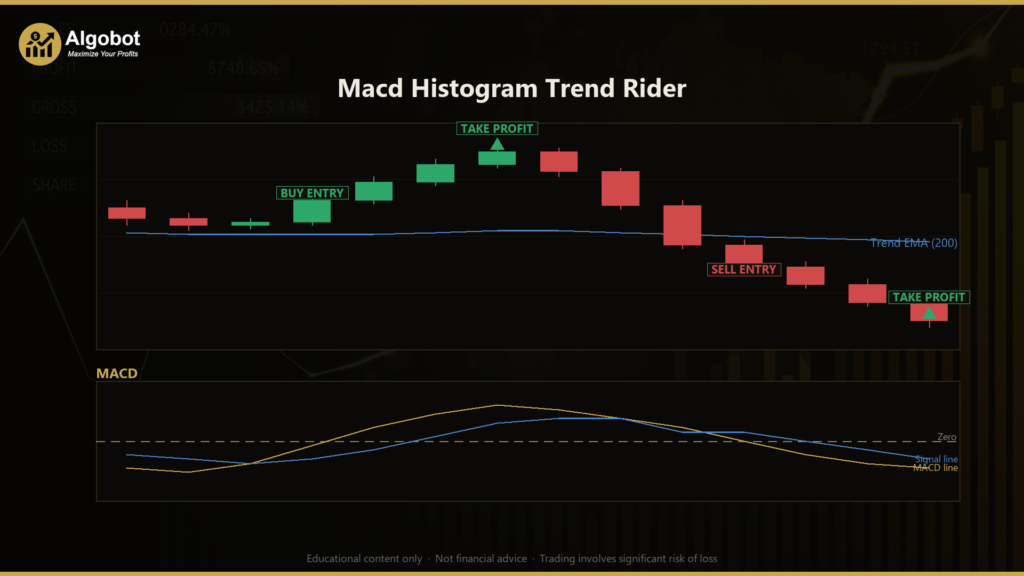
The core idea is simple. The MACD histogram is the distance between the MACD line and its signal line. When that histogram flips from negative to positive, momentum has just turned upward; when it flips from positive to negative, momentum has just turned downward. On its own, a raw MACD histogram cross is notoriously noisy and generates many false signals in sideways markets. The Macd Histogram Trend Rider addresses this by gating every signal with a 200-period trend EMA, so that only crosses aligned with the prevailing trend are considered.
As a learning tool, this strategy is well suited to traders who want to study how a momentum trigger and a trend filter can be combined to reduce whipsaws. It is a clear, readable example of a "confluence" approach — two independent conditions that must agree before any action is taken. It is not a shortcut to results, and it is best explored on a demo account where you can observe how it behaves across trending and ranging conditions without financial pressure.
How It Works
The strategy evaluates only completed bars (it reads the last closed candle rather than the still-forming one) to avoid repainting — that is, signals that appear and then disappear as a live candle moves. On each newly closed bar it recalculates its indicators and checks a strict sequence of conditions.
Entry conditions:
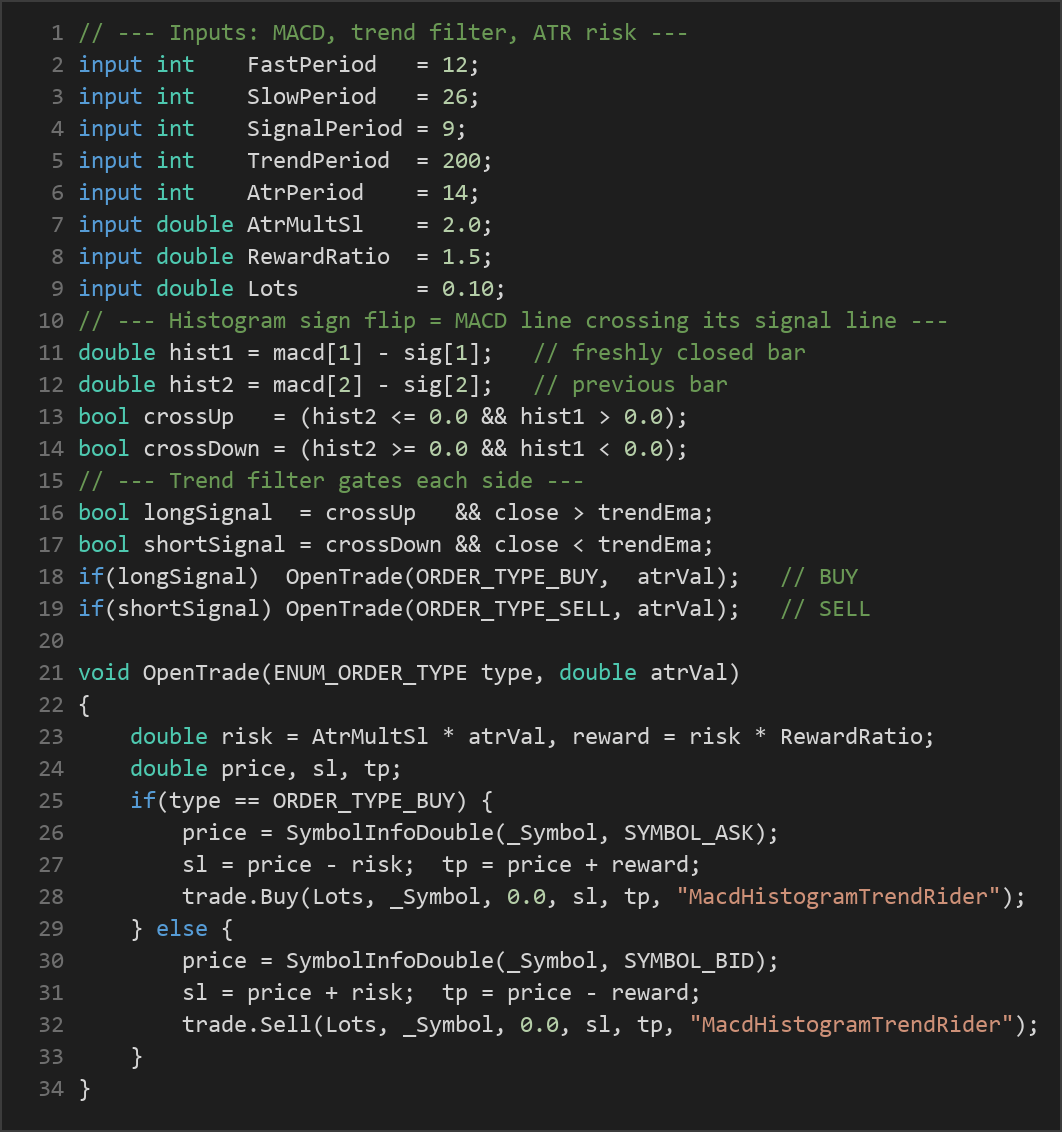
- The strategy computes the MACD line as the fast EMA minus the slow EMA, then builds a signal line as an EMA of that MACD line. The histogram is the MACD line minus the signal line.
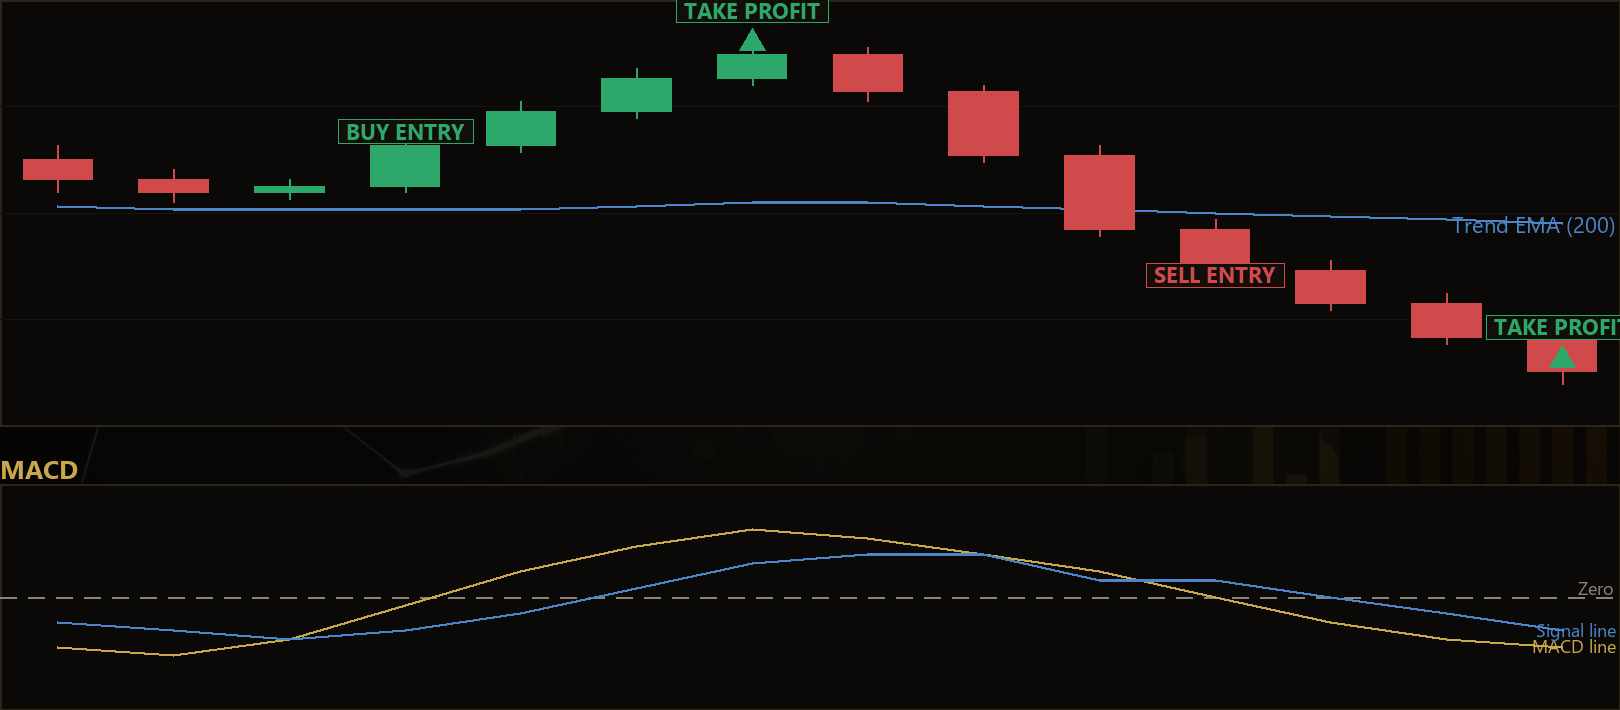
- A long signal is generated when the histogram crosses from at-or-below zero to above zero (momentum turning up) and the closing price is trading above the trend EMA (confirming an uptrend).
- A short signal is generated when the histogram crosses from at-or-above zero to below zero (momentum turning down) and the closing price is trading below the trend EMA (confirming a downtrend).
- Counter-trend crosses — an up-cross while price is below the trend EMA, or a down-cross while price is above it — are ignored. This trend filter is the mechanism that discards the crosses which historically produce most MACD false signals.
Position and reversal logic:
- The strategy trades one position at a time per Magic number (the identifier that tags the strategy's own trades).
- If a valid long signal appears while already long, nothing happens. If it appears while short, the strategy closes the short and opens a long — a reversal.
- The same logic applies in reverse for short signals.
Stop-loss and take-profit logic:
- Risk is measured using the ATR (Average True Range — a volatility gauge that reflects how much price typically moves per bar).
- The stop-loss distance is set to
AtrMultSl × ATR. With the default multiplier of 2.0, the stop sits two ATR values away from entry, so the stop automatically widens in volatile conditions and tightens in calm ones. - The take-profit distance is the stop distance multiplied by the
RewardRatio. With the default 1.5, the target is 1.5 times the risk distance, defining the reward-to-risk profile of each trade. - For a buy, the stop is placed below entry and the target above; for a sell, the stop is above and the target below. If ATR is zero or unavailable, the strategy takes no trade.
Strategy Parameters
| Parameter | Default | Min | Max | Description |
|---|---|---|---|---|
| FastPeriod | 12 | 5 | 20 | Period of the fast EMA in the MACD calculation. Lower values react faster to price. |
| SlowPeriod | 26 | 20 | 60 | Period of the slow EMA in the MACD calculation. Must be greater than the fast period. |
| SignalPeriod | 9 | 5 | 15 | Period of the EMA applied to the MACD line to produce the signal line. |
| TrendPeriod | 200 | 50 | 300 | Period of the trend-filter EMA. Price above it defines an uptrend; below it, a downtrend. |
| AtrPeriod | 14 | 7 | 30 | Number of bars used to calculate the ATR volatility measure for risk sizing. |
| AtrMultSl | 2.0 | 1.0 | 4.0 | Stop-loss distance as a multiple of ATR. Higher values give wider stops. |
| RewardRatio | 1.5 | 0.5 | 3.0 | Take-profit distance as a multiple of the stop distance (reward-to-risk ratio). |
| Lots | 0.10 | 0.01 | 1.0 | Trade volume in lots. Should be sized appropriately for your account. |
Recommended Chart Settings
The Macd Histogram Trend Rider is symbol- and timeframe-agnostic: it runs on whatever chart it is attached to, using that chart's timeframe for all bar calculations. Because it relies on a 200-period trend EMA, it is most naturally suited to higher intraday timeframes — such as the H1 (1-hour) or H4 (4-hour) charts — where trends tend to be more persistent and the trend filter has more meaning. Liquid instruments with clear directional character, such as major forex pairs, are a reasonable starting point for study.
Whatever you choose, remember that indicator-based strategies behave very differently across market regimes. A setting that appears well-behaved on one symbol or timeframe may perform poorly on another. Results will vary across different market conditions, and no single chart configuration is universally optimal.
How to Install on MetaTrader 5
- Download the
MacdHistogramTrendRider.ex5file from the link below. - Copy it to your MT5
MQL5\Expertsfolder. - Restart MetaTrader 5 or refresh the Navigator panel.
- Drag the EA onto a chart matching the recommended symbol and timeframe.
- Configure the input parameters and enable Algo Trading.
What to Consider Before Using This EA
Strengths. The design is disciplined and easy to reason about. The trend filter is the strategy's defining feature: by refusing to take momentum crosses that fight the dominant trend, it removes a large share of the false signals that plague standalone MACD systems. Its ATR-based risk model is another strength — stops and targets adapt to current volatility rather than using fixed pip distances, which historically helps a strategy behave more consistently across calm and turbulent periods. The one-position-at-a-time rule with clean reversals keeps its behavior transparent and easy to audit.
Known limitations. The MACD histogram is a lagging, moving-average-based tool, so signals arrive after momentum has already begun to shift. In choppy, directionless markets the trend EMA and price can hover close together, producing marginal signals that may indicate a move which fails to develop. A fixed reward-to-risk target means some winning momentum runs are cut short at the take-profit, while the strategy has no trailing mechanism to capture extended trends. Reversal logic can also lead to being flipped back and forth during volatile consolidations.
When it may underperform. Range-bound and low-volatility environments are the most challenging, because momentum crosses cluster near the trend line and the filter offers less protection. Sharp news-driven spikes can trigger stops before a trend resumes. As always, historical behavior is a study aid, not a forecast.
Risk Management Tips
Sound risk management matters more than any single indicator setting. Consider the following general principles as part of your education:
- Position sizing: Choose a lot size proportional to your account, not a fixed default. The
Lotsparameter should reflect the risk you are willing to take on a single trade. - The 1–2% rule: Many educational sources suggest risking no more than 1–2% of account equity on any one trade, so that a string of losses does not materially threaten your capital.
- Use a demo account first: Test the strategy in a risk-free simulated environment until you understand its behavior across different market conditions before considering any live use.
- Understand drawdown: Every strategy experiences losing streaks and equity declines. Study the depth and duration of drawdown you could tolerate emotionally and financially before committing capital.
- Never over-leverage: Leverage amplifies both gains and losses. Keep it conservative while learning.
Risk Warning
Trading foreign exchange, CFDs, and other leveraged financial instruments involves substantial risk of loss and is not suitable for all investors. The strategies and tools discussed on this page are provided for educational purposes only and do not constitute financial advice, investment recommendations, or solicitation to trade. Always consult a qualified financial adviser before making trading decisions. Past backtest performance is not indicative of future results.
Downloads
- Expert Advisor: MacdHistogramTrendRider.ex5 (63 downloads)
- Source Code: MacdHistogramTrendRider.mq5 (64 downloads)
- Documentation: MacdHistogramTrendRider.pdf (58 downloads)