Disclaimer: This article is for educational and informational purposes only. It does not constitute financial or investment advice. Trading forex and CFDs carries significant risk of loss. Past performance of any strategy — including backtests — does not guarantee future results. Never trade with money you cannot afford to lose.
What Is This Strategy?
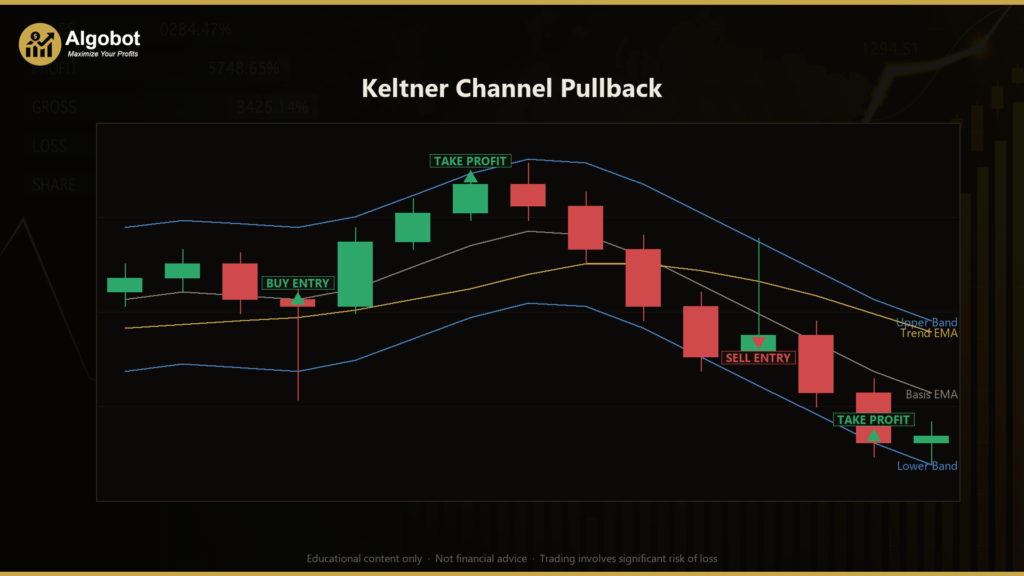
The Keltner Channel Pullback is a trend-aligned mean-reversion strategy built around a Keltner-style volatility channel — a set of bands plotted a fixed number of Average True Range (ATR) units above and below an Exponential Moving Average (EMA). ATR is a common measure of how far price typically travels in a bar, so the channel automatically widens in volatile conditions and narrows in quiet ones. Rather than chasing breakouts through those bands, this strategy waits for price to briefly overshoot the far band and then snap back inside the channel, treating that rejection as a discounted entry in the direction of the prevailing trend.
The approach is designed for markets that are trending but still breathing — moving up or down with regular pullbacks against the primary direction. A separate, longer EMA acts purely as a directional gate: the strategy only looks for long entries when the trend filter is sloping upward and price is above it, and only looks for shorts when the mirror conditions hold. This alignment is the core idea. Plain band-fade systems that buy every dip and sell every spike tend to generate many false signals; by requiring every fade to agree with the trend slope, the Keltner Channel Pullback filters out a large share of counter-trend traps.
As a learning tool, this strategy is well suited to traders who want to understand how volatility bands, moving-average trend filters, and structured risk management can be combined into a single rules-based system. It is not a shortcut or an opportunity — it is a transparent, single-timeframe example of disciplined mean-reversion logic that you can study, backtest, and dissect on a demo account.
How It Works
The strategy evaluates its rules once per completed bar on a single timeframe. On each new bar it recalculates the channel, checks the trend gate, and either opens a new position or manages an existing one. It never stacks multiple positions on the same symbol.
Indicator setup on every bar:
- Basis — an EMA of closing prices over
BasisEmaPeriod, forming the centre line of the channel. - Bands — the basis plus and minus
BandMultiplier× ATR(AtrPeriod), giving a dynamic upper and lower band. - Trend filter — a longer EMA over
TrendEmaPeriod, along with its slope (its value now versus one bar ago) to confirm the trend is actively moving, not flat.
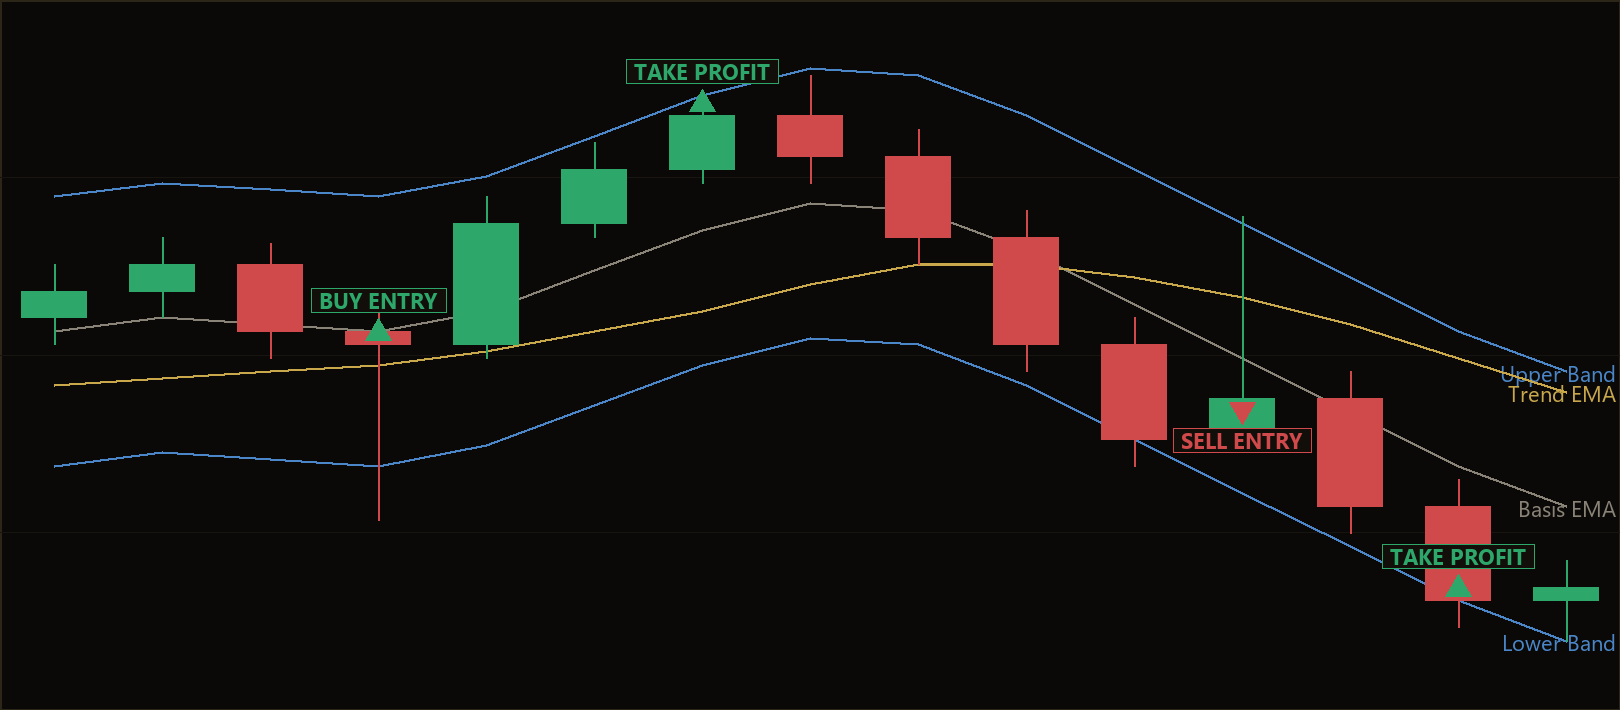
Long entry — the strategy signals a long when all of the following are true:
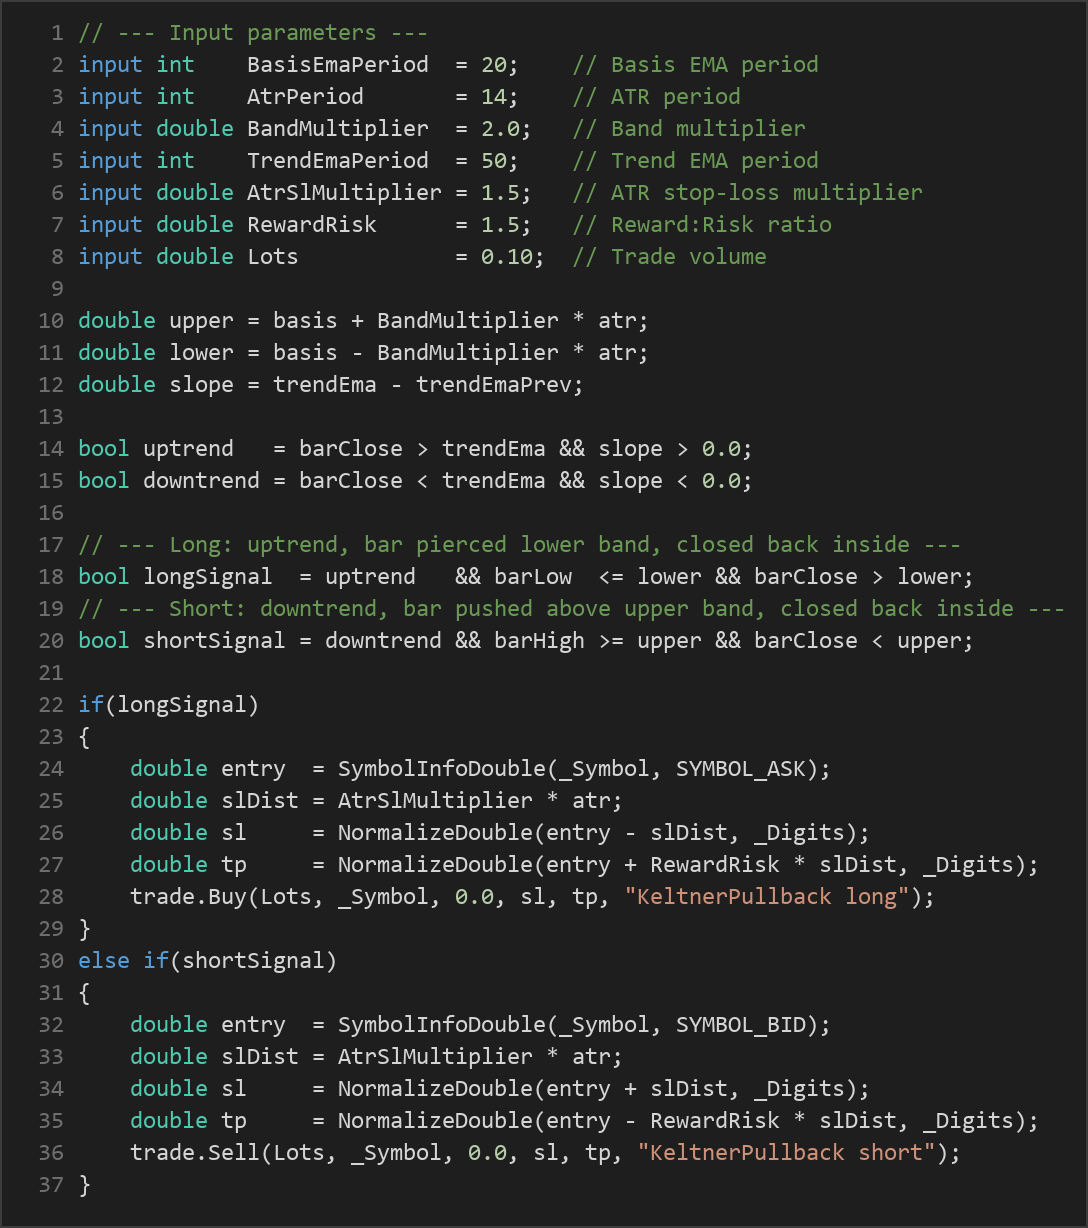
- The trend is up: the bar closes above the trend EMA and the trend EMA slope is positive.
- The bar's low pierced the lower band (an overshoot to the downside).
- The bar closed back above the lower band (a rejection back inside the channel).
Short entry — the strategy signals a short when the mirror conditions hold:
- The trend is down: the bar closes below the trend EMA and the trend EMA slope is negative.
- The bar's high pierced the upper band.
- The bar closed back below the upper band.
Stop-loss logic:
- The stop distance is
AtrSlMultiplier× ATR, measured from the entry price. Because it is ATR-based, the stop automatically scales with current volatility — wider when the market is choppy, tighter when it is calm. - For a long, the stop sits below entry; for a short, above entry.
Take-profit logic:
- The target is placed at
RewardRisk× the stop distance. With the default reward:risk of 1.5, the take-profit is 1.5 times as far from entry as the stop — meaning a winning trade may indicate a return of roughly 1.5R relative to the 1R risked.
Breakeven management:
- Once price travels 1R (one full stop distance) in favour of an open position, the strategy moves the stop to the entry price. This is intended to remove the initial risk from a trade that has already run in its favour. The position is otherwise left to reach its stop or target.
Strategy Parameters
| Parameter | Default | Min | Max | Description |
|---|---|---|---|---|
| BasisEmaPeriod | 20 | 8 | 60 | Period of the EMA that forms the channel's centre line (basis). |
| AtrPeriod | 14 | 7 | 30 | Lookback period for the ATR used to size the channel width and the stop. |
| BandMultiplier | 2.0 | 1.0 | 3.5 | Number of ATR units the upper and lower bands sit from the basis. |
| TrendEmaPeriod | 50 | 20 | 150 | Period of the longer EMA used as the directional trend gate. |
| AtrSlMultiplier | 1.5 | 0.8 | 3.0 | Multiplier applied to ATR to set the stop-loss distance from entry. |
| RewardRisk | 1.5 | 0.8 | 3.0 | Reward-to-risk ratio; sets the take-profit distance as a multiple of the stop. |
| Lots | 0.10 | 0.01 | 1.0 | Fixed trade volume in lots for each position. |
Recommended Chart Settings
The Keltner Channel Pullback operates on a single timeframe — every calculation reads the chart's primary period. It was designed to be attached to one chart at a time and evaluated on completed bars. A common starting point for studying trend-with-pullback behaviour is a liquid major forex pair such as EUR/USD on the H1 (1-hour) timeframe, which tends to produce clean trend legs and regular pullbacks without excessive noise.
That said, the default parameters are just a baseline. The ideal symbol, timeframe, and parameter set will differ from one market to another, and results will vary considerably across different market conditions. Treat any recommended setting as a research starting point to be validated through your own backtesting, not as a fixed prescription.
How to Install on MetaTrader 5
- Download the .ex5 file from the link below
- Copy it to your MT5
MQL5\Expertsfolder - Restart MetaTrader 5 or refresh the Navigator panel
- Drag the EA onto a chart matching the recommended symbol and timeframe
- Configure the input parameters and enable Algo Trading
What to Consider Before Using This EA
Strengths of the approach. The strategy's main advantage is discipline. It combines three ideas that traders often apply loosely — a volatility channel, a trend filter, and a fixed reward:risk framework — into one consistent, rules-based system. Because the stop and channel are both ATR-based, the strategy adapts to changing volatility instead of using fixed pip distances. The trend-slope gate is a genuine improvement over naive band-fade systems: historically, aligning mean-reversion entries with the higher-level trend tends to filter out many of the counter-trend signals that hurt fade strategies. The automatic breakeven move is a sensible risk feature that can reduce exposure on trades that have already moved in your favour.
Known limitations. Mean-reversion inside a channel works best when trends are orderly. In strong, one-directional runs, price can ride a band without ever "rejecting" back inside, and the strategy will simply stand aside — missing the move. Conversely, in choppy or ranging conditions the trend gate may flicker between up and down, producing whipsaw entries that are stopped out. Because the system trades only one position at a time and never stacks, it can also sit idle for long stretches waiting for a clean setup. And like all fixed reward:risk systems, a run of losses is entirely possible when the market's character does not match the strategy's assumptions.
Where it may underperform. Expect weaker behaviour during low-volatility drift, news-driven spikes that gap through the stop, and abrupt regime changes where a former trend reverses. No single-timeframe rule set can distinguish a healthy pullback from the start of a full reversal, so some losing trades are unavoidable. The strategy is best understood as a structured framework for studying trend-aligned mean reversion — not a finished, hands-off solution.
Risk Management Tips
Sound risk management matters far more than any single entry rule. As you study this strategy, keep these general principles in mind:
- Risk a small, fixed fraction per trade. Many educational sources suggest risking no more than 1–2% of account equity on any single position. Size your
Lotsso that the ATR-based stop distance corresponds to that fraction — not the other way around. - Understand drawdown. Even a well-designed strategy will experience losing streaks. Before trading, look at the worst historical drawdown in your backtests and ask whether you could tolerate it emotionally and financially.
- Always start on a demo account. Run the EA on a demo or simulated environment first to confirm it behaves as you expect on your broker's data, spreads, and execution before considering any live capital.
- Account for spread and slippage. Live fills differ from backtests. Wider spreads and slippage can erode the edge of a fixed reward:risk system, especially on shorter timeframes.
- Never over-leverage. Leverage magnifies both gains and losses. Keep position sizes conservative relative to your account balance.
- Trade only capital you can afford to lose. Treat automated trading as a field of study with real financial risk, not as a source of income.
Risk Warning
Trading foreign exchange, CFDs, and other leveraged financial instruments involves substantial risk of loss and is not suitable for all investors. The strategies and tools discussed on this page are provided for educational purposes only and do not constitute financial advice, investment recommendations, or solicitation to trade. Always consult a qualified financial adviser before making trading decisions. Past backtest performance is not indicative of future results.
Downloads
- Expert Advisor: KeltnerChannelPullback.ex5 (52 downloads)
- Source Code: KeltnerChannelPullback.mq5 (47 downloads)
- Documentation: KeltnerChannelPullback.pdf (51 downloads)