Disclaimer: This article is for educational and informational purposes only. It does not constitute financial or investment advice. Trading forex and CFDs carries significant risk of loss. Past performance of any strategy — including backtests — does not guarantee future results. Never trade with money you cannot afford to lose.
What Is This Strategy?
Interval Overlap Escape is an original, first-principles breakout strategy that uses a custom interval overlap coefficient — a Jaccard ratio measured on price — instead of any traditional indicator, chart pattern, or support/resistance level. It is a single-timeframe, price-action approach designed to detect the moment a market leaves the price region where it has recently been trading. The strategy does not rely on moving averages, RSI, MACD, or any published methodology; every decision is derived directly from the raw high, low, and close of each bar.
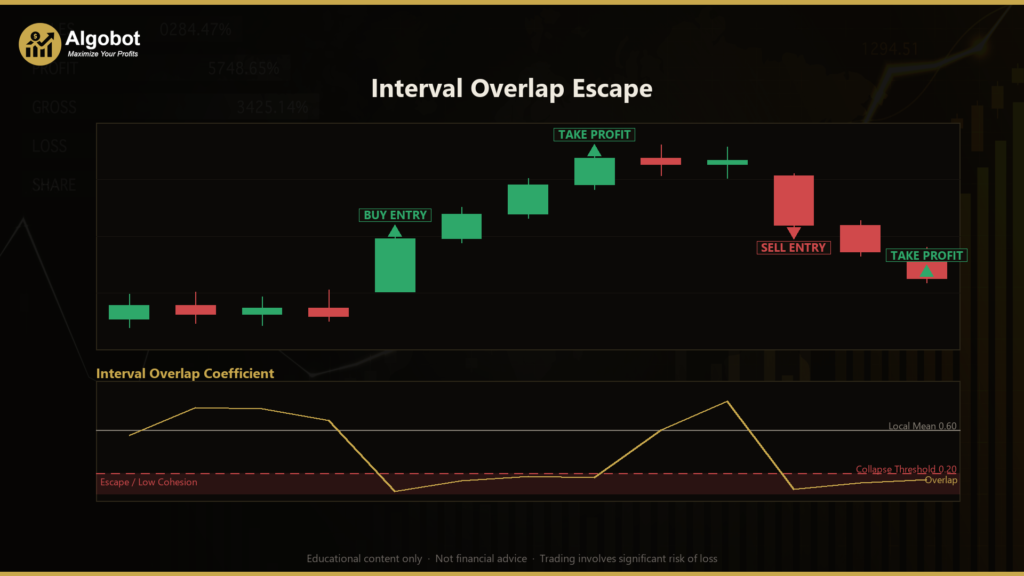
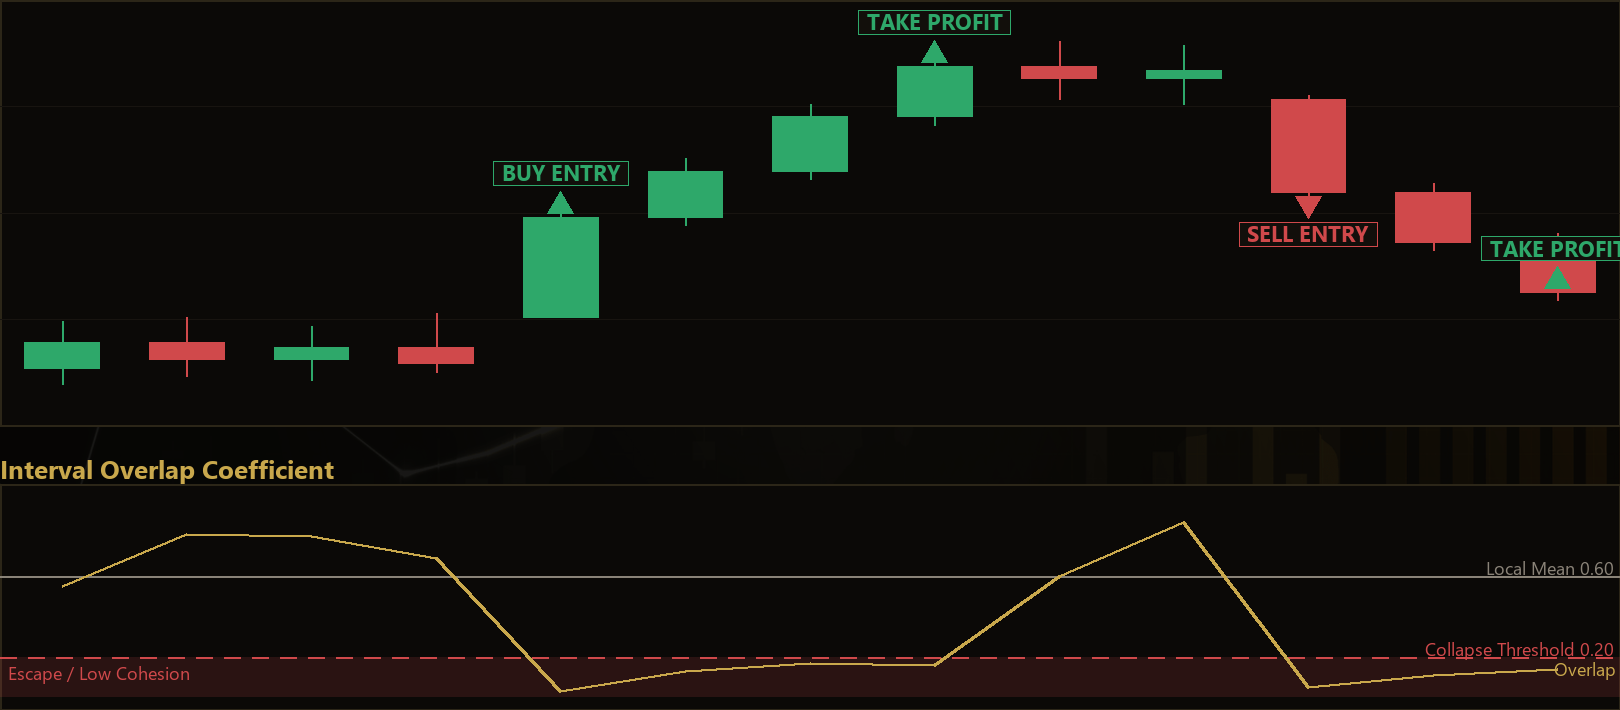
The core idea treats each bar not as a candle but as a price interval — the full band of prices between the bar's low and high, representing where trade actually occurred during that period. The strategy then measures how much of that price space two adjacent bars share. When two consecutive bars overlap heavily, buyers and sellers broadly agree on a value region (equilibrium). When overlap collapses, the current bar is transacting at prices the previous bar had rejected, which the strategy interprets as order flow relocating price to a new area — an "escape" from the recent value region.
As a learning tool, Interval Overlap Escape is well suited to traders who want to understand statistical, self-adapting breakout logic rather than fixed-threshold rules. Because it recalculates its own baseline every bar, it is a useful case study in how a strategy can adapt to changing market conditions without hard-coded price or volatility numbers. It is best viewed as a framework for studying interval geometry and anomaly detection — not as a shortcut to a particular outcome.
How It Works
The strategy acts once per completed bar. On each new bar it recomputes its statistical baseline from the market's own recent history, then checks whether the most recently closed bar represents an anomalous loss of cohesion. Here is the logic in plain English:
- Measure overlap: For the just-closed bar and the bar before it, the strategy computes the overlap coefficient
o = shared price span ÷ total price span. A value near 1 means the two bars covered almost the same prices; a value near 0 means they barely touched. - Build a local regime: It calculates the average overlap (mean, "mu") and the dispersion (standard deviation, "sigma") over the previous
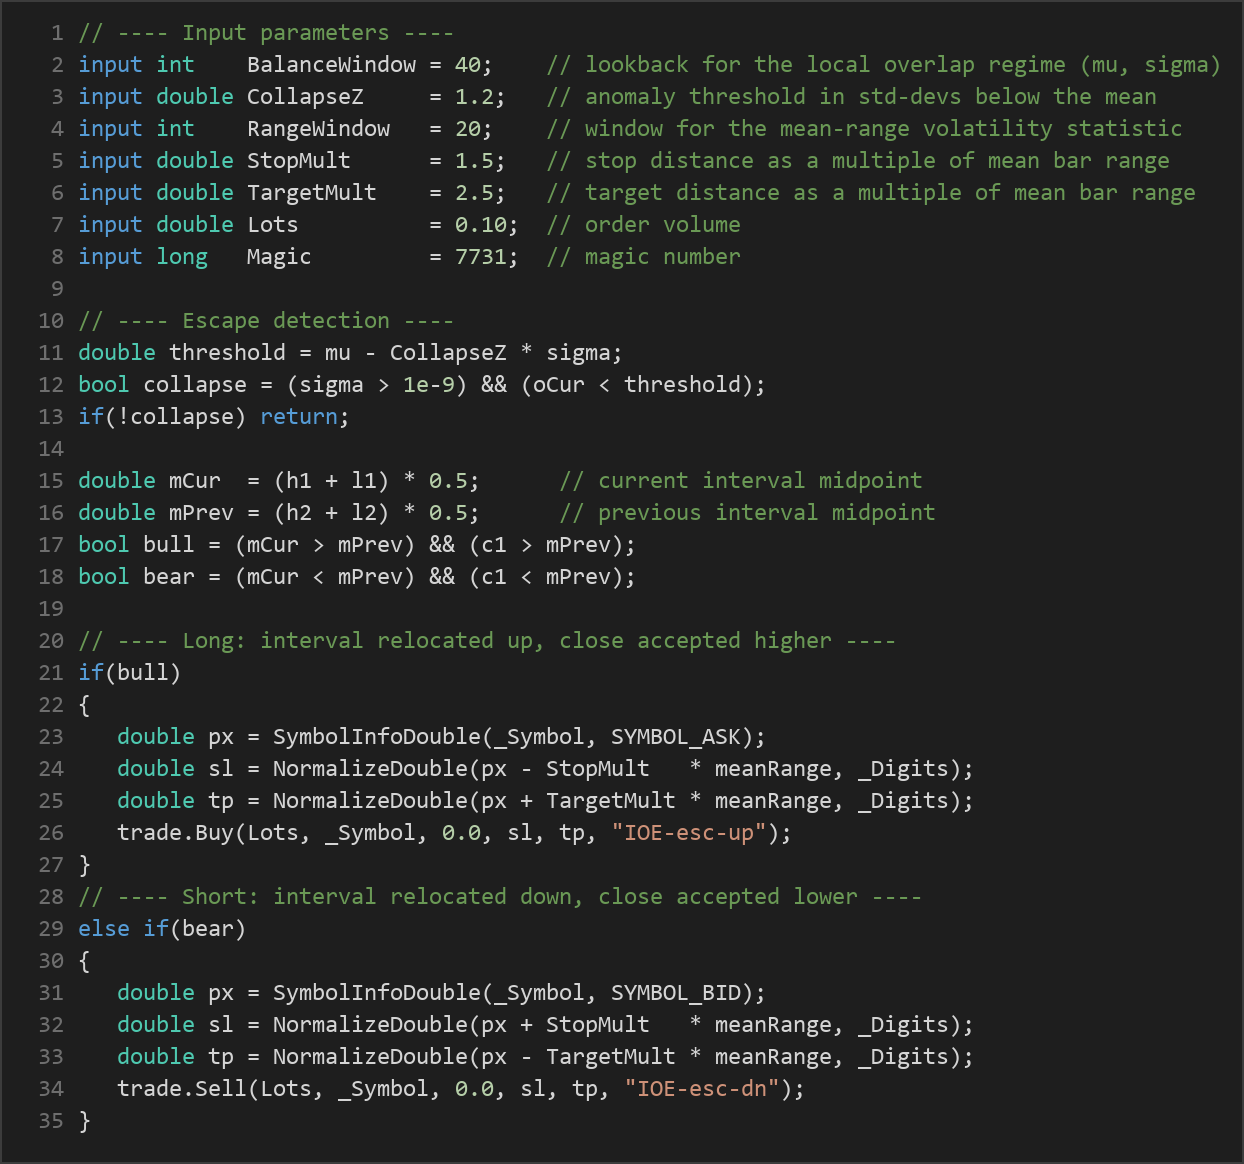
BalanceWindowbars — deliberately excluding the candidate bar so the anomaly test stays honest. This mean and dispersion define what "normal" cohesion currently looks like for this instrument and timeframe. - Detect an escape: The strategy signals a potential escape when the current overlap falls below the threshold
mu − CollapseZ × sigma. In other words, the latest bar's overlap must be statistically far below the recent norm — a measurable anomaly rather than routine fluctuation. - Confirm direction: Direction is read from the interval midpoint (the average of a bar's high and low). For a long, the current midpoint must be higher than the previous midpoint and the current close must finish above the previous midpoint (relocated and accepted higher). For a short, the mirror condition applies (relocated and accepted lower). If neither is cleanly true, no trade is taken.
- Enter with risk-scaled orders: When a valid signal appears, the strategy sends a market order in the escape direction. Both the stop-loss and take-profit are scaled to the mean bar range — the average of
High − Lowover the lastRangeWindowbars — which is a first-principles volatility statistic computed straight from price. - Stop-loss logic: The stop is placed
StopMult × meanRangeaway from entry (below entry for longs, above for shorts). - Take-profit logic: The target is placed
TargetMult × meanRangein the trade's favor. - Concept-driven exit: While a position is open, the strategy keeps monitoring overlap. If overlap climbs back above the local mean (
mu), it treats the market as having re-equilibrated — the escape thesis is invalidated — and closes the position early. Otherwise, the stop-loss and take-profit guard the trade.
Only one position is held at a time, and every bar read uses the primary timeframe, so the logic stays clean and single-purpose.
Strategy Parameters
| Parameter | Default | Min | Max | Description |
|---|---|---|---|---|
| BalanceWindow | 40 | 15 | 120 | Lookback (in bars) used to estimate the local overlap regime — the mean (mu) and dispersion (sigma) of recent overlap values. |
| CollapseZ | 1.2 | 0.4 | 3.0 | Anomaly threshold expressed in standard deviations below the local overlap mean. Higher values demand a more extreme collapse before signaling. |
| RangeWindow | 20 | 8 | 60 | Window (in bars) for the raw mean-range volatility statistic that scales the stop-loss and take-profit distances. |
| StopMult | 1.5 | 0.5 | 5.0 | Stop-loss distance as a multiple of the mean bar range. |
| TargetMult | 2.5 | 0.5 | 8.0 | Take-profit distance as a multiple of the mean bar range. |
| Lots | 0.10 | 0.01 | 1.0 | Order volume (position size) in lots. |
Recommended Chart Settings
Interval Overlap Escape is a single-timeframe strategy and can be applied to any symbol and timeframe your platform supports, since it adapts its own baseline to whatever instrument it runs on. A common starting point for study is a liquid major forex pair (for example, EUR/USD) on an intraday timeframe such as M15 or H1, where bar ranges are stable enough for the overlap statistics to be meaningful. Because the default BalanceWindow of 40 bars needs sufficient history, allow the chart to load enough bars before expecting signals. Results will vary across different symbols, timeframes, and market conditions, so treat any chosen configuration as a subject for testing rather than a fixed recommendation.
How to Install on MetaTrader 5
- Download the .ex5 file from the link below
- Copy it to your MT5
MQL5\Expertsfolder - Restart MetaTrader 5 or refresh the Navigator panel
- Drag the EA onto a chart matching the recommended symbol and timeframe
- Configure the input parameters and enable Algo Trading
What to Consider Before Using This EA
The main strength of Interval Overlap Escape is that it is self-adapting. Because the mean and standard deviation of overlap are recomputed every bar from the market's own recent behavior, there are no fixed price or volatility "magic numbers" that go stale as conditions change. The concept-driven early exit is another thoughtful feature: rather than only waiting for a stop or target, the strategy closes a trade when its underlying thesis — that price has escaped its value region — is invalidated by overlap re-equilibrating.
That said, this approach has real limitations. It is fundamentally a breakout system, and breakout logic historically struggles in choppy, range-bound markets, where repeated false escapes can produce a series of small losses. The overlap statistic can behave erratically around price gaps, low-liquidity sessions, or unusually thin bars, which may distort the mean and dispersion. Because only one position is taken at a time and the direction filter is strict, the strategy may sit idle for long stretches, and the standard-deviation threshold means signals can cluster during volatile regimes and vanish during quiet ones. As with any single-timeframe model, it has no awareness of higher-timeframe context, news events, or broader trend structure. None of these points make the strategy good or bad — they simply define the conditions under which it may underperform and where careful testing matters most.
Risk Management Tips
Sound risk management matters far more than any single entry rule. Consider these general principles as you study this or any strategy:
- Position sizing: Keep the
Lotsvalue appropriate for your account. Many educational sources suggest risking no more than 1–2% of account equity per trade. - Use a demo account first: Test the EA thoroughly on a demo or in the Strategy Tester before considering any live use, so you can observe its behavior across different conditions without capital at risk.
- Understand drawdown: Every strategy experiences losing streaks. Review the maximum drawdown in testing and ask whether you could tolerate it emotionally and financially.
- Respect the stops: The stop-loss exists to cap individual losses. Avoid widening or removing it in an attempt to avoid taking a loss.
- Diversify your study: Do not rely on a single EA or a single market. Understanding why a strategy behaves as it does is more valuable than the raw signals it produces.
Risk Warning
Trading foreign exchange, CFDs, and other leveraged financial instruments involves substantial risk of loss and is not suitable for all investors. The strategies and tools discussed on this page are provided for educational purposes only and do not constitute financial advice, investment recommendations, or solicitation to trade. Always consult a qualified financial adviser before making trading decisions. Past backtest performance is not indicative of future results.
Downloads
- Expert Advisor: IntervalOverlapEscape.ex5 (67 downloads)
- Source Code: IntervalOverlapEscape.mq5 (64 downloads)
- Documentation: IntervalOverlapEscape.pdf (67 downloads)