
Disclaimer: This article is for educational and informational purposes only. It does not constitute financial or investment advice. Trading forex and CFDs carries significant risk of loss. Past performance of any strategy — including backtests — does not guarantee future results. Never trade with money you cannot afford to lose.
What Is This Strategy?
The Interquartile Range Breakout is a volatility-squeeze breakout strategy built on the interquartile range (IQR) — a robust statistical measure of price dispersion borrowed from descriptive statistics. Instead of measuring market "tightness" with a standard deviation, Bollinger Band width, or an Average True Range (ATR), this Expert Advisor (EA) ranks the spread between the 25th and 75th percentiles of recent closing prices. That difference is the IQR, and it describes where the middle 50% of closing prices have been sitting — the statistical "value cluster" of the market.
The core idea addresses a well-known weakness of ordinary squeeze detectors: a single spike bar. One unusually large candle can inflate an ATR or standard-deviation reading and disguise what is actually a quiet consolidation. Because quartiles discard the outer tails of the distribution, the IQR is far less sensitive to those one-off outliers. This makes the strategy an interesting learning tool for anyone studying robust statistics, volatility compression, and the classic "accumulation-to-markup" transition that breakout traders look for.
This EA is designed for educational study of breakout trading in choppy, spike-prone conditions. It is best suited to learners who already understand basic candle mechanics and want to explore how a percentile-based dispersion filter behaves compared with conventional volatility tools. It is not a beginner "set and forget" system, and it is not a shortcut — it is a transparent, rules-based framework for understanding one particular market behavior.
How It Works
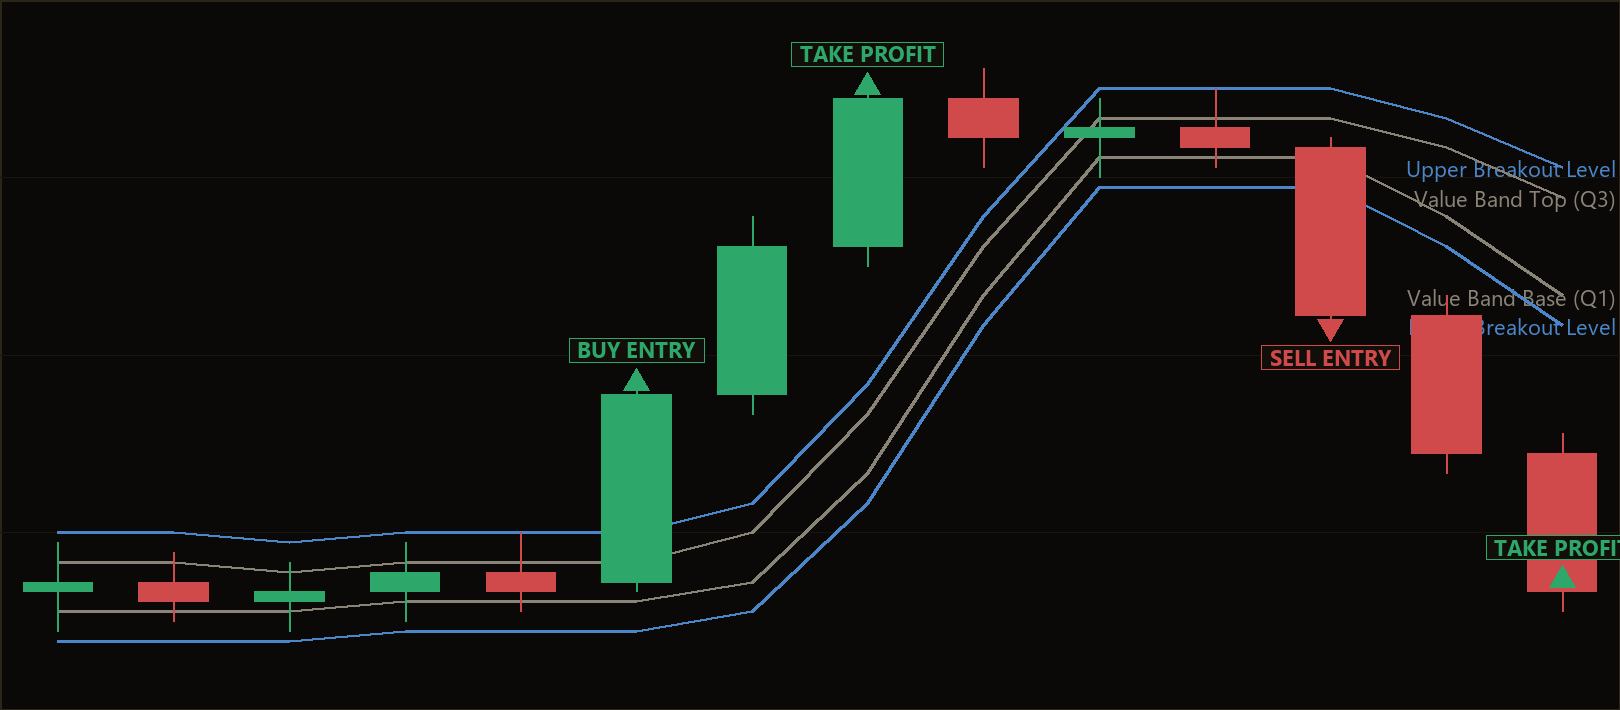
The strategy processes each newly completed candle (it acts once per bar, not on every tick). It looks at the recent history of closing prices, measures compression, and then checks whether the latest close has broken decisively out of the value band. Here is the logic in plain English:
- Building the value band: The EA takes the last N closing prices behind the signal bar (set by
QuartileLookback) and computes Q1 (the 25th percentile) and Q3 (the 75th percentile). The zone between them,[Q1 .. Q3], is the "fair-value" band where the middle half of recent closes lived. - Measuring dispersion: The IQR (
Q3 − Q1) becomes a spike-resistant volatility gauge. A narrow IQR means closes have been tightly clustered; a wide IQR means they have been spread out. - Compression filter: The strategy ranks the current IQR against its own recent history (
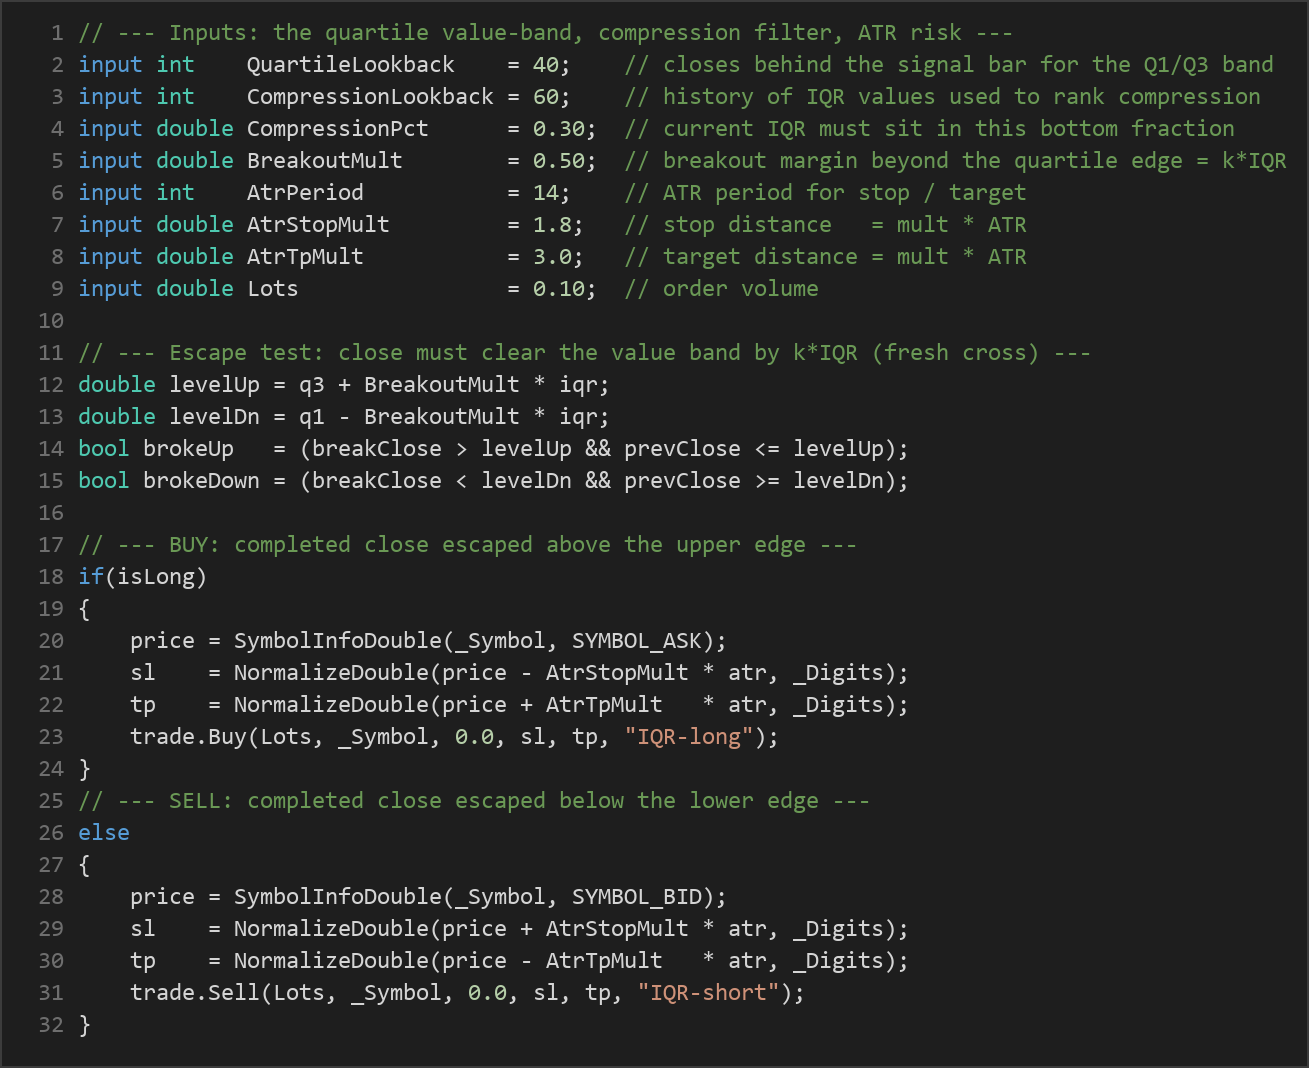
CompressionLookbackpast readings). The current IQR must fall in the bottomCompressionPctfraction of that history to qualify as a genuine low-dispersion "coil." This is what keeps the filter honest — it demands a real compression regime, not just a random quiet moment. - Escape / breakout test: Once compression is confirmed, the just-completed close must break clear of the band by an IQR-scaled margin:
- The strategy signals a LONG when
close > Q3 + (BreakoutMult × IQR). - The strategy signals a SHORT when
close < Q1 − (BreakoutMult × IQR). - Fresh-cross filter: The candle before the breakout close must still have been inside the trigger level. This prevents the EA from chasing a move that has already extended well beyond the band.
- One position at a time: The strategy allows only a single open position per magic number, so it will not stack trades on the same symbol.
- Stop-loss logic: Risk is controlled with an ATR-based stop. The stop distance equals
AtrStopMult × ATR, placed below entry for longs and above entry for shorts. - Take-profit logic: The target uses an independent multiple,
AtrTpMult × ATR, placed above entry for longs and below entry for shorts. Because the stop and target multiples are separate inputs, you can study different reward-to-risk configurations.
In short, the strategy signals a trade only when a spike-robust measure of dispersion says the market has genuinely coiled and a fresh close escapes the value cluster by a volatility-scaled margin.
Strategy Parameters
| Parameter | Default | Min | Max | Description |
|---|---|---|---|---|
| QuartileLookback | 40 | 20 | 100 | Number of recent closes behind the signal bar used to build the Q1/Q3 value band. |
| CompressionLookback | 60 | 30 | 150 | How many past IQR readings are used to rank the current compression. |
| CompressionPct | 0.30 | 0.10 | 0.60 | The current IQR must sit in this bottom fraction of its recent history to count as compressed. |
| BreakoutMult | 0.50 | 0.10 | 1.50 | Breakout margin beyond the quartile edge, expressed as this multiple of the IQR. |
| AtrPeriod | 14 | 5 | 30 | Lookback period for the ATR used to size the stop and target. |
| AtrStopMult | 1.8 | 0.5 | 5.0 | Stop-loss distance as a multiple of ATR. |
| AtrTpMult | 3.0 | 0.5 | 8.0 | Take-profit distance as a multiple of ATR. |
| Lots | 0.10 | 0.01 | 1.0 | Fixed order volume (position size) in lots. |
Recommended Chart Settings
The Interquartile Range Breakout is a single-timeframe strategy: every calculation runs on the chart's own symbol and period, so it adapts to whatever timeframe you attach it to. For study purposes, many breakout and volatility-compression concepts are commonly explored on the H1 (1-hour) or H4 (4-hour) timeframes of liquid major forex pairs such as EUR/USD or GBP/USD, where spreads are tight and price behavior is relatively well-documented.
That said, the quartile lookbacks (40 closes for the band, up to 150 for compression history) mean the EA needs a healthy amount of bar history before it produces its first signal. Lower timeframes generate more signals but also more noise; higher timeframes produce fewer, slower setups. There is no universally "correct" setting — results will vary considerably across symbols, timeframes, and market regimes, so treat any configuration as a starting point for your own testing rather than a recommendation.
How to Install on MetaTrader 5
- Download the .ex5 file from the link below
- Copy it to your MT5
MQL5\Expertsfolder - Restart MetaTrader 5 or refresh the Navigator panel
- Drag the EA onto a chart matching the recommended symbol and timeframe
- Configure the input parameters and enable Algo Trading
What to Consider Before Using This EA
Strengths of this approach. The most distinctive feature is its use of robust statistics. By relying on quartiles rather than mean-based measures, the compression filter is genuinely resistant to single spike bars — the exact situation where an ATR or standard-deviation squeeze can give a false reading. The fresh-cross filter is a thoughtful touch that discourages the EA from entering moves that are already stretched, and the separation of stop and target multiples makes it easy to study different reward-to-risk profiles. Because every rule is explicit and transparent, it is a strong teaching example of how percentile-based logic behaves.
Known limitations. Breakout systems in general face the "false breakout" problem: a market can poke above a level, trigger an entry, and immediately reverse back into the range. No amount of statistical robustness eliminates this — it only changes how often it happens. The compression requirement also means the strategy sits on its hands for long stretches, which some traders find difficult to accept. And because the value band is built from closing prices only, sharp intrabar wicks that never close beyond the band are ignored, which can be a strength or a blind spot depending on the market.
Where it may underperform. In persistently trending markets with no genuine consolidation, the compression filter may rarely trigger, and the strategy can miss extended directional moves. In violently whipsawing conditions, breakouts may fire and reverse repeatedly, generating a string of stopped-out trades. As always, historical behavior in a backtest may not resemble live conditions, and different brokers, spreads, and execution speeds can meaningfully change outcomes.
Risk Management Tips
Sound risk management matters far more than any single entry signal. Consider these general principles as you study this EA:
- Position sizing: The fixed
Lotsinput does not scale to your account size. Many educational sources suggest risking no more than 1–2% of account equity per trade. Calculate the lot size that keeps your ATR-based stop within that limit rather than leaving the default unchanged. - Test on a demo account first: Run the strategy on a demo account across different symbols and market conditions before ever considering real capital. This lets you observe how often it trades and how it behaves in trends versus ranges.
- Understand drawdown: Every strategy experiences losing streaks. Study the depth and duration of drawdowns in testing so you know what a normal rough patch looks like and are less likely to abandon a plan at the worst moment.
- Respect the stop-loss: The ATR-based stop is central to this design. Widening or removing stops to "give a trade room" is one of the most common ways traders turn a small, planned loss into a large, unplanned one.
- Diversify and stay realistic: No single EA should carry your entire plan. Treat this as one component of a broader, well-understood approach — and remember that leverage magnifies losses just as much as gains.
Risk Warning
Trading foreign exchange, CFDs, and other leveraged financial instruments involves substantial risk of loss and is not suitable for all investors. The strategies and tools discussed on this page are provided for educational purposes only and do not constitute financial advice, investment recommendations, or solicitation to trade. Always consult a qualified financial adviser before making trading decisions. Past backtest performance is not indicative of future results.
Downloads
- Expert Advisor: InterquartileRangeBreakout.ex5 (43 downloads)
- Source Code: InterquartileRangeBreakout.mq5 (48 downloads)
- Documentation: InterquartileRangeBreakout.pdf (51 downloads)