Disclaimer: This article is for educational and informational purposes only. It does not constitute financial or investment advice. Trading forex and CFDs carries significant risk of loss. Past performance of any strategy — including backtests — does not guarantee future results. Never trade with money you cannot afford to lose.
What Is This Strategy?
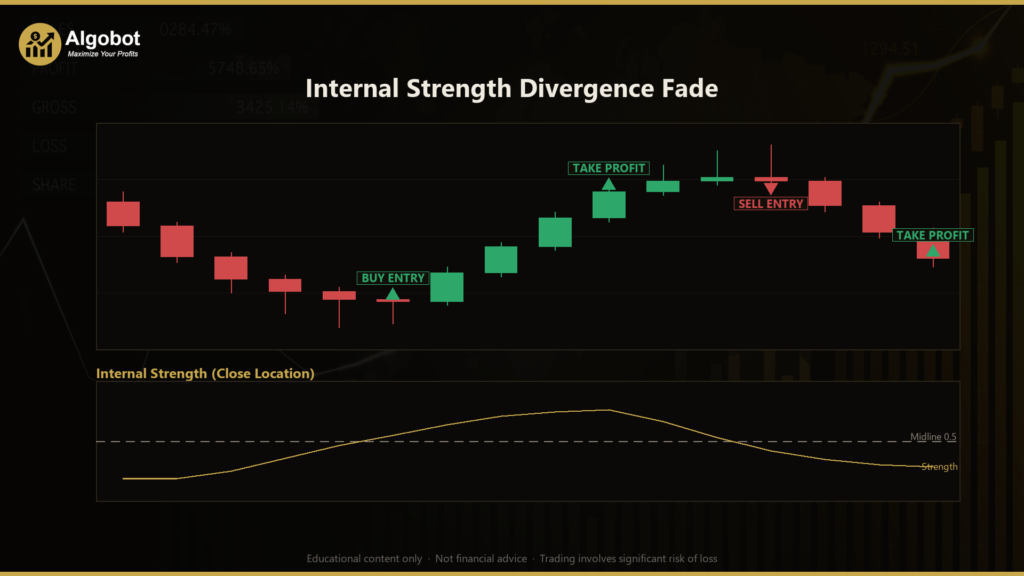
The Internal Strength Divergence Fade is a counter-trend, mean-reversion trading strategy for MetaTrader 5 built around an idea that most oscillator systems ignore: the divergence between where price is going and where each candle actually closes inside its own range. Its core measurement is the close location value (CLV) — a simple ratio, (Close − Low) / (High − Low), that returns a number between 0 and 1 telling you where a bar closed within its own high-low span. A CLV near 1 means the bar closed on its high (buyers owned the close); a CLV near 0 means it closed on its low (sellers owned it). The strategy smooths this raw CLV into a "strength line" and compares its direction against the direction of price itself.
The reasoning is intuitive. In a healthy uptrend, price rises and bars keep closing high in their range — internal strength climbs alongside price. The tell of exhaustion is when price keeps grinding to higher closes but internal strength is quietly falling: each new high is being sold into, and closes creep toward the lows. That mismatch is classic bearish divergence at a top, and the strategy fades it by looking short. The mirror image — price making lower closes while internal strength lifts, because sellers can no longer close on the lows — is bullish divergence at a bottom, faded long.
As a learning tool, this strategy suits traders who want to study how divergence, candle anatomy, and least-squares slope analysis combine into a non-repainting reversal signal. It is best understood as an analytical framework for spotting momentum exhaustion — not as a shortcut to returns. Because it fades established moves, it demands disciplined risk control, which the code builds in structurally.
How It Works
The strategy processes only closed bars (the forming bar is used solely to detect when a new bar has opened), which keeps its signals non-repainting. On each newly closed bar it updates its internal-strength line and evaluates entry conditions.
- Building the strength line: For every closed bar, the strategy computes the CLV and feeds it into an exponential moving average (EMA) whose period is set by
StrengthSmooth. This produces a smoothed "internal strength" series that filters out single-bar noise. - Measuring divergence with slopes: Over a
Lookbackwindow, the strategy fits a least-squares regression line to the closing prices and, separately, to the strength line. The price slope is normalized into ATR-per-bar units, so the same threshold works consistently across different symbols and timeframes. Divergence exists when the price slope runs one way while the strength slope runs the other. - Confirming a genuine extreme: A divergence only matters near the edge of a move. The strategy checks where the latest close sits within the lookback window's high-low band (
rangePos, from 0 at the window low to 1 at the window high) and requires it to be beyond theExtremeFracthreshold before arming. - Final candle confirmation: The most recent bar must close on the weak side of its own range for the fade to trigger — CLV below 0.5 for a short (a weak close near the lows) or above 0.5 for a long (a strong close near the highs).
The signals fire as follows:
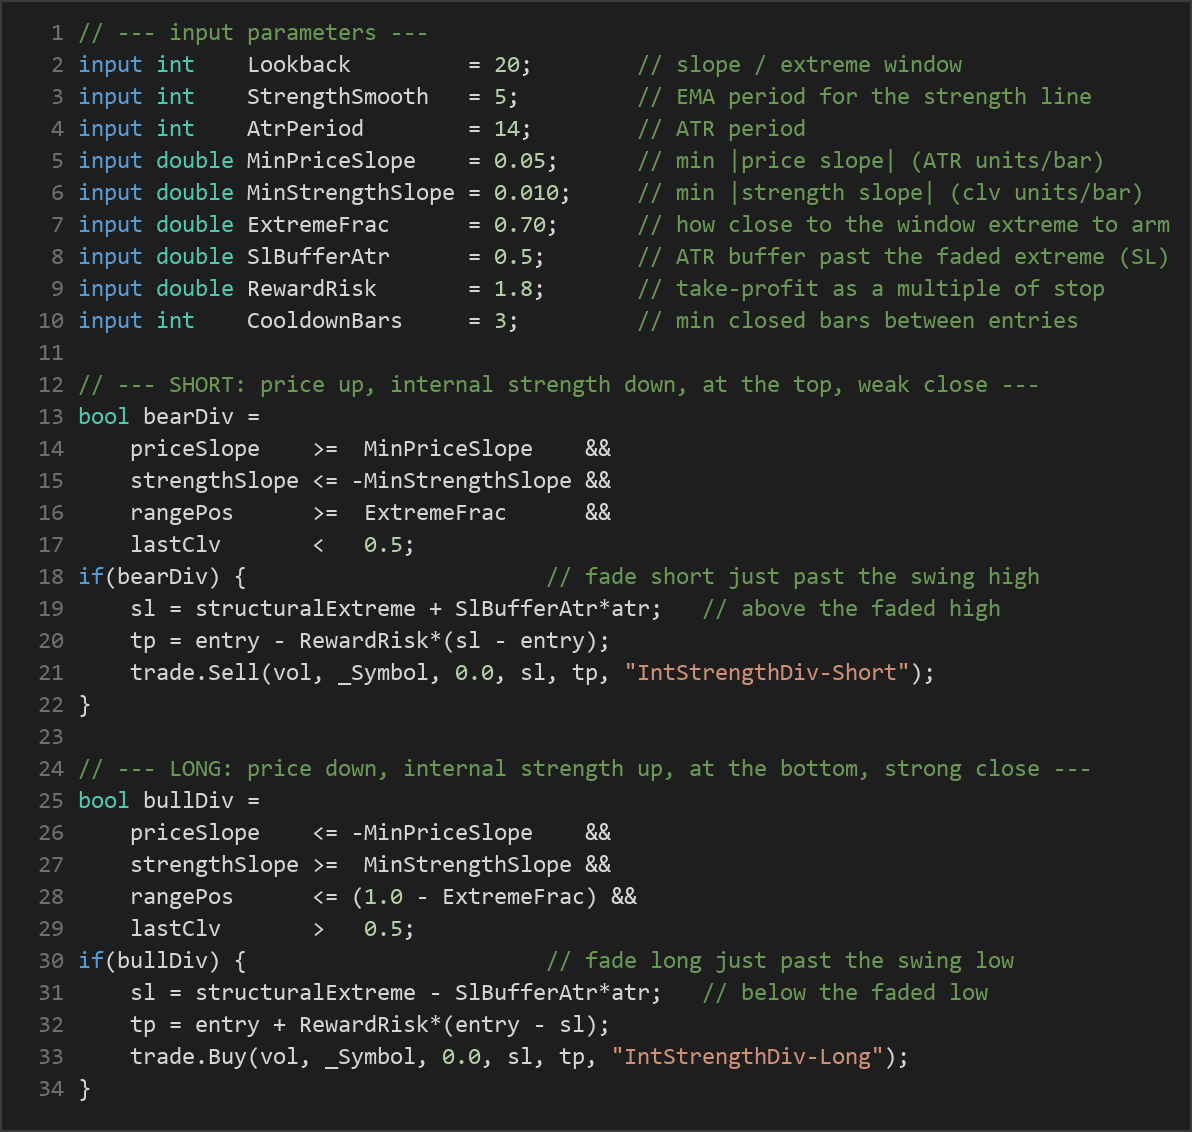
- Bearish divergence (fade short): price slope ≥
MinPriceSlope, strength slope ≤ −MinStrengthSlope, close near the top of the range (rangePos≥ExtremeFrac), and the latest bar closes weak (CLV < 0.5). - Bullish divergence (fade long): price slope ≤ −
MinPriceSlope, strength slope ≥MinStrengthSlope, close near the bottom of the range (rangePos≤ 1 −ExtremeFrac), and the latest bar closes strong (CLV > 0.5).
Exit and risk logic is structural:
- Stop-loss: placed just past the faded extreme — below the swing low for a long, above the swing high for a short — buffered by
SlBufferAtrmultiplied by the current ATR (Average True Range, a volatility measure). This gives the trade room beyond the level it is fading. - Take-profit: set at a multiple of the stop distance defined by
RewardRisk. With the default of 1.8, the target sits 1.8 times as far as the risk. - Optional trailing stop: if
TrailAtrMultis greater than zero, an ATR-based trailing stop ratchets in the trade's favor only, never loosening. - Trade governance: only one position is held at a time, and a
CooldownBarsgap is enforced between entries to avoid over-trading the same exhaustion pocket.

Strategy Parameters
| Parameter | Default | Min | Max | Description |
|---|---|---|---|---|
| Lookback | 20 | 8 | 60 | Number of closed bars used for the least-squares slope and the extreme (high-low band) window. |
| StrengthSmooth | 5 | 2 | 20 | EMA period that smooths the raw close-location value into the internal-strength line. |
| AtrPeriod | 14 | 7 | 30 | ATR period used to normalize the price slope and to size the stop buffer. |
| MinPriceSlope | 0.05 | 0.0 | 0.50 | Minimum absolute price slope (in ATR units per bar) required to confirm a directional move. |
| MinStrengthSlope | 0.010 | 0.0 | 0.10 | Minimum absolute strength-line slope (in CLV units per bar) needed on the opposing side. |
| ExtremeFrac | 0.70 | 0.0 | 1.0 | How close to the window's high or low the close must be before a fade is armed. |
| SlBufferAtr | 0.5 | 0.0 | 3.0 | ATR multiple added beyond the faded extreme to place the stop-loss. |
| RewardRisk | 1.8 | 0.5 | 5.0 | Take-profit distance as a multiple of the stop distance. |
| TrailAtrMult | 0.0 | 0.0 | 4.0 | ATR multiple for the optional trailing stop (0 disables trailing). |
| CooldownBars | 3 | 0 | 30 | Minimum number of closed bars required between consecutive entries. |
| Lots | 0.10 | 0.01 | 2.0 | Fixed trade volume in lots. |
Recommended Chart Settings
This strategy was designed with EUR/USD, GBP/JPY, and XAU/USD (gold) in mind, on the M15 to H1 timeframes. It reads only the primary chart's timeframe, so it will run on whatever timeframe you attach it to. The default parameters are tuned for those instruments and timeframes, but every market behaves differently. Volatility, spread, and the character of trends vary from symbol to symbol and from one market regime to another, so results will vary across different conditions. Always test on the exact symbol, timeframe, and broker you intend to use before drawing any conclusions.
How to Install on MetaTrader 5
- Download the .ex5 file from the link below
- Copy it to your MT5
MQL5\Expertsfolder - Restart MetaTrader 5 or refresh the Navigator panel
- Drag the EA onto a chart matching the recommended symbol and timeframe
- Configure the input parameters and enable Algo Trading
What to Consider Before Using This EA
The strength of this approach is that it looks at something genuinely different. Where most reversal systems watch price-versus-indicator divergence, this one adds the candle's internal anatomy — how price closes within each bar's range — which can surface exhaustion that a price-only oscillator misses. The use of ATR-normalized slopes means its thresholds are portable across symbols and timeframes, and its stops are anchored to real market structure rather than arbitrary fixed distances. The non-repainting design (all decisions made on closed bars) means a signal you see historically is a signal that genuinely existed at that time.
That said, counter-trend fading carries well-known limitations. The single hardest environment for any exhaustion-reversal system is a strong, persistent trend: price can keep making higher closes with weakening internal strength for far longer than seems reasonable, and fading each apparent top can produce a string of stopped-out trades. The strategy tries to defend against this with its extreme filter, cooldown, and structural stops — but no filter eliminates trend risk entirely. Choppy, directionless markets can also generate marginal signals where the divergence is real but the follow-through is weak. Divergence is a probabilistic condition, not a guarantee of reversal, so the strategy may underperform when momentum overwhelms mean reversion. Treat it as one analytical lens among many, and study why it enters and exits rather than expecting it to work unattended.
Risk Management Tips
Sound risk management matters more than any single entry signal. Consider these general principles as you study this or any strategy:
- Position sizing: Keep individual trade risk small. A common educational guideline is to risk no more than 1–2% of account equity on any single trade, adjusting lot size to the stop distance rather than trading a fixed lot blindly.
- Use a demo account first: Run the strategy on a demo or paper account until you fully understand how it behaves in trending, ranging, and volatile conditions.
- Understand drawdown: Every strategy experiences losing streaks. Know the maximum drawdown you are willing to tolerate before you start, and size accordingly.
- Account for costs: Spread, commission, and slippage all eat into results — especially for a strategy that trades near extremes where spreads can widen.
- Never over-leverage: Leverage amplifies both gains and losses. Use it conservatively and never trade with money you cannot afford to lose.
Risk Warning
Trading foreign exchange, CFDs, and other leveraged financial instruments involves substantial risk of loss and is not suitable for all investors. The strategies and tools discussed on this page are provided for educational purposes only and do not constitute financial advice, investment recommendations, or solicitation to trade. Always consult a qualified financial adviser before making trading decisions. Past backtest performance is not indicative of future results.
Downloads
- Expert Advisor: InternalStrengthDivergenceFade.ex5 (35 downloads)
- Source Code: InternalStrengthDivergenceFade.mq5 (36 downloads)
- Documentation: InternalStrengthDivergenceFade.pdf (42 downloads)