Disclaimer: This article is for educational and informational purposes only. It does not constitute financial or investment advice. Trading forex and CFDs carries significant risk of loss. Past performance of any strategy — including backtests — does not guarantee future results. Never trade with money you cannot afford to lose.
What Is This Strategy?
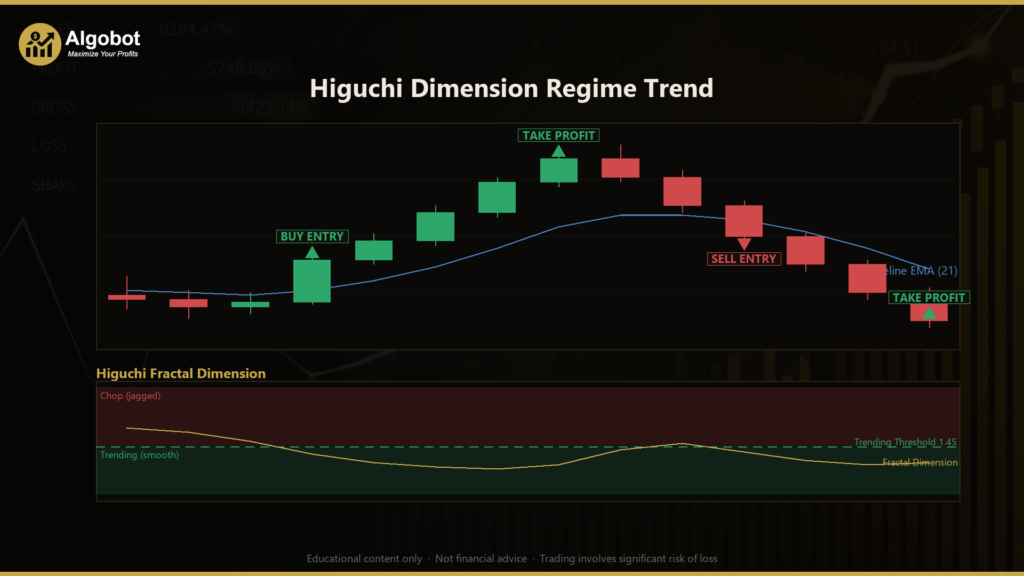
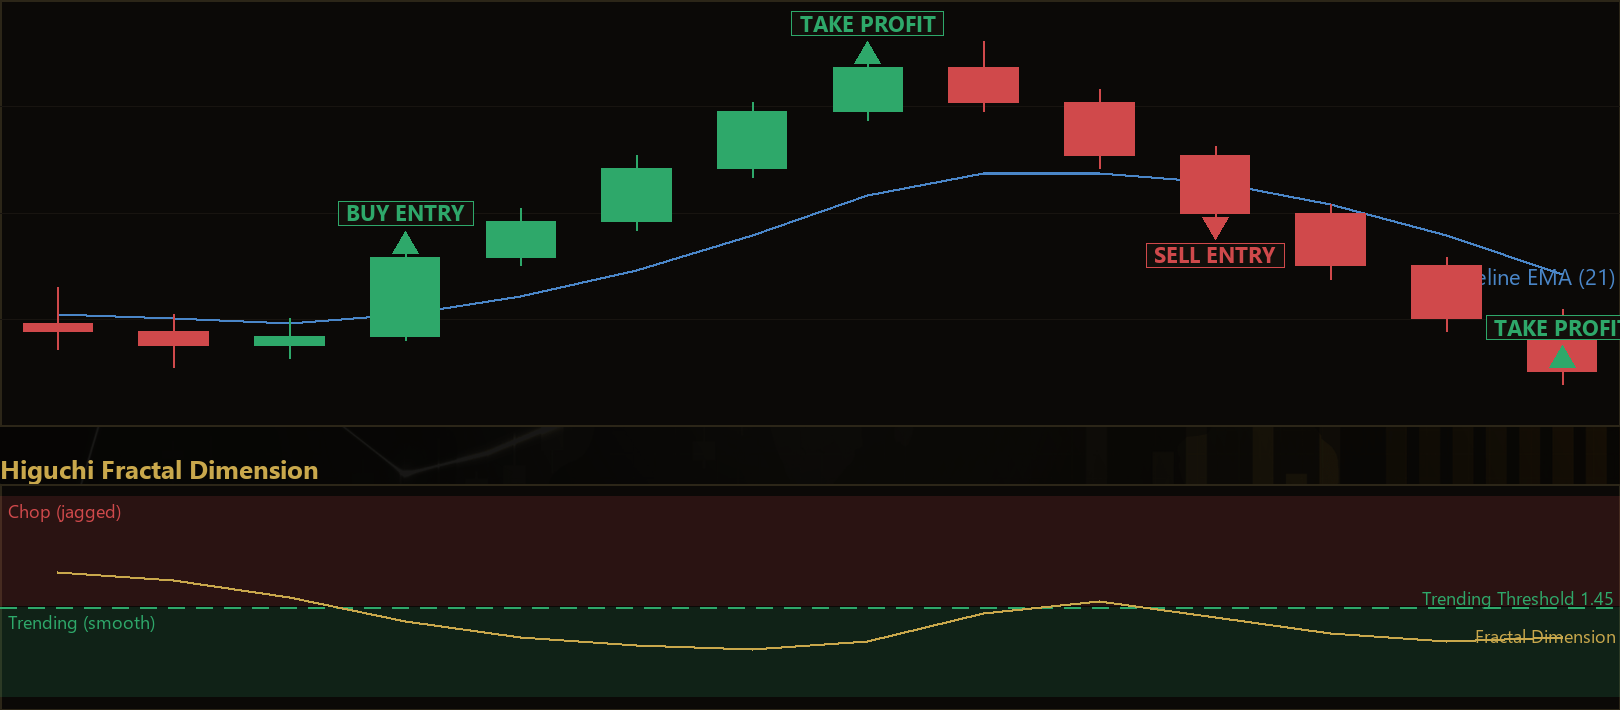
The Higuchi Dimension Regime Trend strategy is a regime-gated trend-following Expert Advisor (EA) that uses the Higuchi fractal dimension — a mathematical measure of how "rough" or "smooth" a price curve is — to decide when momentum signals are worth acting on. Its trading style is classic trend following, but with an unusual filter bolted on the front: instead of asking "is price moving up or down?", it first asks "is the market currently smooth enough to trend at all?"
The idea comes from fractal geometry. Higuchi's 1988 algorithm estimates the fractal dimension (FD) of a time series by measuring how the total length of the price path grows as you re-sample it at coarser and coarser strides. The result is a single number, bounded between 1.0 and 2.0. When the FD sits near 1.0, the price path is smooth and nearly straight — the geometric signature of a persistent trend. When the FD climbs toward 2.0, the path is jagged and space-filling — the signature of choppy, mean-reverting noise where momentum entries tend to fail. This is a genuinely different measurement than a moving-average slope, an efficiency ratio, or a Hurst exponent, because it reads the shape of price directly.
As a learning tool, this strategy is well suited to traders who already understand basic trend following and want to study how a regime filter changes an EA's behaviour. By pairing a simple EMA-cross trigger with a fractal "trend versus chop" gate, it offers a clear, self-contained example of how quantitative regime detection can be layered on top of an ordinary entry rule. It is designed for educational study rather than as a profit opportunity.
How It Works
The strategy acts once per bar, evaluating only completed candles so that signals do not repaint. On each new bar it measures the market's roughness, checks its direction trigger, and then either stands aside or trades.
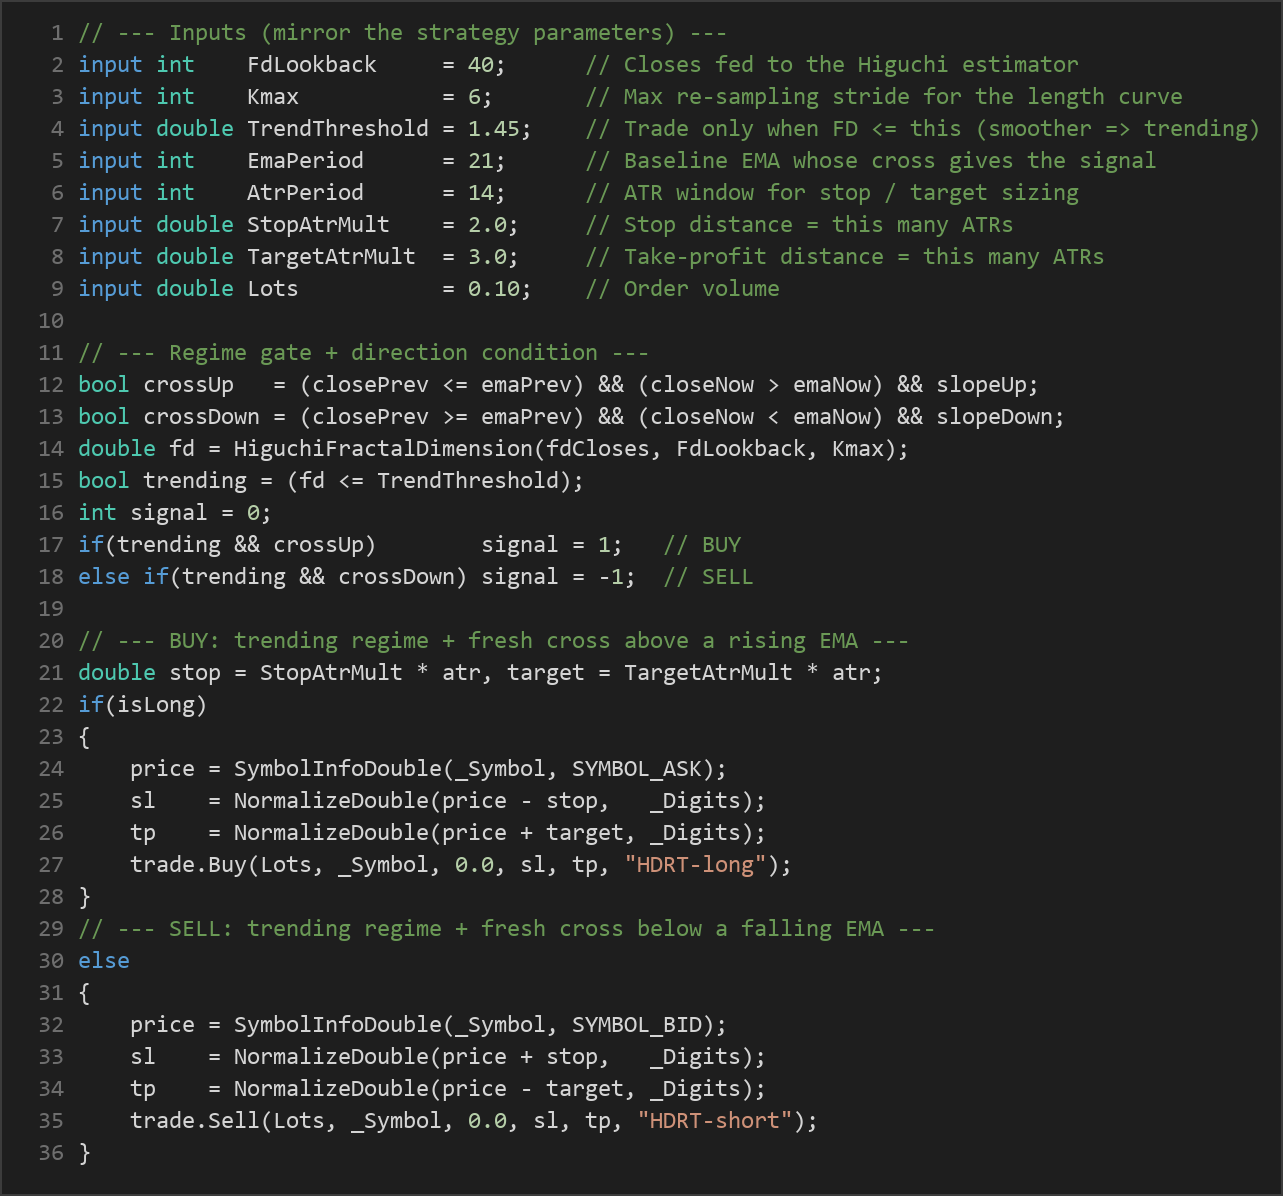
- Regime gate (the fractal filter): The EA computes the Higuchi fractal dimension over the most recent window of closing prices. If the FD is at or below the
TrendThreshold, the market is considered smooth enough to trend and signals are allowed. If the FD is above the threshold, the strategy stands aside entirely — no trades are taken in fractal chop. - Direction trigger (EMA cross): Direction comes from a baseline exponential moving average (EMA), a moving average that weights recent prices more heavily. A valid signal requires a fresh close-cross of the EMA with the EMA itself sloping the same way:
- Long signal: trending regime and the close crosses from at-or-below the EMA to above it and the EMA is rising.
- Short signal: trending regime and the close crosses from at-or-above the EMA to below it and the EMA is falling.
- Stop-and-reverse execution: The book is always kept aligned with the freshly measured trend. When a qualified opposite signal appears, the strategy closes the current position and opens a new one in the other direction. If a same-side position is already open, it is not stacked.
- Stop-loss logic: Risk is sized from the Average True Range (ATR), a volatility measure. The stop is placed
StopAtrMultATRs away from the entry price — below entry for longs, above entry for shorts — so the stop distance automatically widens in volatile conditions and tightens in calm ones. - Take-profit logic: The take-profit is placed
TargetAtrMultATRs from entry in the favourable direction. With the default multipliers, the target sits farther away than the stop, giving a reward-to-risk profile greater than 1:1 on each trade.
Because both the trend gate and the direction trigger must agree, the strategy signals relatively infrequently. That selectivity is by design: the fractal filter is meant to keep the EA out of the ranging conditions where an EMA cross alone tends to whipsaw.
Strategy Parameters
| Parameter | Default | Min | Max | Description |
|---|---|---|---|---|
| FdLookback | 40 | 20 | 120 | Number of completed closes fed to the Higuchi fractal-dimension estimator. Larger values read a longer stretch of the price curve. |
| Kmax | 6 | 3 | 12 | Maximum re-sampling stride used to build the length-versus-scale curve. Controls how many scales the fractal estimate averages over. |
| TrendThreshold | 1.45 | 1.20 | 1.80 | The strategy trades only when the fractal dimension is at or below this value. Lower means "insist on a smoother, cleaner trend." |
| EmaPeriod | 21 | 8 | 80 | Period of the baseline EMA whose close-cross provides the direction trigger. |
| AtrPeriod | 14 | 5 | 40 | Lookback window for the ATR used to size the stop and target. |
| StopAtrMult | 2.0 | 0.5 | 5.0 | Stop-loss distance expressed as a multiple of ATR. |
| TargetAtrMult | 3.0 | 0.5 | 8.0 | Take-profit distance expressed as a multiple of ATR. |
| Lots | 0.10 | 0.01 | 1.0 | Fixed order volume in lots per trade. |
Recommended Chart Settings
The Higuchi Dimension Regime Trend EA is single-timeframe: every calculation is read from the chart's own timeframe, so it runs on whatever timeframe you attach it to. The default parameters — a 40-bar fractal window, a 21-period EMA, and a 14-period ATR — are a sensible starting point for a major forex pair on an intraday timeframe such as H1 or H4, where trend-and-chop cycles are pronounced enough for the fractal gate to add value. Higher timeframes generally produce fewer but cleaner signals, while lower timeframes generate more noise that the fractal filter must work harder to reject.
There is no universally "correct" symbol or timeframe. The fractal dimension responds to the character of each instrument, so results will vary considerably across pairs, sessions, and market regimes. Always test any configuration on your own data before drawing conclusions.
How to Install on MetaTrader 5
- Download the .ex5 file from the link below
- Copy it to your MT5
MQL5\Expertsfolder - Restart MetaTrader 5 or refresh the Navigator panel
- Drag the EA onto a chart matching the recommended symbol and timeframe
- Configure the input parameters and enable Algo Trading
What to Consider Before Using This EA
The main strength of this approach is its regime awareness. Most simple EMA-cross systems trade in all conditions and bleed capital during range-bound markets, where crosses cluster and reverse quickly. By requiring a low fractal dimension before acting, the Higuchi Dimension Regime Trend strategy is built to sit out precisely those conditions. The fractal dimension is also a mathematically distinct lens on the market — it does not simply restate what a moving average already tells you — which makes it interesting to study alongside more familiar filters.
There are real limitations to weigh honestly, though. The fractal dimension is a lagging, backward-looking statistic: it describes the roughness of the window that has already closed, so a regime can shift after the gate has opened. The TrendThreshold is a single hard cutoff, and markets near that boundary can flicker in and out of "trending" status, producing missed signals or late entries. Because the strategy is selective, it may go long stretches without trading, which can be psychologically difficult and makes performance sensitive to a small number of trades. It can also underperform in fast, gappy, or news-driven markets where the fractal estimate and the EMA cross disagree, and in strongly trending conditions the stop-and-reverse logic can occasionally flip out of a good position on a brief counter-signal.
As with any regime filter, the parameters interact. A very low threshold produces few, high-conviction signals; a higher one lets more marginal trends through. Neither is inherently better — the right balance depends on the instrument, timeframe, and your own risk tolerance, and it should be discovered through careful testing rather than assumed.
Risk Management Tips
Sound risk management matters more than any single indicator. Consider these general principles as you study this EA:
- Position sizing: Keep individual trade risk small relative to your account. A common educational guideline is to risk no more than 1–2% of account equity per trade, adjusting the
Lotsvalue so the ATR-based stop distance stays within that budget. - Understand drawdown: Every strategy experiences losing streaks. Study the historical drawdown of any configuration and ask whether you could tolerate it emotionally and financially before committing real capital.
- Test on a demo account first: Run the EA on a demo or simulated account until you understand how often it trades and how it behaves across different regimes.
- Respect leverage: Leverage amplifies both gains and losses. Use it conservatively, and never allocate money you cannot afford to lose.
- Review regularly: Market character changes over time. Periodically re-examine whether your chosen threshold and EMA period still match current conditions.
Risk Warning
Trading foreign exchange, CFDs, and other leveraged financial instruments involves substantial risk of loss and is not suitable for all investors. The strategies and tools discussed on this page are provided for educational purposes only and do not constitute financial advice, investment recommendations, or solicitation to trade. Always consult a qualified financial adviser before making trading decisions. Past backtest performance is not indicative of future results.
Downloads
- Expert Advisor: HiguchiDimensionRegimeTrend.ex5 (43 downloads)
- Source Code: HiguchiDimensionRegimeTrend.mq5 (50 downloads)
- Documentation: HiguchiDimensionRegimeTrend.pdf (56 downloads)