Disclaimer: This article is for educational and informational purposes only. It does not constitute financial or investment advice. Trading forex and CFDs carries significant risk of loss. Past performance of any strategy — including backtests — does not guarantee future results. Never trade with money you cannot afford to lose.
What Is This Strategy?
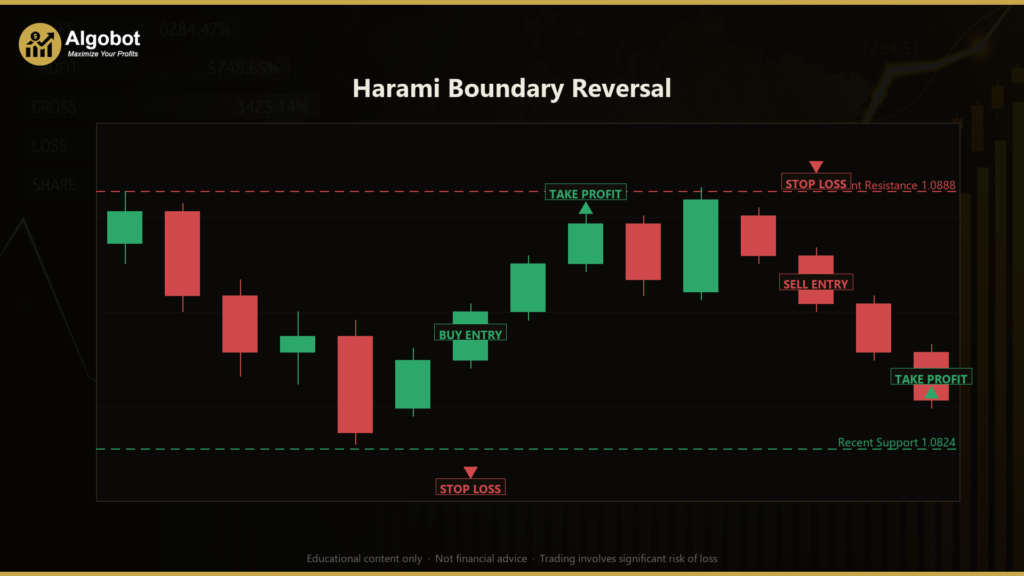
The Harami Boundary Reversal is a price-action reversal strategy that combines the harami candlestick pattern (a two-bar "inside body" stall) with a support and resistance boundary, then filters every signal through the Average True Range (ATR) — a volatility indicator that measures the average distance price travels per bar. Rather than relying on a moving average crossover or an oscillator, it reads raw bar geometry to detect a specific moment of momentum exhaustion at the edge of a recent trading range.
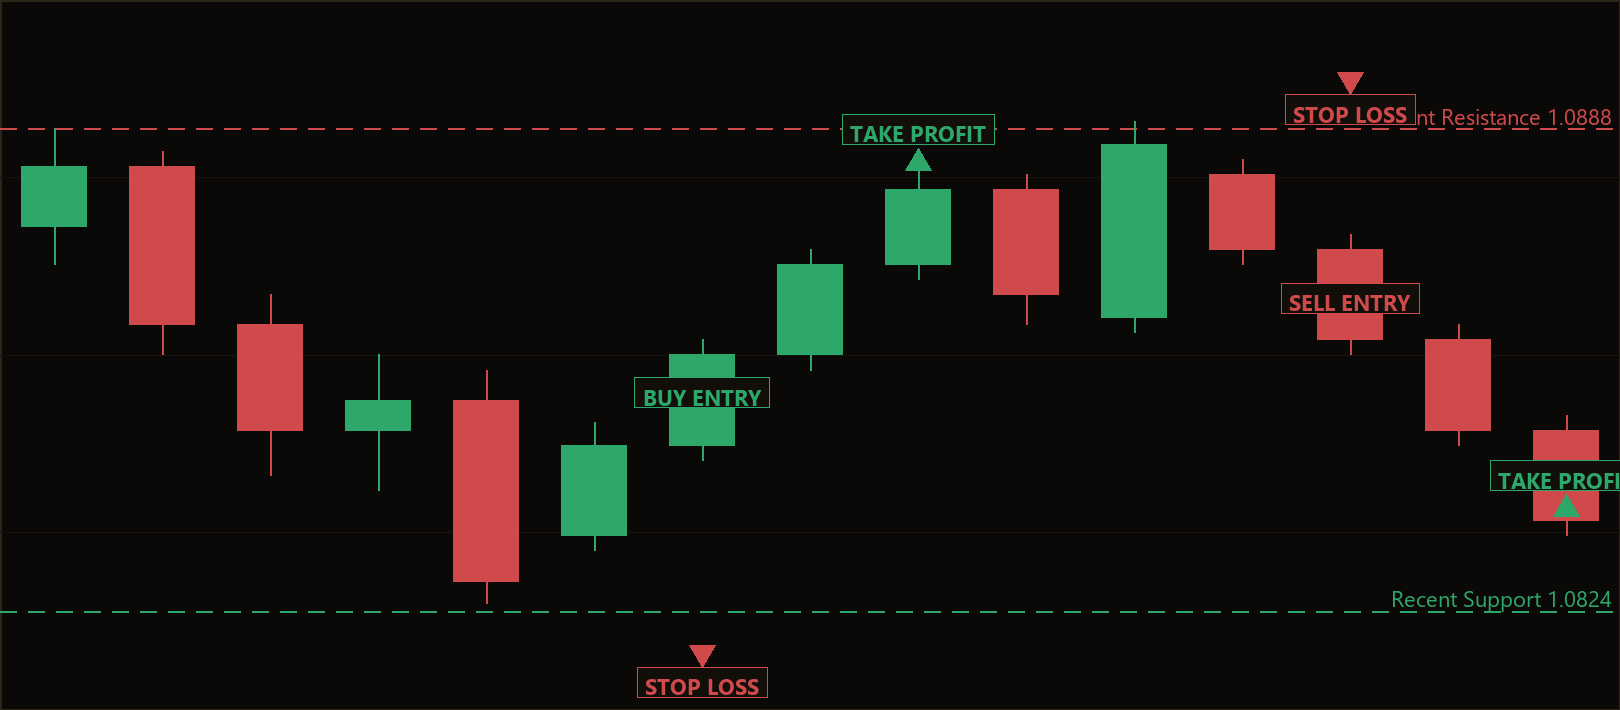
The core idea is intuitive. A wide "mother" candle pushes with conviction directly into an established level — recent resistance above or recent support below. The very next "child" candle then opens and closes entirely within the mother's body, forming a harami. That sudden collapse of range, occurring precisely at a level where opposing orders tend to rest, is a textbook sign that the side doing the pushing has run out of fresh participants. The strategy fades that drive, looking for price to reverse back into the range.
This makes it a counter-trend, mean-reversion style approach best suited as a learning tool for traders who want to study how candlestick patterns interact with horizontal levels. It is designed for ranging or boundary-respecting market conditions rather than strong, sustained trends. If you are exploring how classic price-action concepts can be expressed as objective, rule-based logic, this strategy offers a clear, self-contained example to analyze.
How It Works
The strategy evaluates the chart once per newly closed bar and only considers a new trade when no position is already open for its magic number. When it runs, it builds two ingredients — the harami pattern and the range boundary — and confirms both before signalling.
- Identifying the two pattern bars: The most recent closed bar is treated as the child (the stall), and the bar before it is the mother (the conviction drive into the level).
- Harami containment: The child's body must sit fully inside the mother's body — the child's body high at or below the mother's body high, and the child's body low at or above the mother's body low.
- Child must be small: The child body must be no larger than
HaramiMaxRatiotimes the mother body, confirming a genuine contraction of range. - Mother must be strong: The mother body must be at least
MinMotherBodyAtrtimes the current ATR, so the drive into the level was a real conviction move and not background noise. - Locating the boundary: The strategy scans the
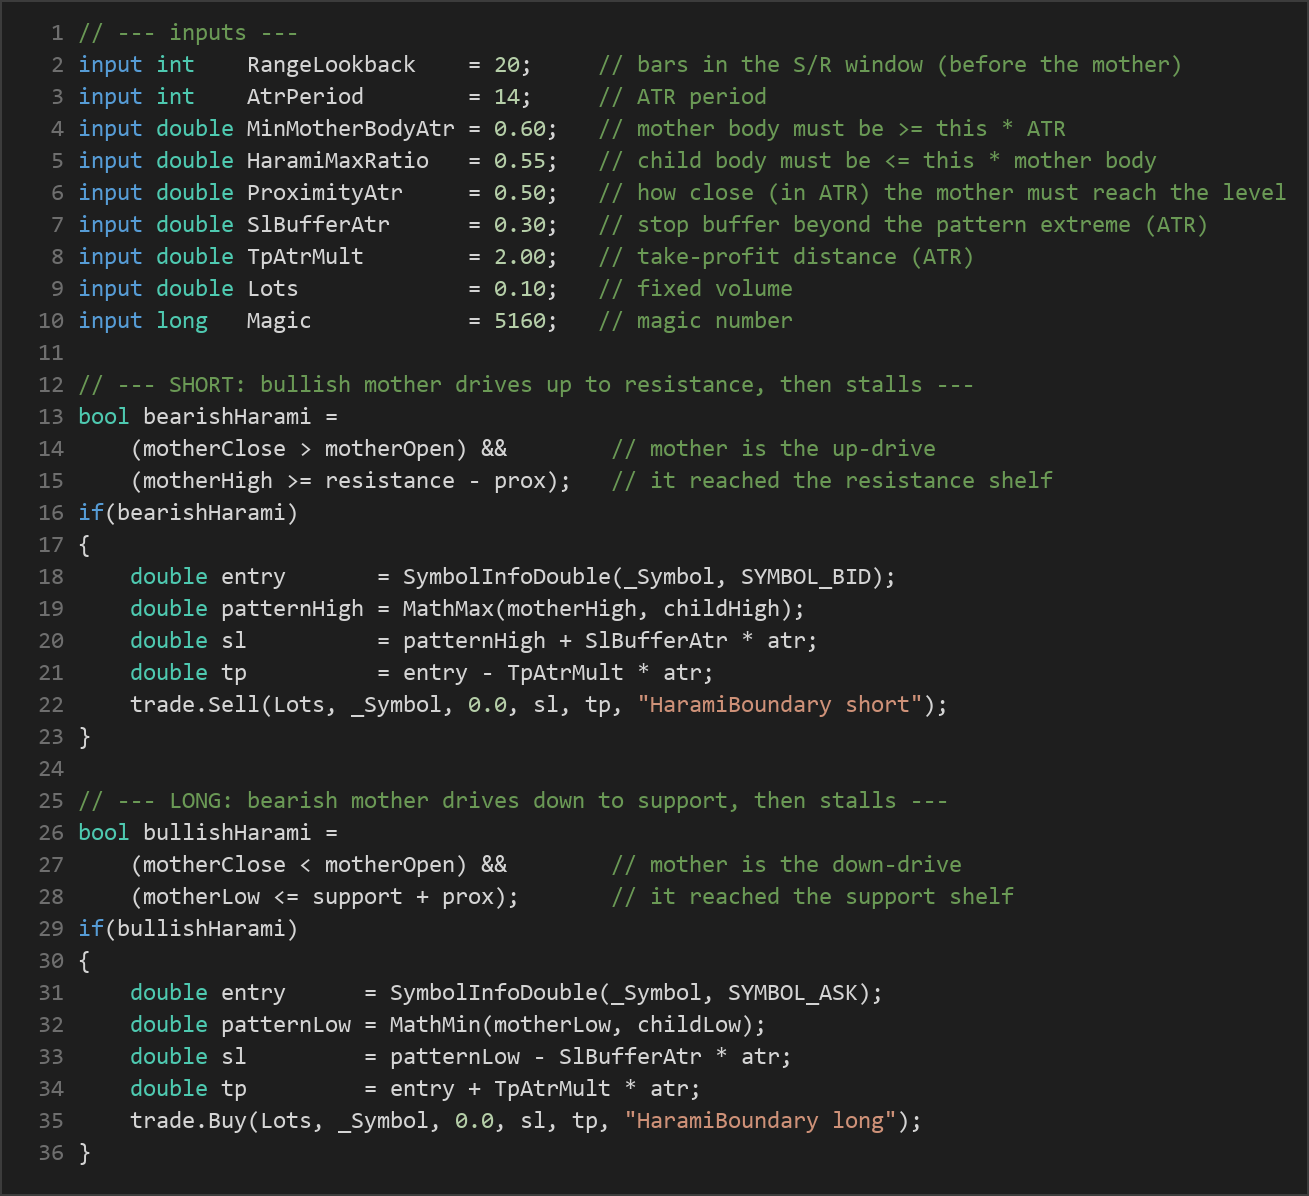
RangeLookbackbars that come before the mother candle to find the highest high (resistance) and lowest low (support). Measuring the level before the mother avoids letting the drive itself distort the boundary. - Short signal (bearish harami at resistance): The strategy signals a short when the mother is a bullish up-candle whose high reached within
ProximityAtr× ATR of the recent resistance, and the child forms a harami inside it. This may indicate that buyers stalled exactly at the ceiling. - Long signal (bullish harami at support): The strategy signals a long when the mother is a bearish down-candle whose low reached within
ProximityAtr× ATR of the recent support, and the child forms a harami inside it. This may indicate that sellers stalled exactly at the floor. - Stop-loss logic: For shorts, the stop is placed above the pattern's highest point (the greater of the mother and child highs) plus
SlBufferAtr× ATR. For longs, it sits below the pattern's lowest point minus the same ATR buffer. The stop therefore rests just beyond the structural extreme of the setup. - Take-profit logic: The target is a fixed
TpAtrMult× ATR distance from entry — below entry for shorts, above entry for longs. Because both stop and target scale with ATR, the strategy adapts automatically to the volatility of whatever timeframe it runs on. - Trade management: Only one position is held at a time per magic number. Once a trade is open, the fixed stop-loss and take-profit manage the exit; there is no trailing or scaling logic.
Strategy Parameters
| Parameter | Default | Min | Max | Description |
|---|---|---|---|---|
| RangeLookback | 20 | 10 | 60 | Number of bars (before the mother candle) scanned to define the support/resistance boundary. |
| AtrPeriod | 14 | 7 | 30 | Lookback period for the ATR volatility measure used to size moves, stops, and targets. |
| MinMotherBodyAtr | 0.60 | 0.20 | 1.50 | Minimum mother-candle body size, expressed as a multiple of ATR — filters out weak drives. |
| HaramiMaxRatio | 0.55 | 0.20 | 0.90 | Maximum child body size as a fraction of the mother body — enforces a genuine range contraction. |
| ProximityAtr | 0.50 | 0.10 | 1.50 | How close (in ATR) the mother candle must reach the boundary to count as a touch of the level. |
| SlBufferAtr | 0.30 | 0.00 | 1.00 | Extra stop-loss distance beyond the pattern's extreme, in ATR multiples. |
| TpAtrMult | 2.00 | 0.50 | 5.00 | Take-profit distance from entry, expressed as a multiple of ATR. |
| Lots | 0.10 | 0.01 | 1.00 | Fixed trade volume in lots. |
Recommended Chart Settings
This strategy was designed with EUR/USD or XAU/USD (gold) in mind, on the M30 or H1 timeframe, where range edges tend to be respected and exhaustion harami pairs appear regularly. That said, because every threshold is derived from raw bar geometry and ATR, the logic is timeframe-agnostic and will run on whatever timeframe is selected.
Keep in mind that market behaviour differs greatly between instruments and sessions. A setting that historically suited a ranging pair may behave very differently on a strongly trending instrument or during high-impact news. Always test any symbol and timeframe combination thoroughly before drawing conclusions, and expect results to vary across different market conditions.
How to Install on MetaTrader 5
- Download the .ex5 file from the link below
- Copy it to your MT5
MQL5\Expertsfolder - Restart MetaTrader 5 or refresh the Navigator panel
- Drag the EA onto a chart matching the recommended symbol and timeframe
- Configure the input parameters and enable Algo Trading
What to Consider Before Using This EA
Like every approach, the Harami Boundary Reversal has both strengths and clear limitations, and it is worth weighing them honestly before committing time to it.
Strengths. The logic is transparent and fully rule-based — there are no hidden discretionary judgments, which makes it ideal for study and for systematic backtesting. By requiring confluence (a strong drive, a contraction, and a level), it tries to avoid the false signals that plague single-pattern systems. ATR-scaled stops and targets mean it adjusts to volatility automatically rather than using fixed pip distances that may be inappropriate for a given market.
Known limitations. Harami patterns are common, but a harami at a level is not a reliable predictor of reversal on its own — boundaries break frequently, and fading a strong drive is inherently a counter-trend bet. In a sustained trend, the strategy may repeatedly fade momentum that simply continues, leading to a string of stop-outs. The fixed take-profit at a set ATR multiple ignores changing structure, so trades can reverse just short of target or give back open profit. Because only one position is allowed at a time, the EA can also sit idle through good opportunities while managing a single trade.
Where it may underperform. Strong trending markets, low-volatility chop where the ATR-based filters rarely trigger, and news-driven spikes that blow through levels are all conditions where this style of reversal logic historically struggles. Treat it as one lens for understanding price action, not a complete trading system.
Risk Management Tips
Sound risk management matters far more than any single entry signal. Use these general principles as a foundation for your own study:
- Risk a small, fixed fraction per trade. A common educational guideline is to risk no more than 1–2% of account equity on any single position. Adjust the lot size so that the distance to your stop-loss reflects that limit, rather than using a fixed lot blindly.
- Test on a demo account first. Run the strategy on a demo or paper account for an extended period before considering any live use, so you can observe its behaviour across different market conditions without financial consequences.
- Understand drawdown. Every strategy experiences losing streaks. Study the historical drawdown — the peak-to-trough decline in equity — so you know what is normal for the approach and can decide whether you could tolerate it emotionally and financially.
- Account for costs. Spreads, commissions, and slippage all erode results, particularly on shorter timeframes. Make sure your testing reflects realistic trading conditions.
- Avoid over-optimization. It is easy to tune parameters until a backtest looks flattering, but curve-fit settings rarely hold up on new data. Favour robust, stable parameter ranges over perfect historical fits.
- Never risk money you cannot afford to lose. Leverage amplifies both gains and losses, and no strategy removes the possibility of loss.
Risk Warning
Trading foreign exchange, CFDs, and other leveraged financial instruments involves substantial risk of loss and is not suitable for all investors. The strategies and tools discussed on this page are provided for educational purposes only and do not constitute financial advice, investment recommendations, or solicitation to trade. Always consult a qualified financial adviser before making trading decisions. Past backtest performance is not indicative of future results.
Downloads
- Expert Advisor: HaramiBoundaryReversal.ex5 (54 downloads)
- Source Code: HaramiBoundaryReversal.mq5 (56 downloads)
- Documentation: HaramiBoundaryReversal.pdf (56 downloads)