Disclaimer: This article is for educational and informational purposes only. It does not constitute financial or investment advice. Trading forex and CFDs carries significant risk of loss. Past performance of any strategy — including backtests — does not guarantee future results. Never trade with money you cannot afford to lose.
What Is This Strategy?
The Gini Impulse Breakout is a trend and breakout strategy that borrows a tool from economics — the Gini coefficient — and applies it to price action. In economics, the Gini coefficient measures inequality: a value near 0 means wealth is spread perfectly evenly across a population, while a value near 1 means a single participant holds almost everything. This strategy applies exactly the same math to the recent series of absolute bar-to-bar returns, asking one focused question: over the last several bars, was price movement spread evenly across all of them, or was it concentrated into just a handful of explosive candles?
That distinction is the heart of the idea. When motion is evenly distributed, the Gini reading stays low and the market is typically grinding sideways in directionless chop. When motion becomes concentrated — a few dominant bars doing most of the work — the Gini reading climbs, which the strategy interprets as an impulse igniting out of a quiet base. This is a distributional signal: rather than watching a moving-average cross or a simple price high, it watches the shape of the return distribution itself.
As a learning tool, the Gini Impulse Breakout suits traders who are curious about statistical and quantitative approaches to markets and want to understand how a non-price-level concept can be turned into a mechanical entry rule. It is designed for markets that alternate between quiet consolidation and sudden expansion. It is not a "set and forget" money machine — it is a case study in how you can measure the character of movement, not just its magnitude, and use that as the basis of a rules-based system.
How It Works
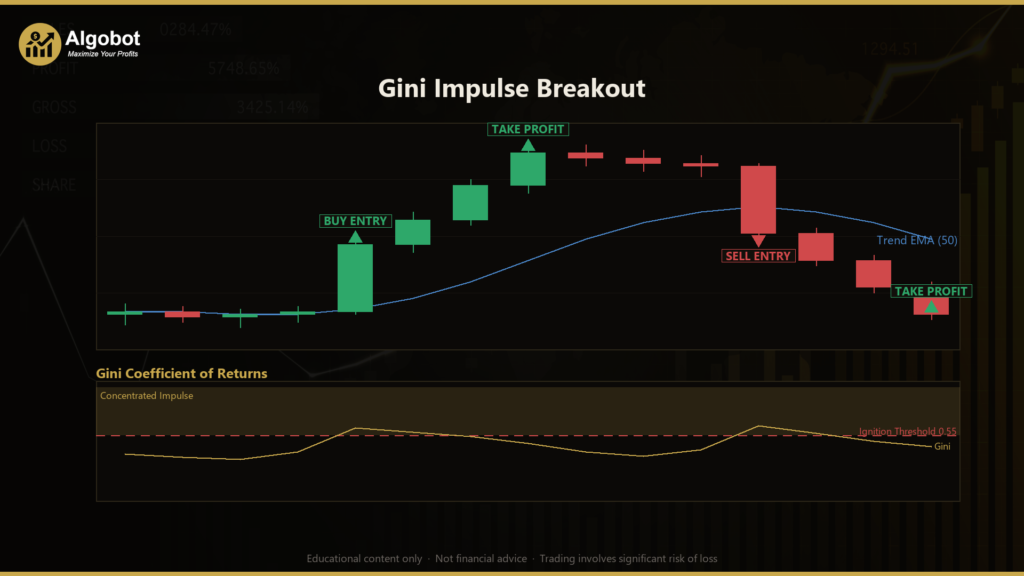
The strategy evaluates its logic once per closed bar. On each new completed candle it recalculates the Gini coefficient of recent returns, checks its regime and volatility filters, and only then decides whether to act. Here is the full flow in plain English:
- Measure concentration: The strategy takes the last
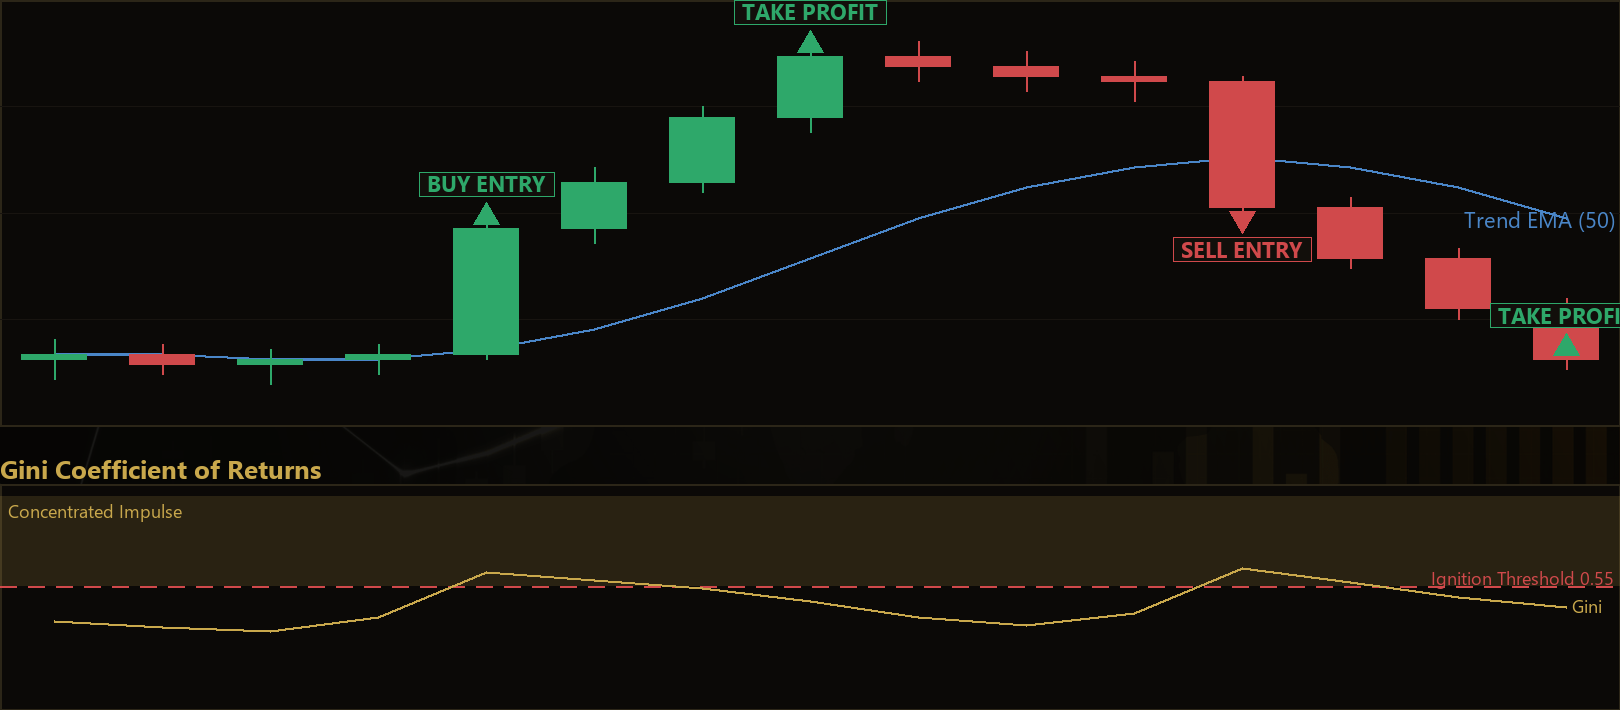
GiniWindowabsolute returns — the size of each bar's close-to-close move, ignoring direction — and computes their Gini coefficient. A low value (roughly 0.2–0.4) means even, choppy movement; a high value means a few bars dominated the window. - Detect a fresh ignition: The strategy signals a potential trade only when the Gini reading freshly crosses up through the
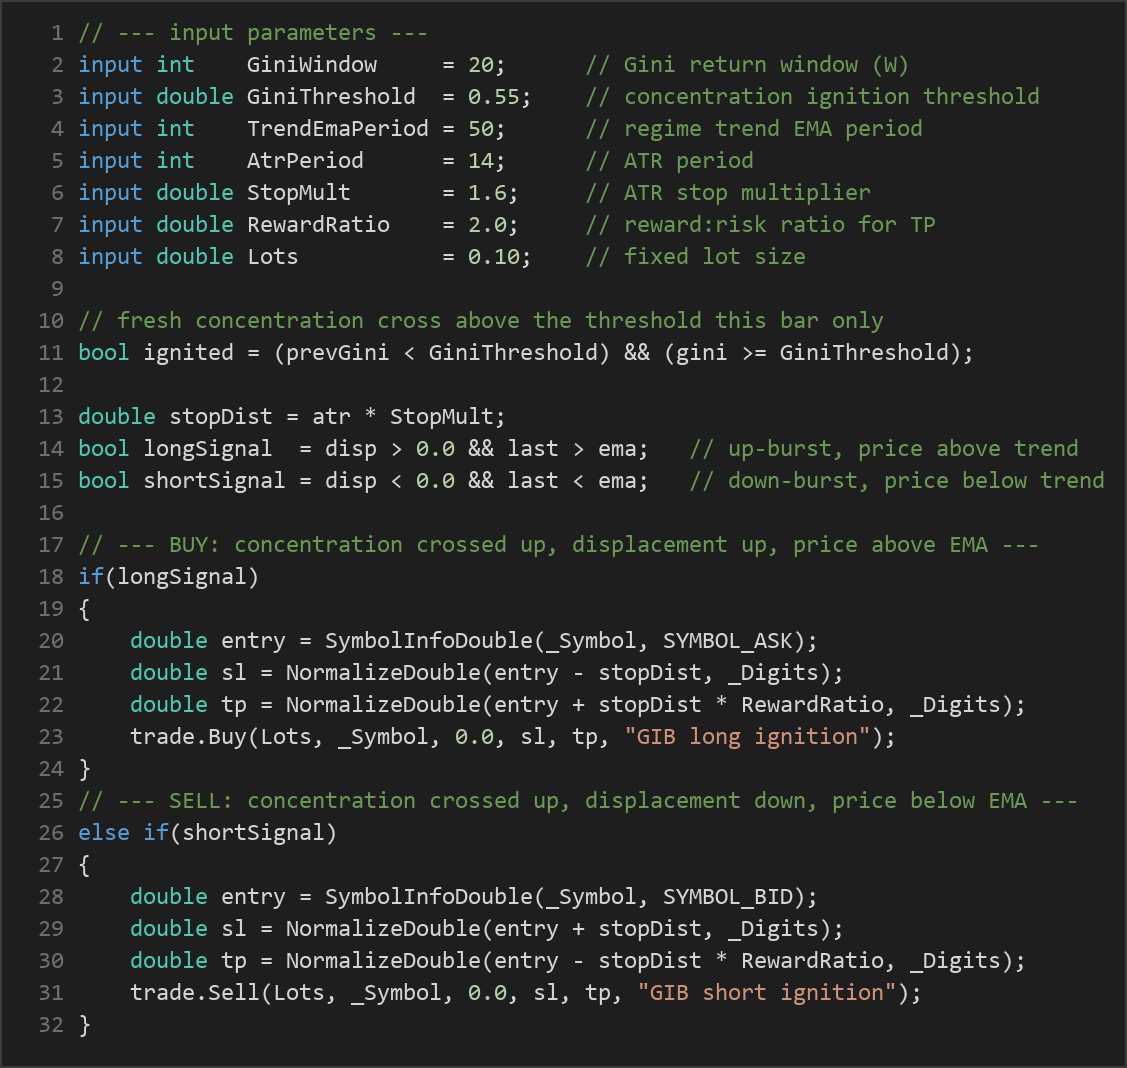
GiniThreshold— that is, the previous bar's value was below the threshold and the current bar's value is at or above it. A window that is already concentrated does not re-trigger; only the transition counts, which helps avoid acting late on an exhausted move. - Choose direction from net displacement: Once ignited, the strategy measures where the burst pushed price by comparing the most recent close to the close
GiniWindowbars earlier. A positive displacement points long; a negative displacement points short. - Confirm with the trend EMA: A trend filter using an Exponential Moving Average (EMA — a moving average that weights recent prices more heavily) acts as a regime gate. A long is only allowed when price is above the EMA; a short only when price is below it. This filters out one-off exhaustion spikes that fire against the prevailing trend.
- Long entry: The strategy signals a buy when the Gini freshly crosses the threshold, net displacement is positive, and the last close is above the trend EMA.
- Short entry: The strategy signals a sell when the Gini freshly crosses the threshold, net displacement is negative, and the last close is below the trend EMA.
- One position at a time: Only a single live position per magic number is allowed. While a trade is open, no new entries are taken, and the trade is managed by its stop and target.
- Stop-loss logic: Risk is scaled to volatility using the Average True Range (ATR — a measure of typical bar range). The stop distance is
ATR × StopMult, placed below entry for longs and above entry for shorts. - Take-profit logic: The target is set at a multiple of the stop distance,
ATR × StopMult × RewardRatio, giving a fixed reward-to-risk relationship on every trade.
Because both the stop and the target are derived from ATR, the strategy automatically widens its brackets in volatile conditions and tightens them in calm ones, rather than using fixed pip distances.
Strategy Parameters
| Parameter | Default | Min | Max | Description |
|---|---|---|---|---|
| GiniWindow | 20 | 8 | 60 | Number of recent absolute returns used to compute the Gini coefficient. Smaller values react faster; larger values smooth the concentration reading. |
| GiniThreshold | 0.55 | 0.35 | 0.80 | The concentration level that must be freshly crossed to signal an ignition. Higher values demand more extreme concentration before triggering. |
| TrendEmaPeriod | 50 | 10 | 200 | Period of the trend EMA used as the regime gate. Longer periods define a slower, broader trend context. |
| AtrPeriod | 14 | 5 | 40 | Lookback period for the ATR used to size the stop and target. |
| StopMult | 1.6 | 0.5 | 4.0 | ATR multiplier that sets the stop-loss distance from entry. |
| RewardRatio | 2.0 | 0.5 | 5.0 | Reward-to-risk ratio; the take-profit distance is this multiple of the stop distance. |
| Lots | 0.10 | 0.01 | 1.0 | Fixed trade volume in lots. Adjust to match your account size and risk tolerance. |
Recommended Chart Settings
The Gini Impulse Breakout was designed to operate on a single primary timeframe — whichever chart you attach it to — and it evaluates its logic on closed bars only. A common starting point for breakout-style systems is a major forex pair (for example EUR/USD) on an intraday timeframe such as M15 to H1, where periods of quiet consolidation are regularly punctuated by concentrated bursts.
That said, no single symbol or timeframe is universally optimal. The concentration signal, trend filter, and ATR brackets behave differently across instruments and sessions, so results will vary considerably across different market conditions. Treat any configuration as a starting hypothesis to be studied on a demo account, not a fixed recommendation.
How to Install on MetaTrader 5
- Download the .ex5 file from the link below
- Copy it to your MT5
MQL5\Expertsfolder - Restart MetaTrader 5 or refresh the Navigator panel
- Drag the EA onto a chart matching the recommended symbol and timeframe
- Configure the input parameters and enable Algo Trading
What to Consider Before Using This EA
Strengths. The core idea is intuitive and well-grounded: genuine trends are frequently born from concentrated bursts rather than uniform drift, so measuring the inequality of returns is a thoughtful way to distinguish ignition from noise. The "fresh cross" rule keeps the strategy from re-entering an already-extended move, the trend EMA gate suppresses many counter-trend spikes, and ATR-based brackets adapt risk to current volatility instead of using rigid distances. Distinct, symmetric long and short rules mean the logic is not biased to one side of the market.
Limitations. The Gini coefficient describes concentration, not direction — direction comes from a separate displacement check, so in whippy markets a burst can concentrate and then reverse, leaving the trade offside. A single, fixed threshold may ignite too often in one regime and rarely in another. Like all breakout approaches, it can suffer during choppy, range-bound phases where "ignitions" fail to follow through, producing a series of small losses. The fixed reward-to-risk target does not adapt to where natural support or resistance sits, so some trades may be stopped just short of their target or exit before a larger move completes.
Where it may underperform. Tight, low-volatility ranges with no genuine expansion, news-driven spikes that immediately mean-revert, and strongly trending instruments where displacement and the EMA disagree can all lead to missed or losing signals. As with any mechanical system, thorough forward testing across varied conditions is essential before drawing conclusions.
Risk Management Tips
Sound risk management matters more than any single indicator setting. Consider these general principles as you study the strategy:
- Risk a small, fixed fraction per trade. Many educators suggest risking no more than 1–2% of account equity on any single position, so a string of losses cannot do lasting damage.
- Size positions deliberately. Set the
Lotsvalue in relation to your stop distance and account size rather than choosing it arbitrarily. - Test on a demo account first. Run the strategy in a simulated environment long enough to understand its behavior, trade frequency, and typical losing streaks before considering real capital.
- Understand drawdown. Every strategy experiences losing periods. Know the depth and duration of drawdown you are willing to tolerate before you begin, and stop if reality diverges sharply from expectations.
- Keep expectations grounded. Backtests and demo results are learning tools, not promises. Markets change, and a configuration that worked in one period may not hold in the next.
Risk Warning
Trading foreign exchange, CFDs, and other leveraged financial instruments involves substantial risk of loss and is not suitable for all investors. The strategies and tools discussed on this page are provided for educational purposes only and do not constitute financial advice, investment recommendations, or solicitation to trade. Always consult a qualified financial adviser before making trading decisions. Past backtest performance is not indicative of future results.
Downloads
- Expert Advisor: GiniImpulseBreakout.ex5 (36 downloads)
- Source Code: GiniImpulseBreakout.mq5 (39 downloads)
- Documentation: GiniImpulseBreakout.pdf (38 downloads)