Disclaimer: This article is for educational and informational purposes only. It does not constitute financial or investment advice. Trading forex and CFDs carries significant risk of loss. Past performance of any strategy — including backtests — does not guarantee future results. Never trade with money you cannot afford to lose.
What Is This Strategy?
The Garman Klass Volatility Breakout is a volatility-ignition breakout strategy for MetaTrader 5 built around the Garman-Klass volatility estimator — a statistical measure that uses the full Open, High, Low, and Close (OHLC) of every candle to gauge how much "energy" a market is releasing. Where a simple close-to-close calculation throws away everything that happened inside a bar, and a raw high-minus-low range ignores where price opened and closed, the Garman-Klass estimator blends both, making it roughly five times more statistically efficient at reading true volatility. This strategy uses that reading to detect the exact moment a quiet market ignites into a directional move.
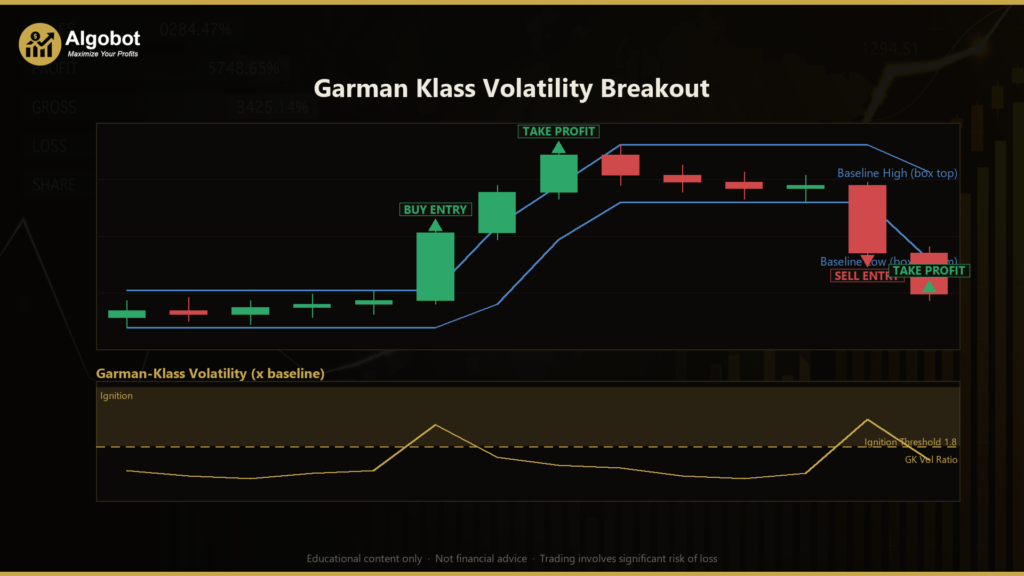
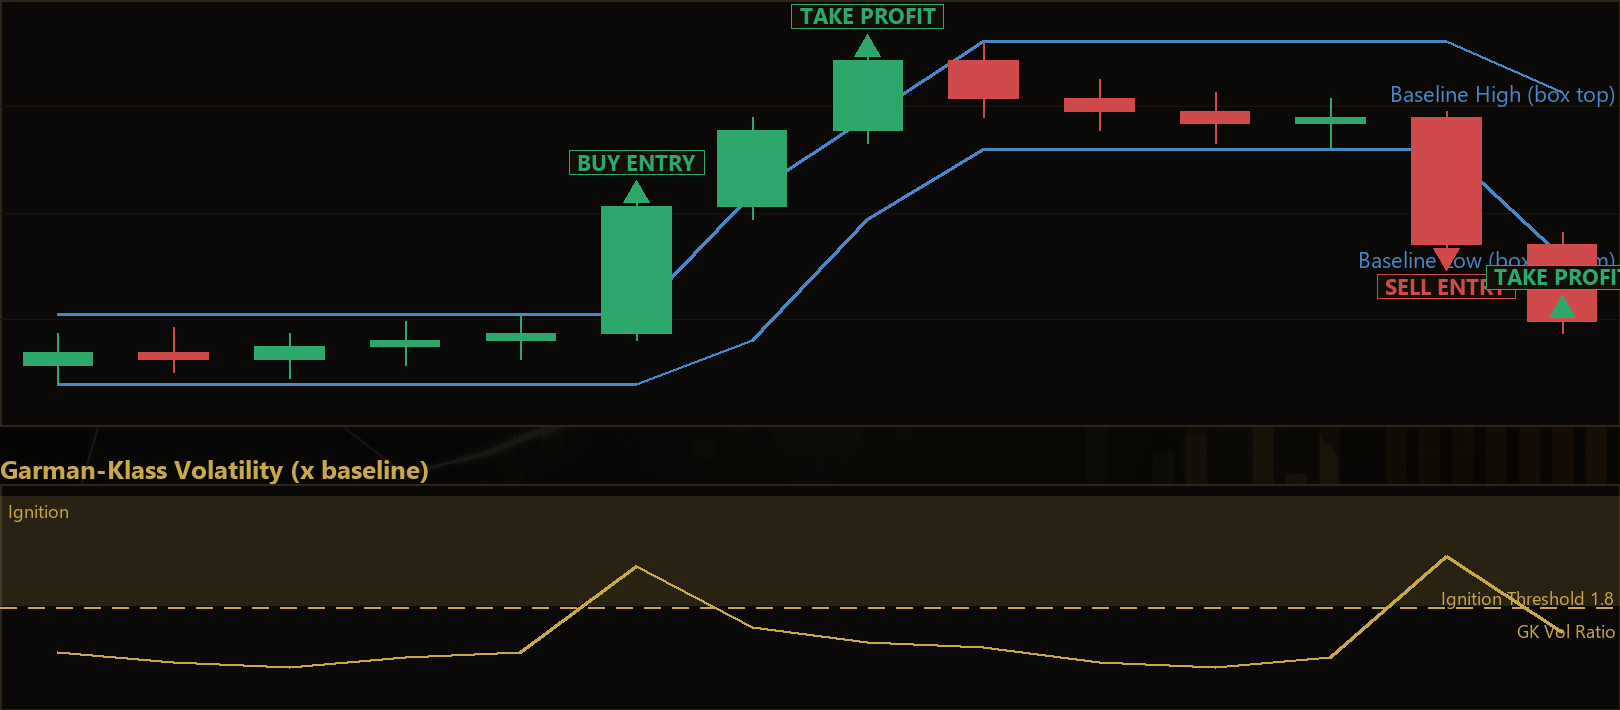
At its core, the approach is designed for one recurring market condition: a compression-then-expansion transition. Markets frequently spend long stretches trading in a narrow, low-energy range before releasing that stored tension in a sharp, directional breakout. The strategy watches for a stretch of "normal" volatility, then waits for a single candle whose Garman-Klass volatility jumps far above that baseline — a genuine expansion, not just one more noisy bar. Only when that ignition candle also breaks out of the recent price box does the strategy signal an entry.
As a learning tool, this strategy suits traders who want to understand how professional-grade volatility estimators can be turned into an objective, rule-based breakout filter. It is best studied as an example of breakout and volatility-regime analysis rather than as a shortcut to results. If you are curious about how OHLC-based volatility math, price-box breakouts, and ATR-based risk control fit together in a single automated system, this Expert Advisor (EA) offers a clean, symmetric template to study.
How It Works
The Garman Klass Volatility Breakout evaluates the market once per completed candle. It measures a volatility baseline, tests whether the newest candle "ignites," confirms direction, and then places a trade with predefined risk. Here is the step-by-step logic in plain English.
Baseline measurement (the "normal" state):
- The strategy looks back over a window of completed bars set by
BaselinePeriod(default 20), sitting directly behind the trigger candle. - Across that window it computes the root-mean-square Garman-Klass volatility — a single number representing the market's recent "normal" energy level.
- The same window also carves out a price box: the highest high (
baselineHigh) and the lowest low (baselineLow) of those bars. This box defines the range the breakout must clear.
Ignition test (the volatility spike):
- The newest completed candle (the one that just closed) becomes the trigger or ignition candle.
- Its own Garman-Klass volatility is compared to the baseline. To qualify, the trigger's volatility must reach at least
ExpansionFactortimes the baseline (default 1.8×). - This filter ensures the strategy reacts only to a genuine expansion out of the recent regime — not to a single bar of routine noise.
Directional confirmation (which way, and did it break out):
- A volatility spike alone is not enough; the candle must also be directional. The strategy measures where the candle closed within its own high-to-low range.
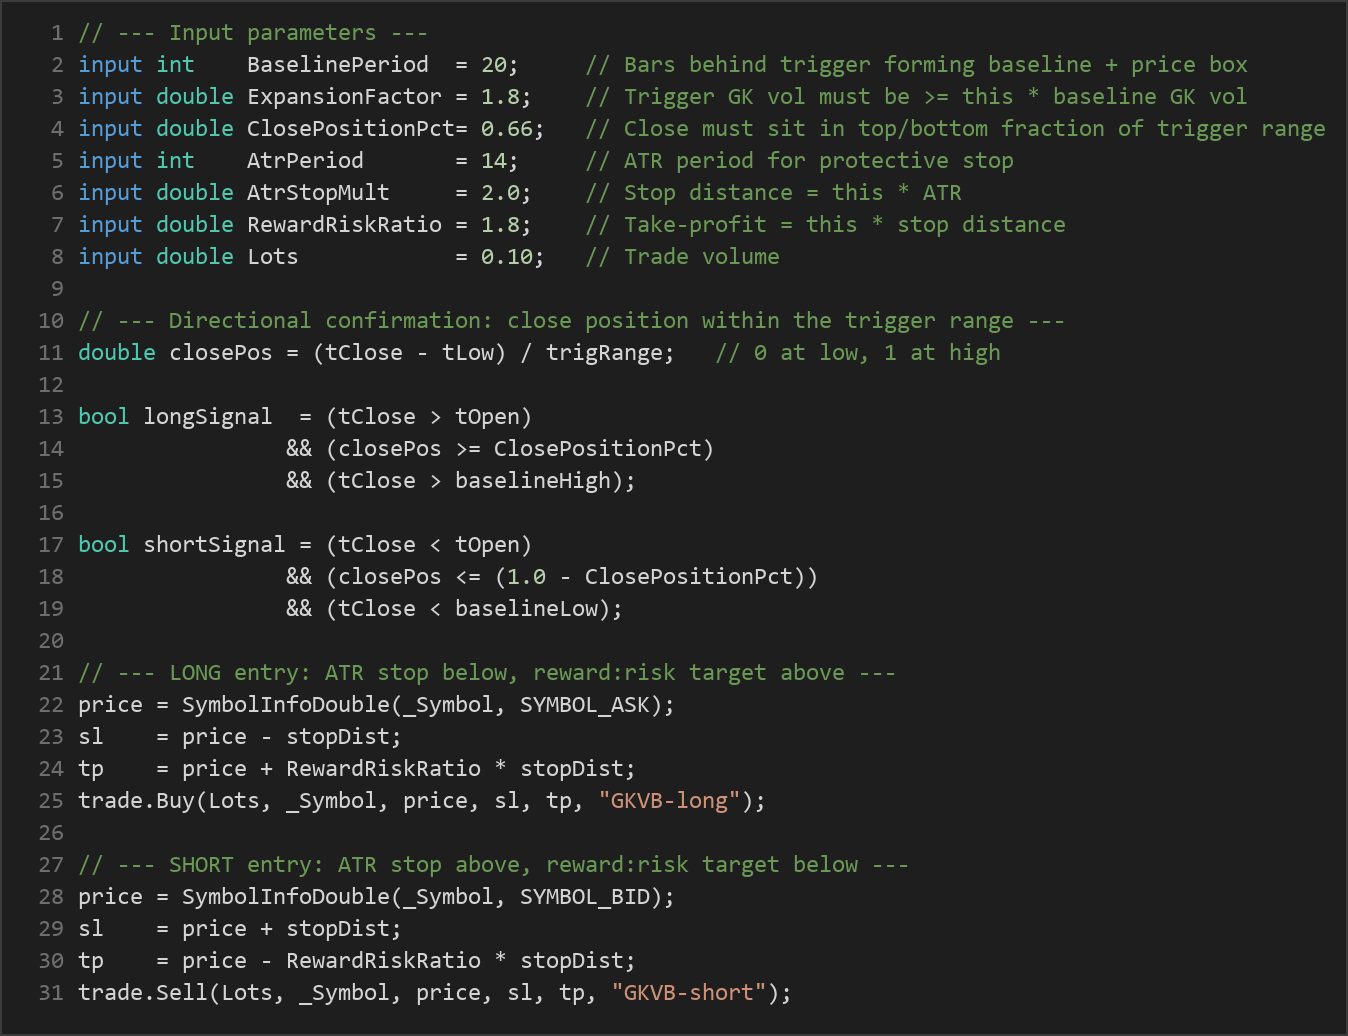
- For a long signal: the candle must close bullish (close above open), finish in the top fraction of its range as set by
ClosePositionPct(default 0.66, i.e. the top 34%), and close above the baseline box high. - For a short signal: the candle must close bearish (close below open), finish in the bottom fraction of its range, and close below the baseline box low.
- The logic is fully symmetric — the same rules apply to both sides.
Stop-loss logic:
- Risk is controlled with the Average True Range (ATR), an indicator that measures a market's typical bar-to-bar movement.
- The protective stop is placed at
AtrStopMult× ATR away from the entry price (default 2.0× ATR). Wider ATR means a wider stop, so the risk distance adapts to current conditions.
Take-profit logic:
- The target is set as a fixed reward-to-risk multiple of the stop distance, controlled by
RewardRiskRatio(default 1.8). With the defaults, the strategy risks one unit to seek 1.8 units.
Trade management:
- The strategy holds one position per magic number at a time. It will not stack new trades on top of an open one, so a fresh signal is ignored until the current position closes at its stop or target.
Strategy Parameters
| Parameter | Default | Min | Max | Description |
|---|---|---|---|---|
| BaselinePeriod | 20 | 10 | 60 | Number of completed bars behind the trigger candle used to compute the volatility baseline and the breakout price box. |
| ExpansionFactor | 1.8 | 1.2 | 3.5 | Ignition threshold: the trigger candle's Garman-Klass volatility must be at least this multiple of the baseline volatility. |
| ClosePositionPct | 0.66 | 0.50 | 0.90 | Directional confirmation: the close must sit in the top (long) or bottom (short) fraction of the trigger candle's range. |
| AtrPeriod | 14 | 7 | 30 | Number of bars used to calculate the ATR that sizes the protective stop. |
| AtrStopMult | 2.0 | 1.0 | 4.0 | Stop-loss distance as a multiple of ATR from the entry price. |
| RewardRiskRatio | 1.8 | 1.0 | 4.0 | Take-profit distance expressed as a reward-to-risk multiple of the stop distance. |
| Lots | 0.10 | 0.01 | 1.0 | Fixed trade volume in lots for each position. |
Recommended Chart Settings
This strategy is timeframe-agnostic by design — every calculation uses the chart's primary timeframe, so it runs on whatever period you attach it to. For studying breakout behavior, intraday timeframes such as the H1 (1-hour) or M15 (15-minute) charts on liquid major forex pairs (for example EUR/USD or GBP/USD) are a sensible starting point, because they produce enough compression-expansion cycles to observe the logic in action without excessive noise.
Because the Garman-Klass estimator reads OHLC energy directly, the strategy behaves differently across instruments with different volatility characteristics. A pair that trends smoothly will produce different signals than a choppy, mean-reverting one. Always remember that results will vary considerably across symbols, timeframes, and market conditions, and that any settings you study should be validated on a demo account before anything else.
How to Install on MetaTrader 5
- Download the .ex5 file from the link below
- Copy it to your MT5
MQL5\Expertsfolder - Restart MetaTrader 5 or refresh the Navigator panel
- Drag the EA onto a chart matching the recommended symbol and timeframe
- Configure the input parameters and enable Algo Trading
What to Consider Before Using This EA
Every strategy has strengths and blind spots, and studying both is the point of an exercise like this.
Strengths of this approach:
- The Garman-Klass estimator is a well-regarded, statistically efficient volatility measure, so the ignition filter is grounded in sound math rather than an arbitrary threshold.
- The triple requirement — volatility spike, directional close, and price-box break — filters out a large share of low-quality signals that a simpler breakout rule would take.
- Risk is defined before entry via an ATR stop and a fixed reward-to-risk target, which is a disciplined structure to learn from.
Known limitations:
- Breakout systems are vulnerable to false breakouts (or "fakeouts"), where price clears the box, triggers an entry, and then reverses. No filter eliminates this entirely.
- In quiet, range-bound markets with no genuine expansions, the strategy may sit idle for long periods, or take breakouts that quickly fail.
- A fixed reward-to-risk target does not adapt to a runaway trend; strong moves that continue well past the target are cut short, while the fixed lot size does not scale with account equity or volatility.
- Like all volatility-ignition logic, performance is sensitive to the
ExpansionFactorandClosePositionPctsettings — values that look ideal on past data may not carry forward.
Where it may underperform:
- Choppy, low-volatility conditions where "ignition" candles are just noise.
- News-driven spikes that expand volatility violently in both directions before settling.
- Instruments with erratic spreads, where the ATR-based stop may be too tight relative to execution costs.
Study this EA as an analytical template. It historically signals on a specific, recognizable market transition — it is not a set-and-forget solution, and it should never be treated as one.
Risk Management Tips
Sound risk management matters far more than any single entry rule. As you study this or any strategy, keep these principles in mind:
- Risk a small, fixed percentage per trade. A common educational guideline is to risk no more than 1–2% of account equity on any single position. The default fixed
Lotsvalue does not do this automatically, so size your trades deliberately relative to your stop distance and account balance. - Always test on a demo account first. Run the strategy in a risk-free simulated environment for an extended period before considering anything else. This is how you learn its behavior without exposure.
- Understand drawdown. Every strategy experiences losing streaks. Know the maximum peak-to-trough decline you are prepared to tolerate, and study how the strategy behaves through its worst stretches, not just its best.
- Do not over-optimize. Tuning parameters until past results look perfect ("curve-fitting") tends to produce settings that fail going forward. Prefer robust, moderate settings that work across a range of conditions.
- Account for costs. Spreads, commissions, and slippage all erode breakout entries in particular. Factor them into any evaluation.
- Never trade money you cannot afford to lose, and treat automated trading as a tool that requires ongoing supervision, not a substitute for it.
Risk Warning
Trading foreign exchange, CFDs, and other leveraged financial instruments involves substantial risk of loss and is not suitable for all investors. The strategies and tools discussed on this page are provided for educational purposes only and do not constitute financial advice, investment recommendations, or solicitation to trade. Always consult a qualified financial adviser before making trading decisions. Past backtest performance is not indicative of future results.
Downloads
- Expert Advisor: GarmanKlassVolatilityBreakout.ex5 (48 downloads)
- Source Code: GarmanKlassVolatilityBreakout.mq5 (42 downloads)
- Documentation: GarmanKlassVolatilityBreakout.pdf (47 downloads)