Disclaimer: This article is for educational and informational purposes only. It does not constitute financial or investment advice. Trading forex and CFDs carries significant risk of loss. Past performance of any strategy — including backtests — does not guarantee future results. Never trade with money you cannot afford to lose.
What Is This Strategy?
Fractional Differential Momentum is a regime-following trading strategy built around fractional differencing, a signal-processing transform borrowed from long-memory time-series analysis (popularised by Marcos López de Prado). Despite the word "fractional," it has nothing to do with fractals or FRAMA-style indicators. Instead, it addresses a subtle but well-known problem in quantitative finance: a raw price series is non-stationary (it trends and wanders, so its statistical properties drift over time), while the usual fix — taking a first difference to get returns — produces a stationary but memoryless series that discards the very trend information a momentum trader wants to keep.
Fractional differencing sits between those two extremes. By differencing the close series to a real-valued order d somewhere between 0 and 1, the strategy produces a series that is stationary enough to compare across time, yet still retains long memory of the underlying trend. The resulting value, which we'll call the FD reading, behaves like a memory-weighted displacement of price from its own recent past: a positive FD reflects accumulated upward pressure, and a negative FD reflects accumulated downward pressure. The reading is then normalised by the Average True Range (ATR — a standard measure of recent volatility) so that thresholds mean the same thing whether the market is calm or fast.
This is a trend/regime-following approach designed for markets that develop and sustain directional moves rather than chop sideways. As a learning tool, it is well suited to intermediate traders who already understand momentum, volatility normalisation, and stop/target mechanics, and who want to explore a more advanced, research-grade way of measuring trend persistence. It is best studied as a case study in indicator design — not as a shortcut to returns.
How It Works
The strategy evaluates its logic once per closed bar, using the fractional-difference weights that are precomputed a single time from the order d and the Window length. Each condition is described in plain English below.
- Building the FD reading: For each closed bar, the strategy multiplies the most recent
Windowcloses by the precomputed fractional-difference weights and sums them. Because those weights nearly sum to zero across the window, the result measures how far price has been pushed away from its long-memory baseline. - Volatility normalisation: The FD reading is divided by ATR, producing a scale-free
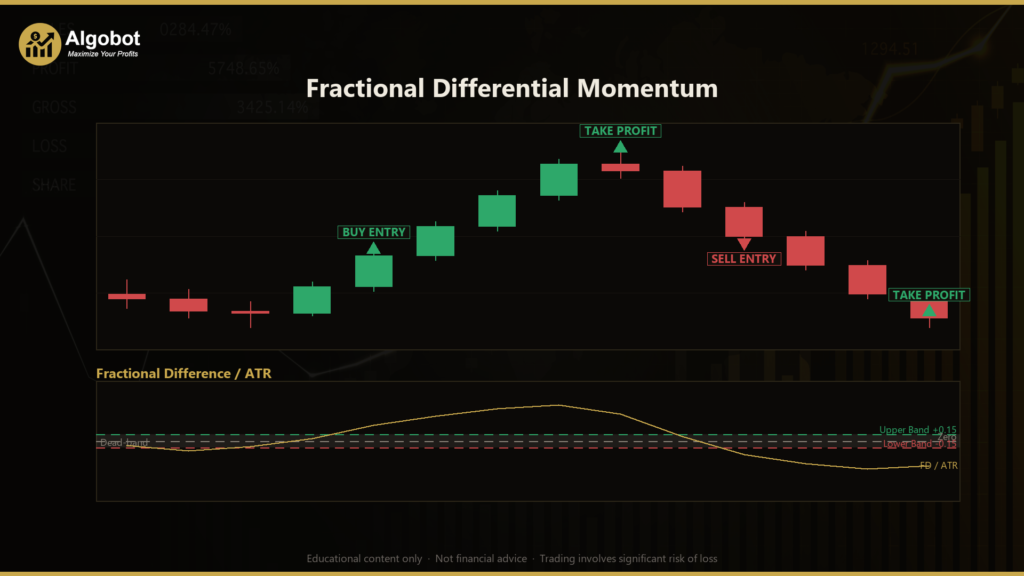
FD/ATRvalue. A small dead-band around zero (BandMult × ATR) filters out insignificant wobble so the strategy only reacts to meaningful displacement. - Long entry — the strategy signals a bullish regime when:
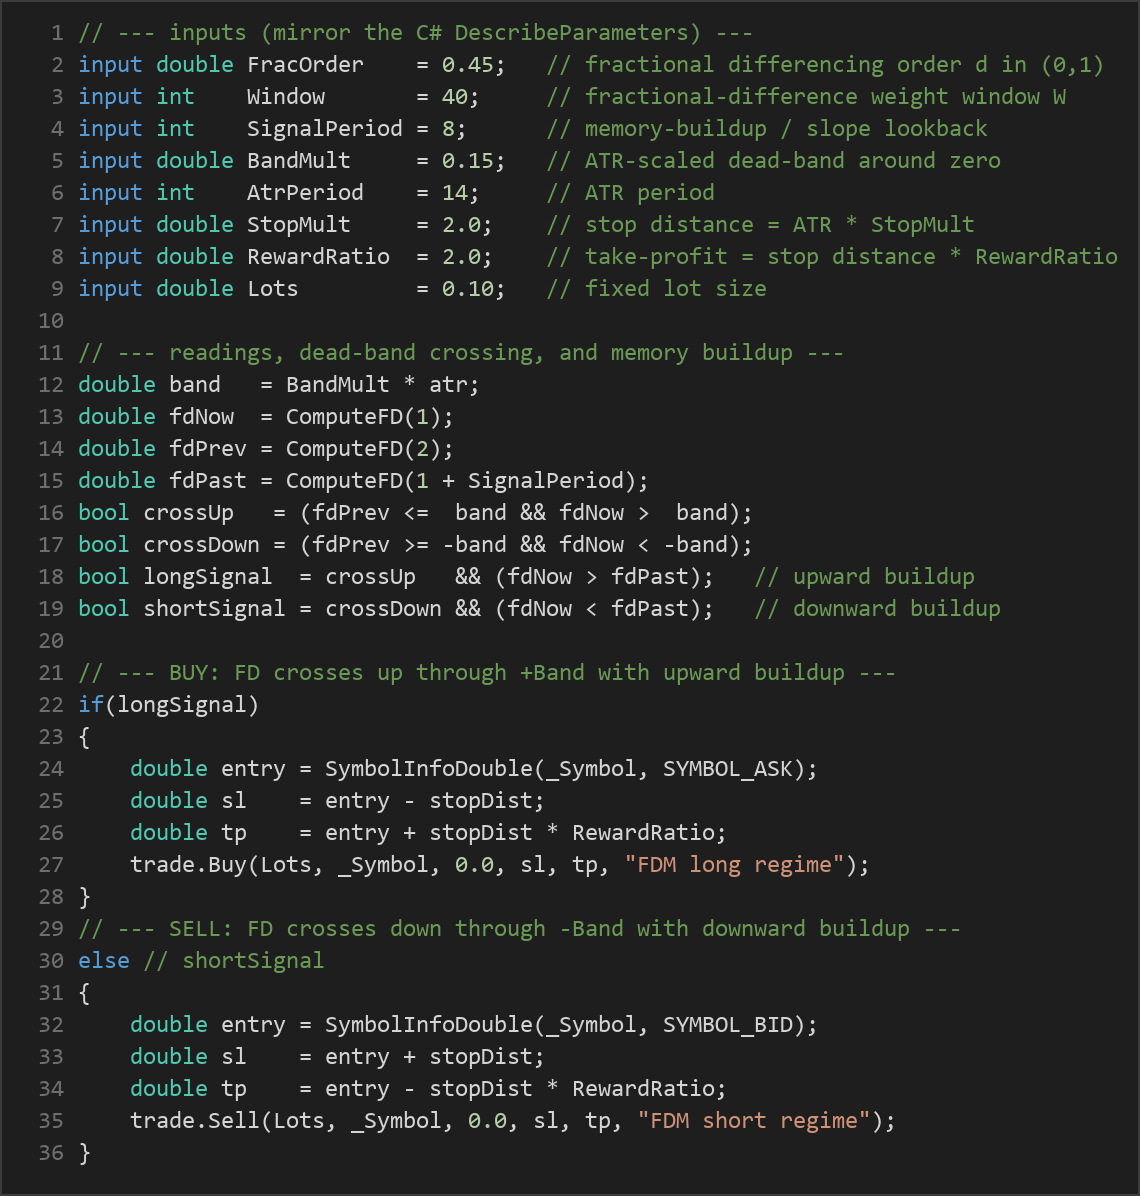
FD/ATRcrosses up through the+Bandthreshold (a fresh crossing, not a value already sitting above it), and the FD series has been rising over the lastSignalPeriodbars. The second condition confirms a genuine memory buildup rather than a one-bar flicker. - Short entry — the strategy signals a bearish regime when:
FD/ATRcrosses down through the-Bandthreshold, and the FD series has been falling over the lastSignalPeriodbars. - Reverse on regime change: An opposite crossing is treated as invalidation of the current regime. If a long position is open and a short signal fires, the strategy closes the long and opens a short (and vice versa), so it is always aligned with the most recent confirmed regime.
- Stop-loss: Each trade is protected with a stop placed
StopMult × ATRaway from entry. Because the stop scales with volatility, it widens in fast markets and tightens in quiet ones. - Take-profit: The target is set at the stop distance multiplied by
RewardRatio. With the defaults, this produces a 2:1 reward-to-risk target relative to the initial stop.
In short, the strategy waits for the fractional-difference reading to break decisively out of its dead-band in the same direction it has already been building, then rides that regime with an ATR-based stop and target until the opposite signal flips it.

Strategy Parameters
| Parameter | Default | Min | Max | Description |
|---|---|---|---|---|
| FracOrder | 0.45 | 0.10 | 0.90 | The fractional differencing order d. Lower values keep more long memory (closer to raw price); higher values behave more like ordinary returns. |
| Window | 40 | 15 | 120 | Number of past closes used to compute each fractional-difference reading (the weight window length). |
| SignalPeriod | 8 | 2 | 30 | Lookback for the memory-buildup / slope filter; how many bars the FD series must have been trending in the signal direction. |
| BandMult | 0.15 | 0.00 | 1.50 | Width of the ATR-scaled dead-band around zero. Larger values demand a bigger displacement before a crossing counts. |
| AtrPeriod | 14 | 5 | 50 | Period of the ATR used for normalisation and for sizing stops and targets. |
| StopMult | 2.0 | 0.5 | 5.0 | Stop-loss distance as a multiple of ATR. |
| RewardRatio | 2.0 | 0.5 | 5.0 | Take-profit distance as a multiple of the stop distance (reward-to-risk ratio). |
| Lots | 0.10 | 0.01 | 1.0 | Fixed trade size in lots. |
Recommended Chart Settings
Fractional Differential Momentum was designed and tuned around a liquid major forex pair on an intraday-to-swing timeframe, such as H1 (1-hour) charts, where directional regimes are common enough to give the transform something to track while avoiding the extreme noise of very small timeframes. Because ATR normalisation is built in, the strategy adapts to different volatility levels without manual retuning of thresholds.
That said, no single symbol or timeframe is universally optimal. The default parameters are a starting point for study, not a finished configuration. Different instruments, sessions, and market conditions will produce very different behaviour, so always test on the specific symbol and timeframe you intend to analyse.
How to Install on MetaTrader 5
- Download the
FractionalDifferentialMomentum.ex5file from the link below. - Copy it to your MT5
MQL5\Expertsfolder. - Restart MetaTrader 5 or refresh the Navigator panel.
- Drag the EA onto a chart matching the recommended symbol and timeframe.
- Configure the input parameters and enable Algo Trading.
What to Consider Before Using This EA
The main strength of this approach is conceptual: fractional differencing is a principled attempt to keep a trend signal stationary and comparable over time while preserving long memory — something a plain moving average or raw returns series cannot do as cleanly. Pairing that reading with ATR normalisation, a dead-band, and a same-direction buildup filter is a thoughtful way to reduce false regime flips. For a student of quantitative methods, the code is a compact, readable example of how a research idea translates into an executable rule set.
The limitations are equally important to understand. Like all trend- and regime-following systems, it is prone to whipsaws in ranging or choppy markets, where FD may repeatedly cross the dead-band without a lasting move, generating losing reversals. The reading is sensitive to the choice of FracOrder and Window: too much memory can make it lag, too little can make it noisy, and aggressive optimisation risks curve-fitting to past data that may not repeat. The always-in-the-market reverse-on-signal logic means there is no flat "wait and see" state — it holds a position in whichever regime last triggered. Finally, real-world factors such as spread, slippage, and swap can meaningfully affect results, especially on shorter timeframes. Treat this EA as a framework for learning about long-memory indicators, and validate every assumption yourself.
Risk Management Tips
- Size positions conservatively. A common educational guideline is to risk no more than 1–2% of account equity on any single trade. Use the ATR-based stop distance to work backwards to an appropriate lot size rather than trading a fixed lot blindly.
- Test on a demo account first. Run the strategy on a demo or simulated environment until you understand how it behaves across trending, ranging, and volatile conditions.
- Understand drawdown. Even a well-constructed strategy will experience losing streaks. Know the maximum drawdown you are willing to tolerate before you deploy anything, and stop if it is exceeded.
- Don't over-optimise. Parameters that look perfect on historical data often fail forward. Prefer robust settings that work reasonably across a range of conditions over ones that are perfectly tuned to the past.
- Only risk capital you can afford to lose, and never let a single strategy or trade jeopardise your overall financial wellbeing.
Risk Warning
Trading foreign exchange, CFDs, and other leveraged financial instruments involves substantial risk of loss and is not suitable for all investors. The strategies and tools discussed on this page are provided for educational purposes only and do not constitute financial advice, investment recommendations, or solicitation to trade. Always consult a qualified financial adviser before making trading decisions. Past backtest performance is not indicative of future results.
Downloads
- Expert Advisor: FractionalDifferentialMomentum.ex5 (23 downloads)
- Source Code: FractionalDifferentialMomentum.mq5 (23 downloads)
- Documentation: FractionalDifferentialMomentum.pdf (27 downloads)