Disclaimer: This article is for educational and informational purposes only. It does not constitute financial or investment advice. Trading forex and CFDs carries significant risk of loss. Past performance of any strategy — including backtests — does not guarantee future results. Never trade with money you cannot afford to lose.
What Is This Strategy?
The Failed Auction Reversal strategy is a pure price-action, counter-trend system that fades failed breakouts at the edges of a recent trading range. It uses no technical indicators at all — no moving averages, no oscillators, no momentum tools. Instead, every decision is built from raw candlestick geometry (the open, high, low, and close of individual bars) measured against a recent swing window. In market-profile language, a "failed auction" is the cleanest sign that a directional push has run out of willing participants: price probes to a fresh new extreme, gets rejected, and snaps back inside the range it just broke.
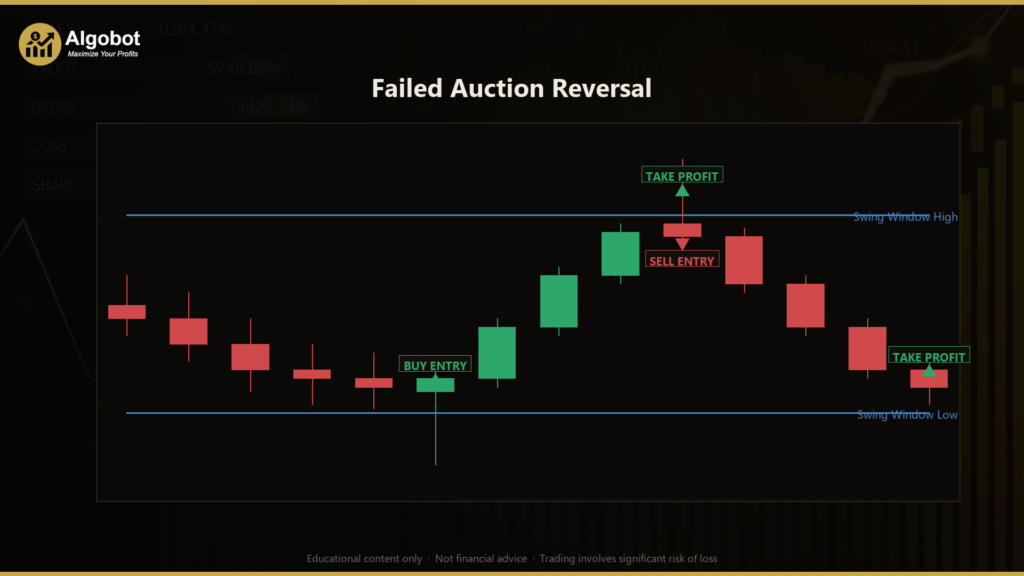
The pattern this strategy hunts for is specific. On a single candle, price pushes beyond the highest high (or lowest low) of the previous N bars — a genuine breakout probe — but then closes back through the level it just broke, finishing on the wrong side of that level and parked in the far end of its own range. When that happens to the upside, the breakout buyers are trapped and the path of least resistance flips lower, so the strategy signals a short. When it happens to the downside, it is the exact mirror, and the strategy signals a long.
This system is designed as a learning tool for traders who want to study reversal price action, support and resistance, and the mechanics of failed breakouts without the noise of lagging indicators. It is best suited to liquid instruments such as EUR/USD or XAU/USD (gold) on the M30 (30-minute) timeframe. Because it is a counter-trend reversal approach, it is intended to illustrate how structured entry and exit rules can be expressed in plain candle geometry — not as a shortcut to any particular outcome.
How It Works
The Failed Auction Reversal strategy evaluates one freshly closed candle at a time (it acts only once per new bar). The most recently closed candle is the "signal bar," and the lookback window is the block of bars before it. Here is how the logic flows:
- Build the swing window. The strategy scans the prior
Lookbackbars (the structure that came before the signal bar) to find the highest high and lowest low. This defines the recent range — the "auction" zone of accepted prices. - Measure the window height. The distance between that prior high and prior low becomes the reference scale. The minimum probe distance is
PenetrationFrac× window height, so a breakout has to be meaningful rather than a single trivial tick.
The strategy signals a short (failed upside auction) when all of these are true:
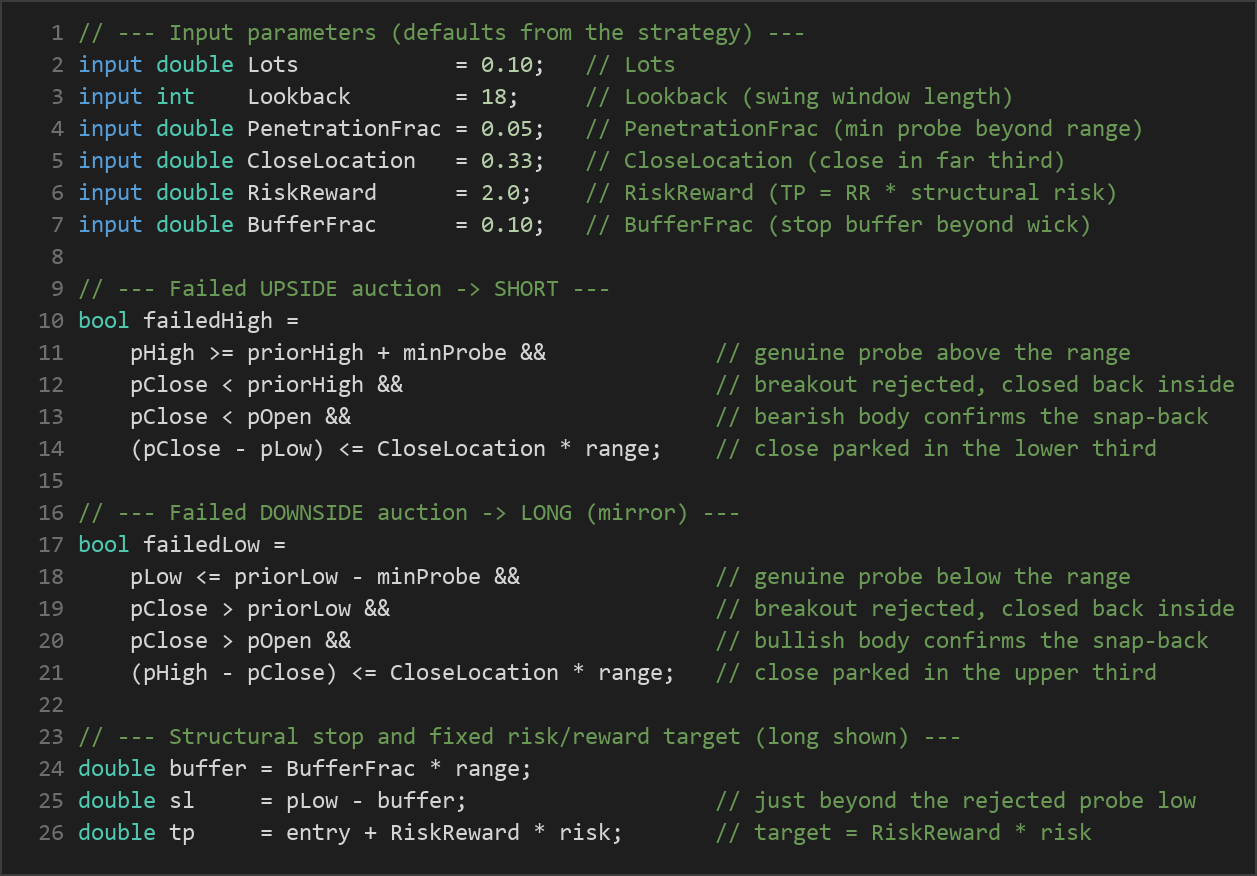
- The signal bar's high pushes above the prior window high by at least the minimum probe distance — a real attempt to break resistance.
- The signal bar's close falls back below that prior window high — the breakout was rejected and price closed back inside the old range.
- The candle has a bearish body (close below open) — confirming the snap-back.
- The close sits in the lower portion of the bar's own range, within
CloseLocationof the low — a decisive rejection rather than a weak one.
The strategy signals a long (failed downside auction) when the exact mirror is true: price probes below the prior window low by the minimum distance, closes back above that low, prints a bullish body (close above open), and finishes in the upper portion of its range.
Stop-loss logic: The stop is placed just beyond the rejected wick — the level where the trade idea is proven wrong. For a long, the stop sits below the signal bar's low minus a buffer; for a short, it sits above the signal bar's high plus a buffer. The buffer is BufferFrac × the bar's range, giving a small cushion past the extreme.
Take-profit logic: The target is a fixed multiple of the structural risk. The strategy measures the distance from entry to the stop, then projects the take-profit at RiskReward times that distance in the favorable direction. So with the default risk/reward of 2.0, the target is twice the stop distance away.
The strategy holds only one position at a time per its magic number, so it will not stack multiple trades on the same symbol.
Strategy Parameters
| Parameter | Default | Min | Max | Description |
|---|---|---|---|---|
| Lots | 0.10 | 0.01 | 1.00 | Fixed trade size in lots for each position the strategy opens. |
| Lookback | 18 | 6 | 60 | Number of bars in the prior swing window used to define the recent range (highest high and lowest low). |
| PenetrationFrac | 0.05 | 0.00 | 0.40 | Minimum probe beyond the range, as a fraction of the window height, required to count as a genuine breakout. |
| CloseLocation | 0.33 | 0.15 | 0.50 | How far into the far third of the bar's range the close must sit, confirming a decisive snap-back. |
| RiskReward | 2.0 | 1.0 | 5.0 | Take-profit multiple: the target is this many times the structural stop distance. |
| BufferFrac | 0.10 | 0.00 | 1.00 | Stop buffer placed just beyond the rejected wick, as a fraction of the signal bar's range. |
Recommended Chart Settings
This strategy was designed and described for EUR/USD or XAU/USD (gold) on the M30 (30-minute) timeframe, though the logic is symbol- and timeframe-agnostic and can be applied to any liquid instrument. The 30-minute chart is liquid enough to produce clean swing structure while still generating a workable number of signals for study.
Keep in mind that range behavior, volatility, and the frequency of failed breakouts vary widely across instruments and across market conditions. A setting that produces clean signals on gold may behave very differently on a major currency pair, and the same symbol can shift between trending and ranging regimes over time. Treat the recommended settings as a starting point for your own testing rather than a fixed prescription, and re-evaluate the parameters whenever you move to a new symbol or timeframe.
How to Install on MetaTrader 5
- Download the .ex5 file from the link below
- Copy it to your MT5
MQL5\Expertsfolder - Restart MetaTrader 5 or refresh the Navigator panel
- Drag the EA onto a chart matching the recommended symbol and timeframe
- Configure the input parameters and enable Algo Trading
What to Consider Before Using This EA
The main strength of the Failed Auction Reversal approach is its transparency. Because it uses no indicators, there is nothing hidden or lagging — every condition is a measurable property of the candles on your screen, which makes it an excellent tool for learning to read reversal price action and to think in terms of structure and rejection rather than indicator crossovers. The fixed structural stop and risk/reward target also teach disciplined trade construction: the stop is anchored to where the idea is invalidated, and the target is a defined multiple of that risk.
There are real limitations to understand, though. Counter-trend reversal strategies fade momentum by design, which means they can struggle badly in strong, persistent trends — a "failed" breakout can become a real one, and price that probes a new high may simply keep going. The strategy may underperform in low-volatility, choppy conditions where breakouts and rejections happen constantly without follow-through, producing whipsaw signals. It also takes only one trade at a time and waits for a fairly specific candle geometry, so signals can be infrequent on some symbols. Slippage, spread, and the exact fill price matter more for tight structural stops than for wide ones. None of these are reasons to avoid studying the strategy — they are exactly the conditions you should observe and document while testing.
Risk Management Tips
Sound risk management matters far more than any single entry signal. As a general educational framework, many traders never risk more than 1–2% of account equity on a single trade, and they size their positions accordingly rather than using a fixed lot size blindly — the default Lots value here is a placeholder, not a recommendation for your account. Before considering any live use, run the strategy on a demo account for an extended period so you can observe how it behaves across different market conditions, including trending and ranging phases.
Pay close attention to drawdown — the peak-to-trough decline in account equity — because even a logically sound strategy will go through losing streaks, and understanding the depth and duration of those streaks is essential to deciding whether you could tolerate them. Keep a trading journal, test parameter changes one at a time, and avoid over-optimizing settings to fit past data. Risk management is the part of trading you can actually control; the market outcome is not.
Risk Warning
Trading foreign exchange, CFDs, and other leveraged financial instruments involves substantial risk of loss and is not suitable for all investors. The strategies and tools discussed on this page are provided for educational purposes only and do not constitute financial advice, investment recommendations, or solicitation to trade. Always consult a qualified financial adviser before making trading decisions. Past backtest performance is not indicative of future results.
Downloads
- Expert Advisor: FailedAuctionReversal.ex5 (42 downloads)
- Source Code: FailedAuctionReversal.mq5 (44 downloads)
- Documentation: FailedAuctionReversal.pdf (42 downloads)