Disclaimer: This article is for educational and informational purposes only. It does not constitute financial or investment advice. Trading forex and CFDs carries significant risk of loss. Past performance of any strategy — including backtests — does not guarantee future results. Never trade with money you cannot afford to lose.
What Is This Strategy?
The Ema Ribbon Expansion Breakout is a trend-ignition strategy built around a three-line EMA ribbon (Exponential Moving Average — a moving average that weights recent prices more heavily than older ones) combined with the ATR (Average True Range, a measure of how much price typically moves in a bar). It is designed to identify the precise moment a quiet, range-bound market transitions into a committed directional trend, making it a study in volatility expansion trading rather than simple crossover trading.
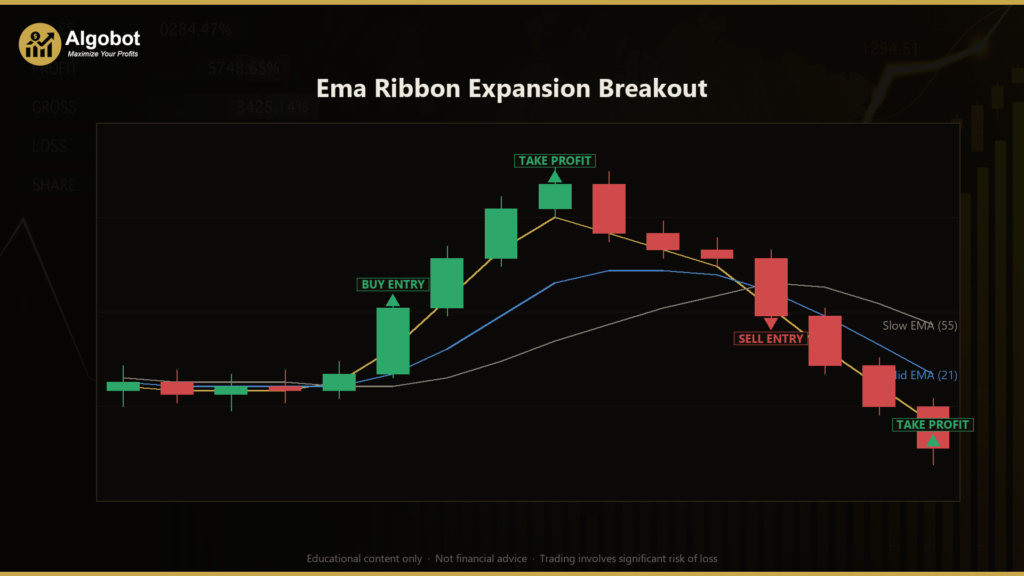
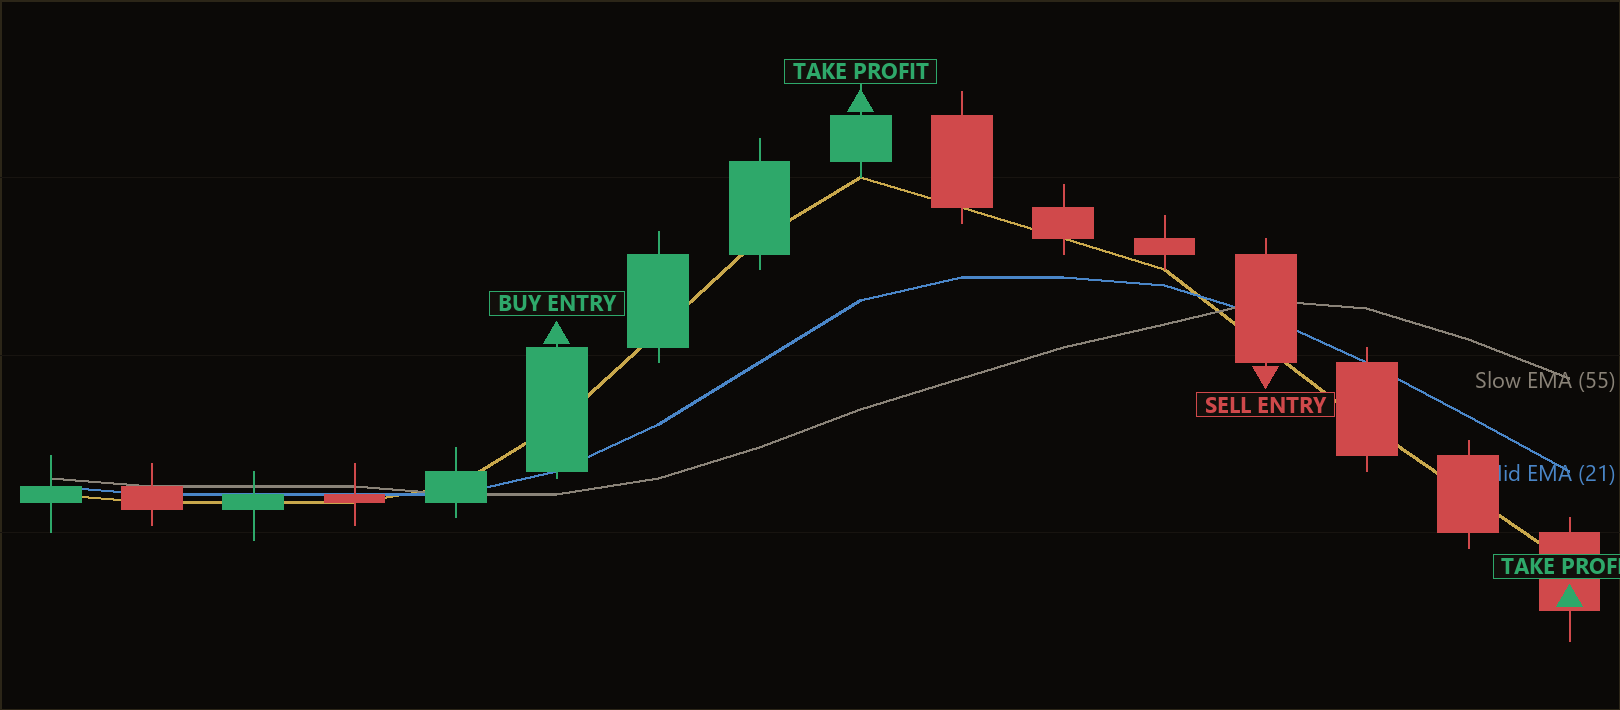
The core idea is straightforward to grasp but nuanced in execution. When the fast, mid, and slow EMAs coil tightly together — a "compressed" ribbon — the market is balanced and often choppy, offering little tradeable edge. When that coil releases and the three EMAs fan out in order, momentum is being committed in one direction. The strategy treats that fresh expansion out of compression as the ignition point of a potential trend. It is a directional, breakout-style approach that trades both long and short with symmetric logic.
As a learning tool, this strategy is well suited to intermediate traders who already understand moving averages and want to explore how volatility context can filter breakout signals. It demonstrates several concepts worth studying: multi-condition confirmation, volatility-normalised thresholds, and structured trade management. It is not a "set and forget" system, and it is presented here for analysis and education — not as a profit opportunity.
How It Works
The strategy evaluates its rules only on closed bars of the primary timeframe, which helps avoid acting on incomplete, still-forming candles. Every entry requires three independent conditions to line up at the same time, which is what makes it selective.
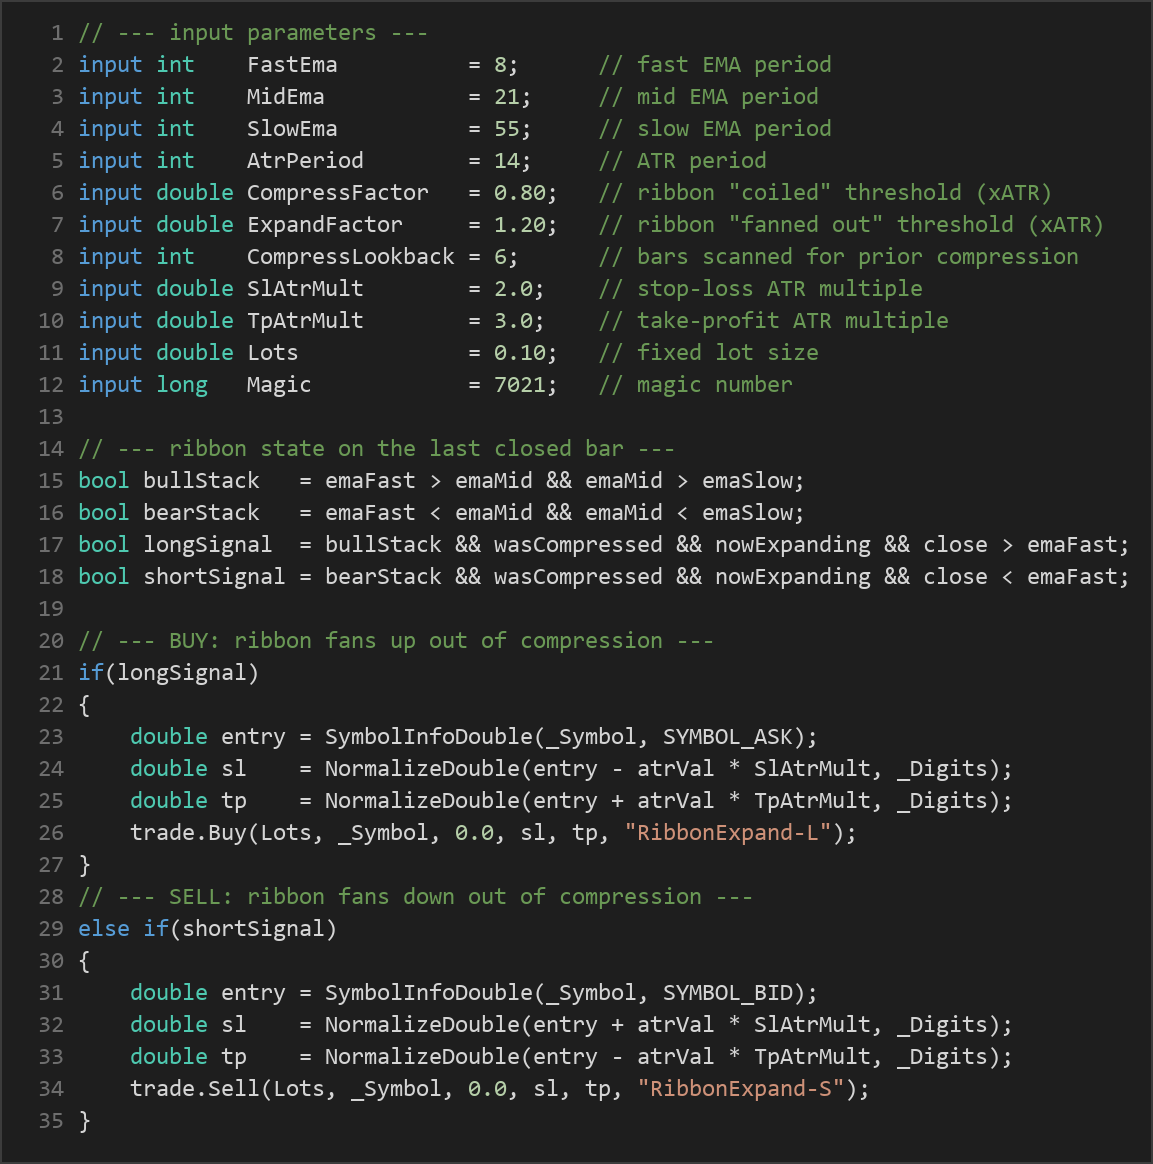
- Condition 1 — Ribbon alignment (stack). For a long, the fast EMA must be above the mid EMA, which must be above the slow EMA (fast > mid > slow). For a short, the order is mirrored (fast < mid < slow). This confirms the ribbon is fanned out in order, not tangled.
- Condition 2 — Prior compression. The ribbon width (the distance between the fast and slow EMA) must have been narrow recently — specifically, smaller than
CompressFactor × ATRat some point within the lastCompressLookbackclosed bars. This confirms the market was genuinely coiled before the move, filtering out signals that appear in already-extended trends. - Condition 3 — Fresh expansion and thrust. The ribbon must be widening on the current bar (its width is greater than on the prior bar) and be meaningfully wide, exceeding
ExpandFactor × ATR. On top of that, the bar must close beyond the fast EMA in the trade's direction (above it for longs, below it for shorts). This is the "thrust" that shows price is leading the move, not just the averages drifting apart.
When all three align, the strategy signals an entry:
- A long signal fires when the ribbon is bullishly stacked, was recently compressed, is now expanding, and price closes above the fast EMA.
- A short signal fires under the mirror-image conditions.
Stop-loss and take-profit logic are both derived from the ATR, so risk scales with current volatility rather than being fixed in pips:
- For longs, the stop-loss is placed
SlAtrMult × ATRbelow entry and the take-profitTpAtrMult × ATRabove entry. - For shorts, the distances are mirrored around the entry price.
- With the default settings (stop at 2.0× ATR, target at 3.0× ATR), the strategy aims for a reward-to-risk ratio of roughly 1.5 to 1 on each trade — though actual outcomes vary with market behaviour.
Trade management keeps things simple: only one position per magic number is allowed at a time, so the strategy never stacks trades on the same signal. There is also an early-exit rule — if the ribbon flips its stack against an open position (for example, the ribbon turns bearish while a long is running), the strategy closes that position rather than waiting for the stop. This may indicate the original trend thesis has broken down.
Strategy Parameters
| Parameter | Default | Min | Max | Description |
|---|---|---|---|---|
| FastEma | 8 | 3 | 20 | Period of the fast EMA — the most responsive line in the ribbon. |
| MidEma | 21 | 10 | 45 | Period of the middle EMA, used to confirm stack order. |
| SlowEma | 55 | 30 | 120 | Period of the slow EMA — the ribbon's trend anchor. |
| AtrPeriod | 14 | 5 | 30 | Lookback for the ATR used to size compression, expansion, and risk. |
| CompressFactor | 0.80 | 0.30 | 2.0 | Ribbon is "coiled" when its width is below this multiple of ATR. |
| ExpandFactor | 1.20 | 0.50 | 3.0 | Ribbon is "fanned out" when its width exceeds this multiple of ATR. |
| CompressLookback | 6 | 3 | 20 | Number of prior closed bars scanned for a compression event. |
| SlAtrMult | 2.0 | 0.50 | 5.0 | Stop-loss distance as a multiple of ATR. |
| TpAtrMult | 3.0 | 1.0 | 8.0 | Take-profit distance as a multiple of ATR. |
| Lots | 0.10 | 0.01 | 1.0 | Fixed trade volume in lots. |
Recommended Chart Settings
The default EMA periods (8 / 21 / 55) and a 14-period ATR are classic swing-trend settings that historically suit intermediate timeframes such as the H1 (1-hour) or H4 (4-hour) charts on liquid instruments — major forex pairs like EUR/USD or GBP/USD, or an index CFD. These timeframes give the ribbon enough room to genuinely compress and expand without reacting to every minor tick.
That said, no single symbol or timeframe is universally "correct." The volatility-normalised design means the same logic can be applied across markets, but the character of compressions and expansions differs between assets and sessions. Results will vary across different market conditions, and any timeframe or symbol should be studied on a demo account before it is trusted.
How to Install on MetaTrader 5
- Download the .ex5 file from the link below
- Copy it to your MT5
MQL5\Expertsfolder - Restart MetaTrader 5 or refresh the Navigator panel
- Drag the EA onto a chart matching the recommended symbol and timeframe
- Configure the input parameters and enable Algo Trading
What to Consider Before Using This EA
Every strategy has trade-offs, and an honest assessment helps you learn more than a sales pitch would.
Strengths of this approach:
- Context-aware entries. By requiring prior compression and fresh expansion, the strategy avoids many late-trend chases that catch traders who enter on alignment alone.
- Volatility normalisation. Because thresholds and risk are all expressed in ATR multiples, the logic adapts to quiet and busy markets rather than using rigid pip values.
- Built-in defence. The one-position rule and the ribbon-flip early exit impose discipline and cap exposure to a single idea at a time.
Known limitations:
- Whipsaw in choppy ranges. Breakout systems can struggle when a market repeatedly coils and fakes a breakout. A ribbon can expand just enough to trigger an entry, then collapse back — producing a loss.
- Lag from EMAs. Moving averages are inherently backward-looking. By the time the ribbon fans out, part of the initial move may already have happened, which can lead to entries later than the ideal point.
- Fixed lot sizing. The default uses a constant lot size rather than scaling to account equity, so risk per trade does not automatically adjust as the balance changes.
- Parameter sensitivity. Compression and expansion factors that work in one regime may need re-tuning in another. Over-optimising them to past data (curve-fitting) can produce results that historically look strong but generalise poorly.
The strategy may underperform in low-volatility, sideways markets and during major news shocks where price gaps straight through ATR-based stops. Treat it as one tool for studying volatility breakouts, not as a complete trading plan.
Risk Management Tips
Sound risk management matters far more than any single entry signal. Consider these general principles as you study this or any strategy:
- Risk a small, fixed fraction per trade. Many educators suggest risking no more than 1–2% of account equity on any single position. Size your lots so that a stop-loss hit stays within that limit rather than using the default lot blindly.
- Test on a demo account first. Run the EA on a risk-free demo for an extended period across different market conditions before ever considering real capital. This is where you learn how the strategy behaves, not just how it looks.
- Understand drawdown. Even a well-designed strategy will string together losing trades. Know the maximum losing streak you can tolerate emotionally and financially, and study historical drawdown before committing.
- Never over-leverage. Leverage magnifies both gains and losses. Keeping leverage modest is one of the simplest ways to survive long enough to learn.
- Keep a trading journal. Recording why each trade triggered and how it resolved turns raw results into genuine understanding.
Risk Warning
Trading foreign exchange, CFDs, and other leveraged financial instruments involves substantial risk of loss and is not suitable for all investors. The strategies and tools discussed on this page are provided for educational purposes only and do not constitute financial advice, investment recommendations, or solicitation to trade. Always consult a qualified financial adviser before making trading decisions. Past backtest performance is not indicative of future results.
Downloads
- Expert Advisor: EmaRibbonExpansionBreakout.ex5 (56 downloads)
- Source Code: EmaRibbonExpansionBreakout.mq5 (61 downloads)
- Documentation: EmaRibbonExpansionBreakout.pdf (59 downloads)