Disclaimer: This article is for educational and informational purposes only. It does not constitute financial or investment advice. Trading forex and CFDs carries significant risk of loss. Past performance of any strategy — including backtests — does not guarantee future results. Never trade with money you cannot afford to lose.
What Is This Strategy?
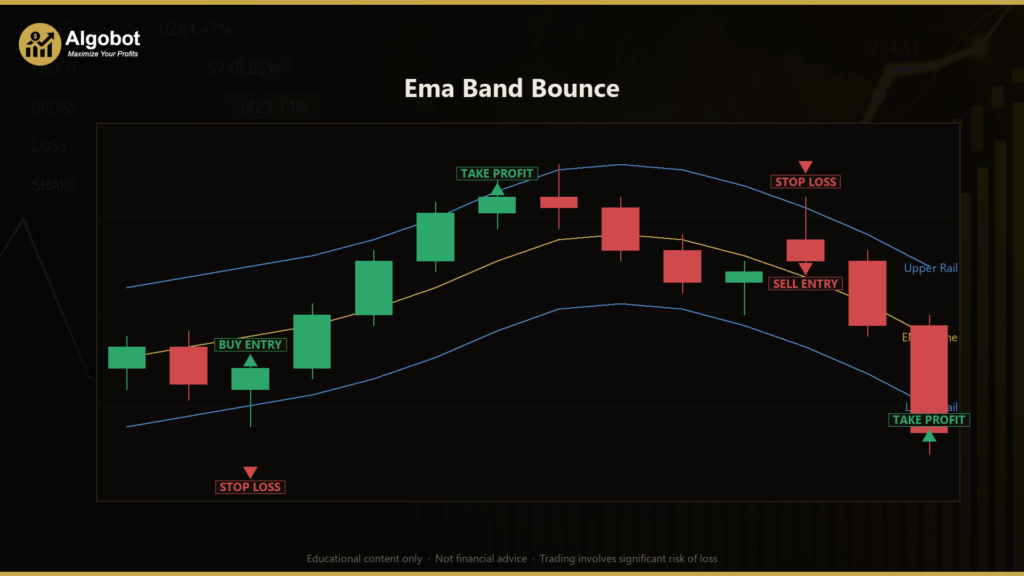
The Ema Band Bounce is a with-trend Keltner-channel pullback strategy that combines an Exponential Moving Average (EMA) "spine" with volatility-based rails to time entries in the direction an existing trend is already moving. An EMA is a moving average that gives more weight to recent prices, so it reacts faster than a simple average; a Keltner channel wraps that EMA in an upper and lower rail set a certain distance away using the Average True Range (ATR), a common measure of how much price typically moves per bar. Together they form a dynamic "band" around price.
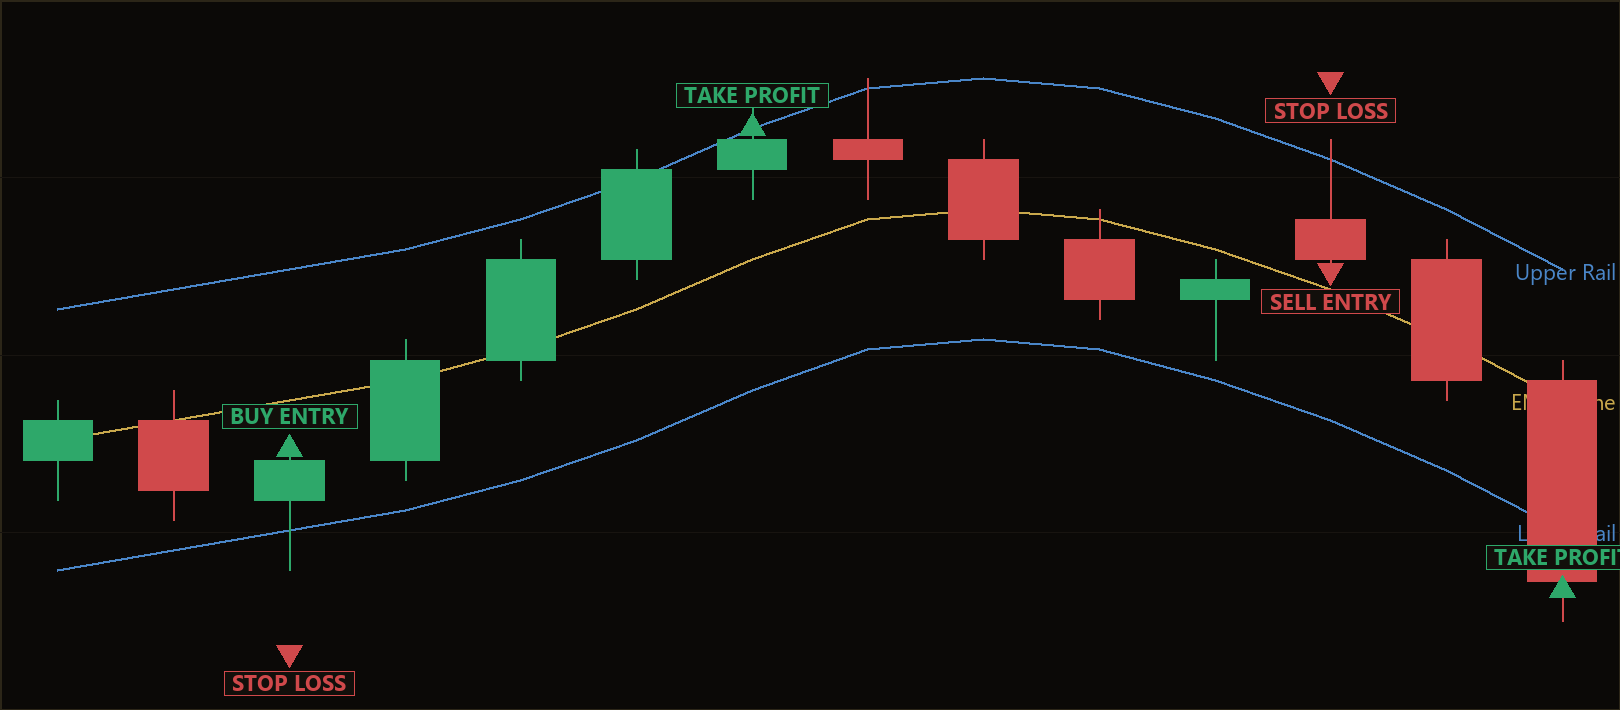
What makes this approach distinct is its direction. Many band-based systems fade the extremes — they sell when price stretches to the upper rail and buy when it reaches the lower rail, betting on a reversal. The Ema Band Bounce does the opposite. It reads trend direction from the slope of the EMA itself over a lookback window, and then uses a temporary poke of the band as a pullback entry with the prevailing trend. In an uptrend it waits for a dip to the lower rail that gets bought back up; in a downtrend it waits for a spike to the upper rail that gets sold back down. The idea is to join momentum on a discount rather than fight it.
As a learning tool, this strategy is well suited to traders who want to study trend-following pullback logic, channel construction, and structural stop placement in a single, self-contained system. It uses no second timeframe and no additional indicators — everything is derived from the primary chart. That simplicity makes it a clean example for understanding how slope filters, volatility bands, and reward-to-risk exits interact. It is offered here as a strategy to analyze and understand, not as a shortcut to results.
How It Works
The strategy evaluates one freshly-completed candle at a time (the bar at shift 1) and only acts once per closed bar. On each new bar it recalculates the EMA spine, the ATR, and the two channel rails, then checks whether a valid pullback pattern has formed.
Trend filter (the slope):
- The strategy compares the EMA now to the EMA value
SlopeLookbackbars ago. - If the EMA is rising, the market is treated as an uptrend and only long setups are considered.
- If the EMA is falling, it is treated as a downtrend and only short setups are considered.
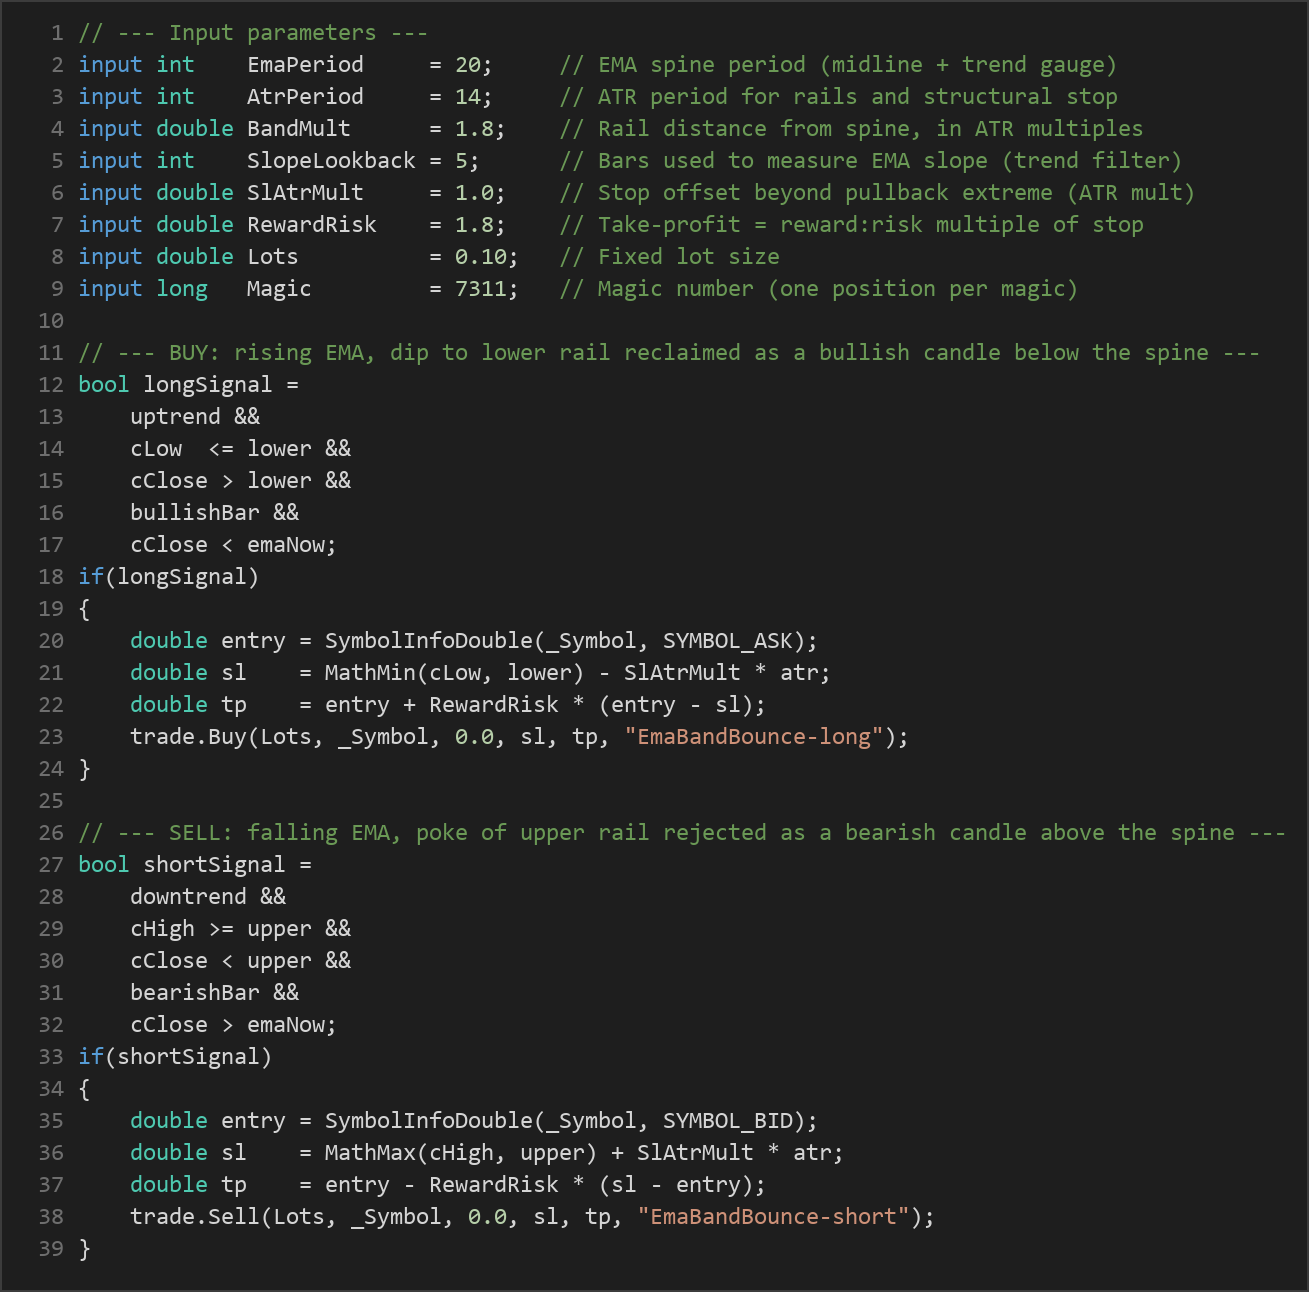
Long entry — the strategy signals a buy when all of these are true:
- The EMA slope is rising (uptrend).
- The signal bar's low dips to or below the lower rail (
Low <= lower) — price reached into the discount zone. - The bar closes back above the lower rail (
Close > lower) — buyers reclaimed it. - The bar is bullish (close above open).
- The close is still below the EMA spine, leaving room for price to revert upward toward the midline.
Short entry — the strategy signals a sell when all of these are true:
- The EMA slope is falling (downtrend).
- The signal bar's high pokes to or above the upper rail (
High >= upper). - The bar closes back below the upper rail (
Close < upper) — sellers rejected it. - The bar is bearish (close below open).
- The close is still above the EMA spine, leaving room to revert downward.
Stop-loss logic:
- For a long, the stop is placed just beyond the pullback extreme — the lower of the bar's low or the lower rail — minus an ATR-based buffer (
SlAtrMult ATR). This is a structural* stop: it sits below the level that would invalidate the bounce. - For a short, the stop mirrors this above the pullback high plus the same ATR buffer.
Take-profit logic:
- The distance from entry to stop defines the trade's risk.
- The take-profit is set at a reward-to-risk multiple of that distance (
RewardRisk). With the default of 1.8, the target sits 1.8 times as far from entry as the stop.
Position control: the strategy allows only one open position per magic number at a time, so it never stacks trades on the same symbol. Position size is a fixed lot value, and every rail, stop, and target is derived from the primary timeframe only.
Strategy Parameters
| Parameter | Default | Min | Max | Description |
|---|---|---|---|---|
| EmaPeriod | 20 | 10 | 60 | Period of the EMA spine — the channel midline and the trend-slope gauge. Higher values smooth the trend read; lower values react faster. |
| AtrPeriod | 14 | 7 | 30 | Lookback for the ATR used to size the rails and the structural stop. Larger values respond more slowly to volatility changes. |
| BandMult | 1.8 | 1.0 | 3.5 | Rail distance from the spine, in ATR multiples (the Keltner channel width). Wider bands require deeper pullbacks to trigger. |
| SlopeLookback | 5 | 2 | 20 | Number of bars used to measure the EMA's slope for the trend filter. Larger values demand a more sustained trend. |
| SlAtrMult | 1.0 | 0.3 | 3.0 | Extra stop offset beyond the pullback extreme, in ATR multiples. Larger values give the trade more breathing room. |
| RewardRisk | 1.8 | 0.5 | 4.0 | Take-profit distance as a multiple of the stop distance (the reward-to-risk ratio). |
| Lots | 0.10 | 0.01 | 1.0 | Fixed trade size in lots. |
Recommended Chart Settings
Because every calculation is drawn from the primary timeframe only, the Ema Band Bounce is designed to run on whatever symbol and timeframe you attach it to and backtest. There is no hardcoded market bias. That said, trend-pullback logic of this kind is most commonly studied on major forex pairs (such as EUR/USD or GBP/USD) on intraday-to-swing timeframes like H1 or H4, where trends tend to persist long enough for a slope filter to be meaningful and where ATR-based rails behave consistently.
Before committing to any setting, test the strategy across several symbols and timeframes in the MT5 Strategy Tester. Trend character, volatility, and spread differ from one market to another, and results will vary considerably across different conditions. Treat the defaults as a starting point for your own study, not as an optimized configuration.
How to Install on MetaTrader 5
- Download the .ex5 file from the link below
- Copy it to your MT5
MQL5\Expertsfolder - Restart MetaTrader 5 or refresh the Navigator panel
- Drag the EA onto a chart matching the recommended symbol and timeframe
- Configure the input parameters and enable Algo Trading
What to Consider Before Using This EA
Strengths of the approach. By entering with the trend on a pullback rather than fading extremes, the strategy aims to align with momentum while still buying into short-term weakness (or selling into short-term strength), which historically tends to offer more favorable entry prices than chasing breakouts. The structural, ATR-scaled stop adapts to current volatility instead of using a fixed pip distance, and the fixed reward-to-risk target enforces a consistent exit discipline. Its single-indicator construction also makes its behavior transparent and easy to reason about.
Known limitations. Trend-following pullback systems depend on trends actually continuing. In range-bound or choppy markets, the EMA slope can flip frequently and the rails may be poked repeatedly without follow-through, producing whipsaw losses. A pullback that keeps going — a genuine reversal rather than a bounce — will hit the structural stop. The slope filter reads direction from only two EMA points, so it can misjudge trend strength during transitions. Fixed lot sizing also means risk in account-currency terms grows or shrinks with the ATR-based stop distance rather than staying constant.
Where it may underperform. Expect the approach to struggle during low-volatility consolidation, around major news spikes that blow through structural stops, and on instruments with wide or erratic spreads relative to the ATR. No parameter set performs well in all regimes, which is why forward-testing on a demo account across varied conditions matters before any live consideration.
Risk Management Tips
Sound risk management matters more than any single entry rule. Consider these general principles as you study the strategy:
- Risk a small, fixed fraction per trade. Many educators suggest risking no more than 1–2% of account equity on any single position. Because this EA uses a fixed lot size, you may need to adjust the
Lotsvalue so the distance to your stop represents only that small percentage of your account. - Understand drawdown. Even a well-designed strategy will string together losing trades. Study the maximum peak-to-trough decline in testing so you know what you may need to tolerate emotionally and financially.
- Always demo first. Run the EA on a demo account across different symbols, timeframes, and market conditions before risking real capital. This reveals how it behaves in trends, ranges, and volatile spikes.
- Account for costs. Spreads, commissions, and slippage all erode results and are easy to overlook in idealized testing.
- Never over-leverage. Position sizes that look small can still represent large exposure once leverage is applied. Size conservatively and keep reserves.
Risk Warning
Trading foreign exchange, CFDs, and other leveraged financial instruments involves substantial risk of loss and is not suitable for all investors. The strategies and tools discussed on this page are provided for educational purposes only and do not constitute financial advice, investment recommendations, or solicitation to trade. Always consult a qualified financial adviser before making trading decisions. Past backtest performance is not indicative of future results.
Downloads
- Expert Advisor: EmaBandBounce.ex5 (56 downloads)
- Source Code: EmaBandBounce.mq5 (61 downloads)
- Documentation: EmaBandBounce.pdf (64 downloads)